XABCD TRADING
Blank Chart in NinjaTrader 8? Follow These Steps.
Subscribe
to get alerts to our next blog post!
Step 1 - Check Your Data Connection
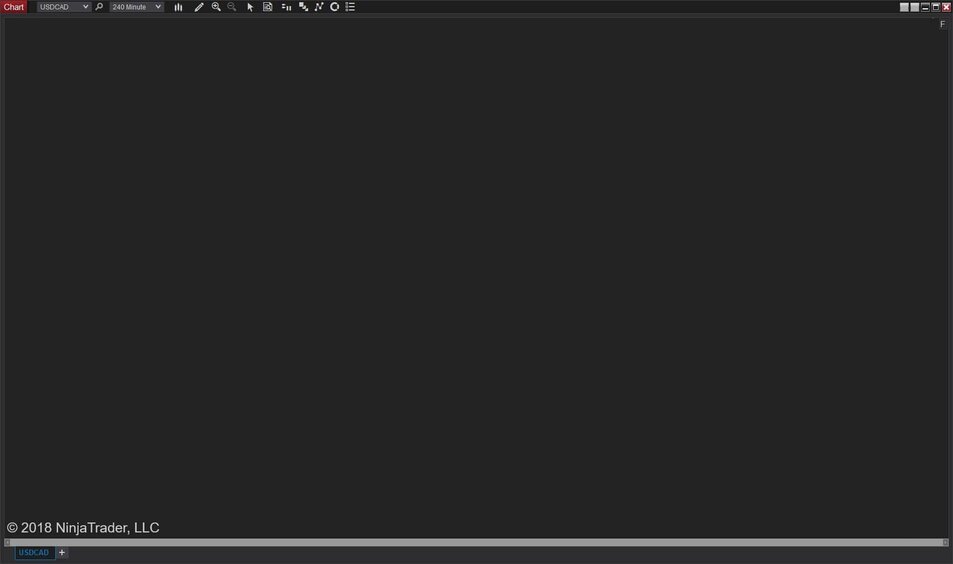
Getting a blank chart in NinjaTrader 8? Does it appear your charts are not loading? Not a problem, we'll help you fix it. Checking your data connection might be the most obvious, but it is the most likely culprit. NinjaTrader 8 does not come with chart data, you have to add it by creating a "Connection" to a data provider.
Kinetick End of Day (Free): This is a data connection that comes with NinjaTrader by default but the data is only supplied on a DAILY chart, if you want intra-day you need to connect a new data feed.
How To Check Your Data Connection
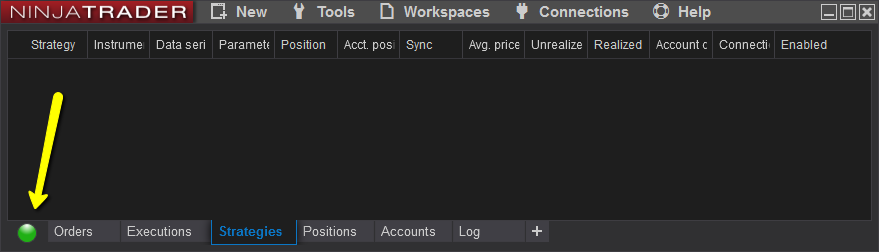
First, open up your Control Center. This is the first window that loads up NinjaTrader 8 and looks like the one below. Make sure you see a "Green Light" in the bottom left which will show you that your connected to your data provider.
If the light is red, it means your disconnected and your charts will not load or if it's orange/yellow it means you have a problem which could be a username/password issue or an expired account. Check the log tab to see the cause for why your charts are not loading.
Under your "Connections" menu at the top of the Control Center you can see a list of your current data connections. This is where you can also add connections by hitting "Configure" at the bottom of the "Connections" menu.
Need A Data Provider?
If you need FOREX data, you will need a data provider that will give that to you - good thing is it's free. Our walkthrough on how to trade forex in NinjaTrader lists the free FX data sources, broker choices, and platform fees so you can connect quickly.
If you need Futures data, you can get a trial of futures data for 2 weeks. After that you can watch our video on how to get futures data for $1. Everybody has to pay for futures data. There is no way to get around it as it's all charged by the exchange and your broker. If you use a data feed provider will pass that charge onto you.
Step 2 - Check Your Data Series Settings
By default, NinjaTrader loads 5 days of data. This could look fine if your viewing this on a 1 minute chart. However, if your viewing it on a daily you might only see 5 candlesticks and that's it.
Try expanding your data series to load more data. To do this:
- Open a chart
- Right click anywhere on the chart and go to Data Series...
- Look for where it says: "Load Data Based On:" and change this to "Bars", then below where it now reads "Bars to load" put the number 1000. This will load up 1000 bars of past data which should probably be enough for you, if not feel free to change this value.
- Hit the "Preset Minute" and save it. Change the chart to a daily time frame and repeat the steps.
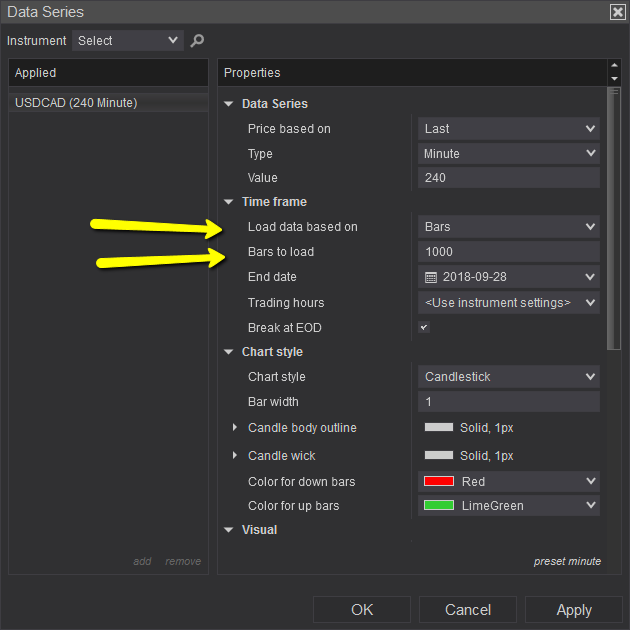
Important Note: Make sure that whatever data series settings you save for the minute chart, you do for the daily. Daily charts have their own settings which differ from the minute settings.
Step 3 - Clear Cached Data
Every time your connected to your data feed, that data is saved to your local computer so it doesn't have to be re-downloaded. If this data gets corrupted, you can have problems viewing it or having it not show up at all. Clearing the cached data will force the NinjaTrader program to redownload new data which should not be corrupt.
Follow these steps to delete your cached data:
- Close the NinjaTrader Platform
- Navigate to the following folder: Documents -> NinjaTrader 8 -> db folder -> cache folder
- Select all files-->Right mouse click-->Delete
- Restart NinjaTrader
- Reconnect your data feed and open your chart
Step 4 - Still Stuck?
Is the connection light in the control center green? Have you seen files in the cache folder to know that data is being downloaded? Have you checked the data series to make sure your loading enough data? If all else has failed, feel free to comment below with any additional details and we'll be more than happy to help lend you a hand.
Once It's Fixed, Grab News Markings On Your Chart
Once you get the data onto your charts, you should consider having news events marked on there too. The worst thing you can have happen is a news event comes out that catches you off guard. Our XABCD News software will allow you to stay in the know and be well aware of many news events that are released each week.
Frequently Asked Questions
What is a blank chart used for?
A blank chart is used as an empty template for organizing, tracking, or displaying data in a structured format. It allows users to customize rows, columns, labels, and categories to fit their specific needs, whether for school projects, work schedules, habit tracking, or data collection.
Where can I find a printable blank chart template?
Printable blank chart templates are widely available on educational websites, template platforms, and office productivity tools. You can download and print them in various formats such as PDF, Word, or Excel to suit different purposes like scheduling, record-keeping, or classroom activities.
How do I create a blank chart in Excel or Google Sheets?
To create a blank chart in a spreadsheet application, open a new document and format cells by adjusting column widths and row heights to your desired size. You can add borders, headers, and labels to create a clean, organized grid ready for data entry.
What types of blank charts are available?
Common types include blank grid charts, T-charts, comparison charts, hundreds charts, chore charts, and blank graph paper. Each type serves a different purpose, from mathematical exercises and data visualization to daily planning and organizational tasks.
Can I use a blank chart for classroom or educational purposes?
Yes, blank charts are widely used in classrooms for activities such as tracking student progress, teaching data organization, practicing math skills, and building vocabulary. Teachers often use printable blank chart templates as versatile tools that students can fill in during lessons or homework assignments.
Frequently Asked Questions
What is a blank chart used for?
A blank chart is used as an empty template for organizing, tracking, or displaying data in a structured format. It allows users to customize rows, columns, labels, and categories to fit their specific needs, whether for school projects, work schedules, habit tracking, or data collection.
Where can I find a printable blank chart template?
Printable blank chart templates are widely available on educational websites, template platforms, and office productivity tools. You can download and print them in various formats such as PDF, Word, or Excel to suit different purposes like scheduling, record-keeping, or classroom activities.
How do I create a blank chart in Excel or Google Sheets?
To create a blank chart in a spreadsheet application, open a new document and format cells by adjusting column widths and row heights to your desired size. You can add borders, headers, and labels to create a clean, organized grid ready for data entry.
What types of blank charts are available?
Common types include blank grid charts, T-charts, comparison charts, hundreds charts, chore charts, and blank graph paper. Each type serves a different purpose, from mathematical exercises and data visualization to daily planning and organizational tasks.
Can I use a blank chart for classroom or educational purposes?
Yes, blank charts are widely used in classrooms for activities such as tracking student progress, teaching data organization, practicing math skills, and building vocabulary. Teachers often use printable blank chart templates as versatile tools that students can fill in during lessons or homework assignments.
Still have a question about this?Ask the XABCD team in Live Chat and get help with your setup.Ask in Live Chat →
New NinjaTrader Articles Delivered First
Free tutorials, fixes and setup guides by email. Two emails a month at most.
Free tutorials, fixes and setup guides by email. Two emails a month at most.
Recommended Tool
XABCD ATM Pack
23 free ATM strategy templates for NinjaTrader 8. Import them and start with your stops and targets already set up.
Get the Free ATM Pack →
Recommended Video
Ditch NinjaTrader ATMs: This Is More Powerful
See how to set your risk and calculate contracts directly on the chart.
Watch Now
Subscribe on YouTube
Related Tool
XABCD ATM Pack
23 free ATM strategy templates for NinjaTrader 8. Import them and start with your stops and targets already set up.
Get the Free ATM Pack
Why XABCD Trading
- Built for NinjaTrader 8 since 2009
- Trusted by 2,000+ traders
- On-chart tools, no ATM templates needed
- Free tools to get started
Get Project Updates
Twice-monthly maximum, we will give you updates on all the projects going here.
Quick Links