XABCD TRADING
What Is The Best Chart Pattern To Trade?
Subscribe
to get alerts to our next blog post!
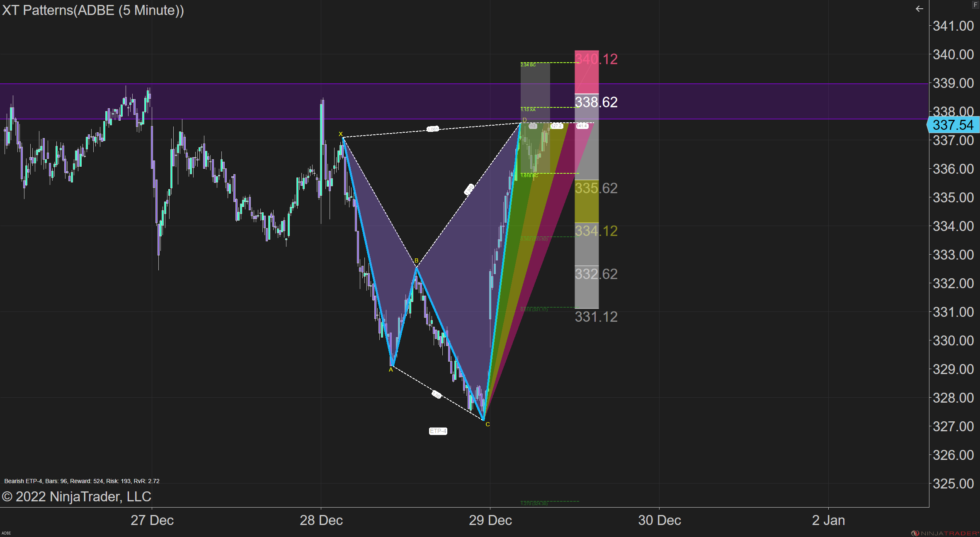
The best chart pattern to trade that we like is the ETP-4 XABCD Pattern as shown above, which will give you a lot of options but also allow you to maintain consistency in your approach with a very specific rule set. This pattern also will be able to tell you when the chart pattern is no longer valid and has expired which is unique to the XABCD set of patterns.
What Are The Different Types of Chart Patterns for Day Trading?
The 3 main categories of chart patterns are:
- Classical Chart Patterns
- Advanced Chart Patterns
- XABCD Chart Patterns
Classical chart patterns were first used and discovered very early on where advanced chart patterns came to use more in the 70s/80s. Wasn't until more recently around 2015 that XABCD Patterns caught the attention of many due to the ability to use both time and price when constructing patterns. This was the first introduction into using time and price with patterns.
Classical Chart Patterns
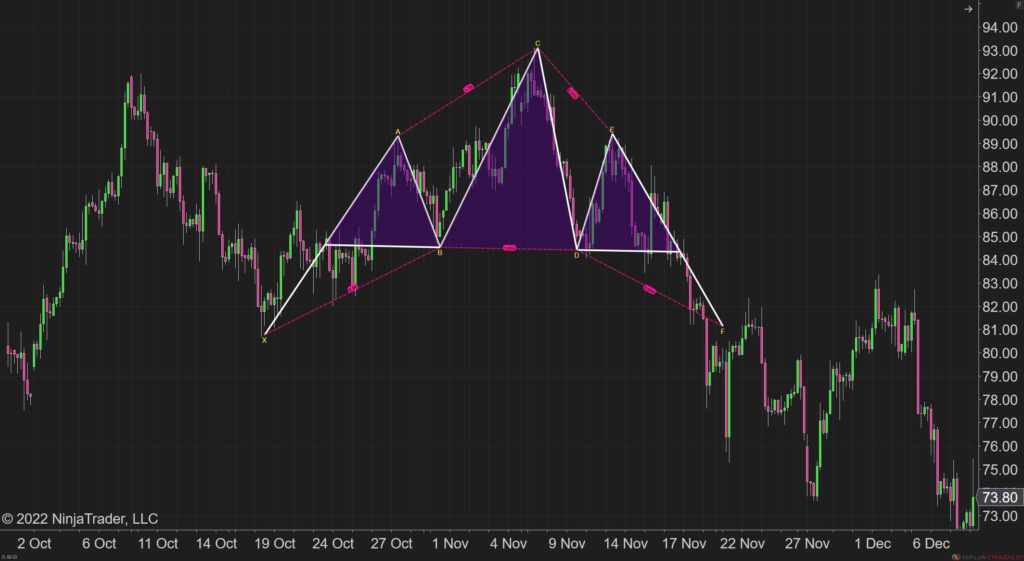
Chart Pattern: Head and Shoulders on a CL Futures Chart (Oil)
Some common chart patterns that traders may use include head and shoulders, double tops and bottoms, flag and pennant patterns, and triangles. These patterns can often provide clues about the direction and strength of the trend, as well as potential areas of support and resistance.
It's also important to consider the context in which a chart pattern is forming. For example, a chart pattern may be more reliable if it is forming after a prolonged trend, rather than in the middle of a range-bound market. Additionally, it's important to consider other factors that can impact the market, such as economic data, news events, and the overall market trend.
In general, it's a good idea to use chart patterns in conjunction with other forms of analysis, such as fundamental analysis and technical indicators, to get a more complete picture of the market and make informed trading decisions.
Advanced Chart Patterns
Advanced chart patterns are more complex patterns that may be less commonly seen in the market then classical patterns, and can often provide more reliable signals about the direction and strength of the trend. These patterns can be more difficult to identify, as they may require a larger price move or a longer time frame to fully form.
One of the most common advanced chart patterns the pattern H.M. Gartley identifies in his book Profits in the Stock Market. These M and W shaped patterns later had price Fibonacci ratios added to them by Larry Pesavento which made them more consistent in the way they were measured.
It's important to keep in mind that advanced chart patterns are not always easy to identify, and they may require a bit of practice and experience to recognize them. As with any other form of technical analysis, it's important to consider the context in which the pattern is forming and to use other forms of analysis, such as fundamental analysis and technical indicators, to confirm the signal.
XABCD Chart Patterns
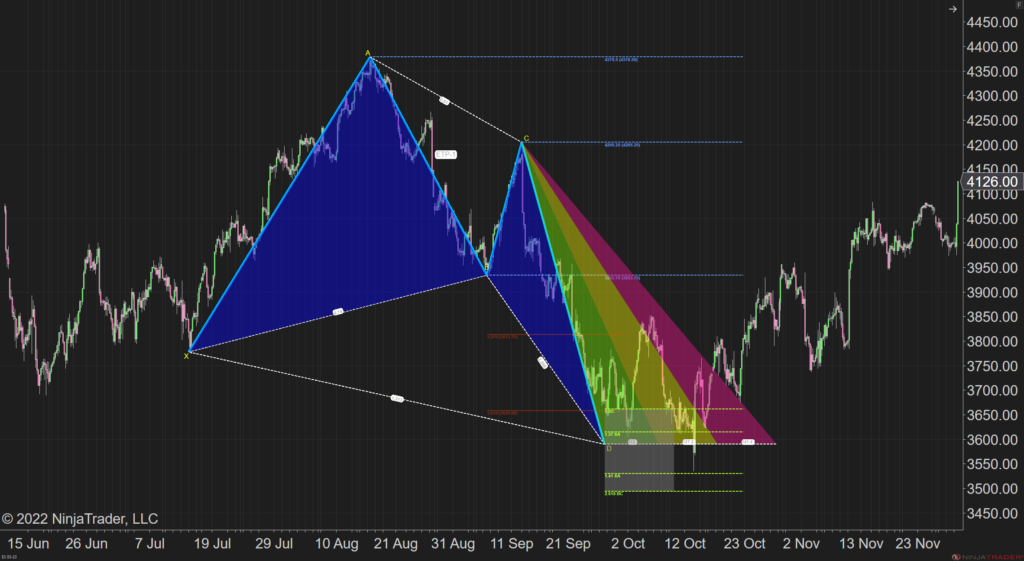
Chart Pattern: XABCD Pattern on an ES Futures Chart (SP500)
The XABCD pattern is a technical analysis pattern that is based on the idea that price and time moves in waves, and that these waves can be measured and forecasted using specific ratios. Time is explicitly a part of the XABCD pattern, as the pattern is based on the relationships between the price and time swings and their corresponding ratios.
There are two main categories of XABCD Patterns. RTP (retracement time patterns) and ETP (extension time patterns). Each category has a number of patterns that are common for traders to use. Eg. ETP-1, ETP-2, ETP-3 and ETP-4. Each follow a specific rule set to have the pattern form which easiest to find in the marketing by using software that scans and alerts you to each occurrence.
Is Chart Pattern Trading Profitable?
Chart pattern trading can be a profitable strategy, but like any other trading strategy, it carries risks and is not guaranteed to be successful. It's important to keep in mind that chart patterns are just one tool among many that traders can use to analyze the market and make trading decisions.
Successfully trading chart patterns requires a thorough understanding of the patterns and how they can be used to identify potential areas of support and resistance, as well as the potential direction and strength of the trend. It also requires a strong risk management strategy, as well as the ability to adapt to changing market conditions.
It's important to remember that no single trading strategy is guaranteed to be profitable, and it's important to do your own research and practice risk management when trading. It can also be helpful to seek the guidance of a financial advisor or professional trader if you are new to chart pattern trading or if you have questions about specific strategies.
How Do Chart Patterns and Risk Management Come Together?
Chart patterns can be very useful to maintain a level of consistency which includes looking at your risk vs reward for each chart pattern. The pattern gives you an entry area with a stop just outside, and a target can be as something as simple as a pattern point. With this information you can consistently look at the risk vs reward level the same way each time.
Risk management is an important aspect of trading and investing. It involves identifying, assessing, and prioritizing potential risks that could impact your trades or investments, and taking steps to minimize or mitigate those risks.
Effective risk management can help you protect your capital, minimize losses, and maximize your potential returns. It can also help you manage your emotions and make more informed and rational trading decisions.
There are a number of risk management techniques that traders and investors can use, such as setting stop-loss orders to limit potential losses, diversifying your portfolio to reduce the impact of any one position, and using risk-management tools such as options or futures contracts.
It's important to keep in mind that no trading or investing strategy is without risk, and it's important to carefully consider your risk tolerance and to allocate your capital appropriately. It can also be helpful to seek the guidance of a financial advisor or professional trader if you have questions about risk management strategies.
New NinjaTrader Articles Delivered First

Easy Order Tool
The Strategy

Scanning & Alerting

NinjaTrader Release

XABCD News (Free Version)
XABCD News (Community Edition) is the best free Indicator for NinjaTrader 8. Don't let news sneak up on you again. Puts economic news events on your charts so you can stay informed and move around positions/stops before the news is released. Works in any market.
XABCD Priceline (Free)
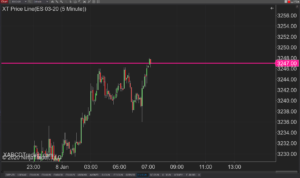
XABCD Price Line tool for NinjaTrader 8 will draw a line at current price and move every time the market changes price. This is useful because it will allow you to easily identify where price is at all times and the exact quoted price.
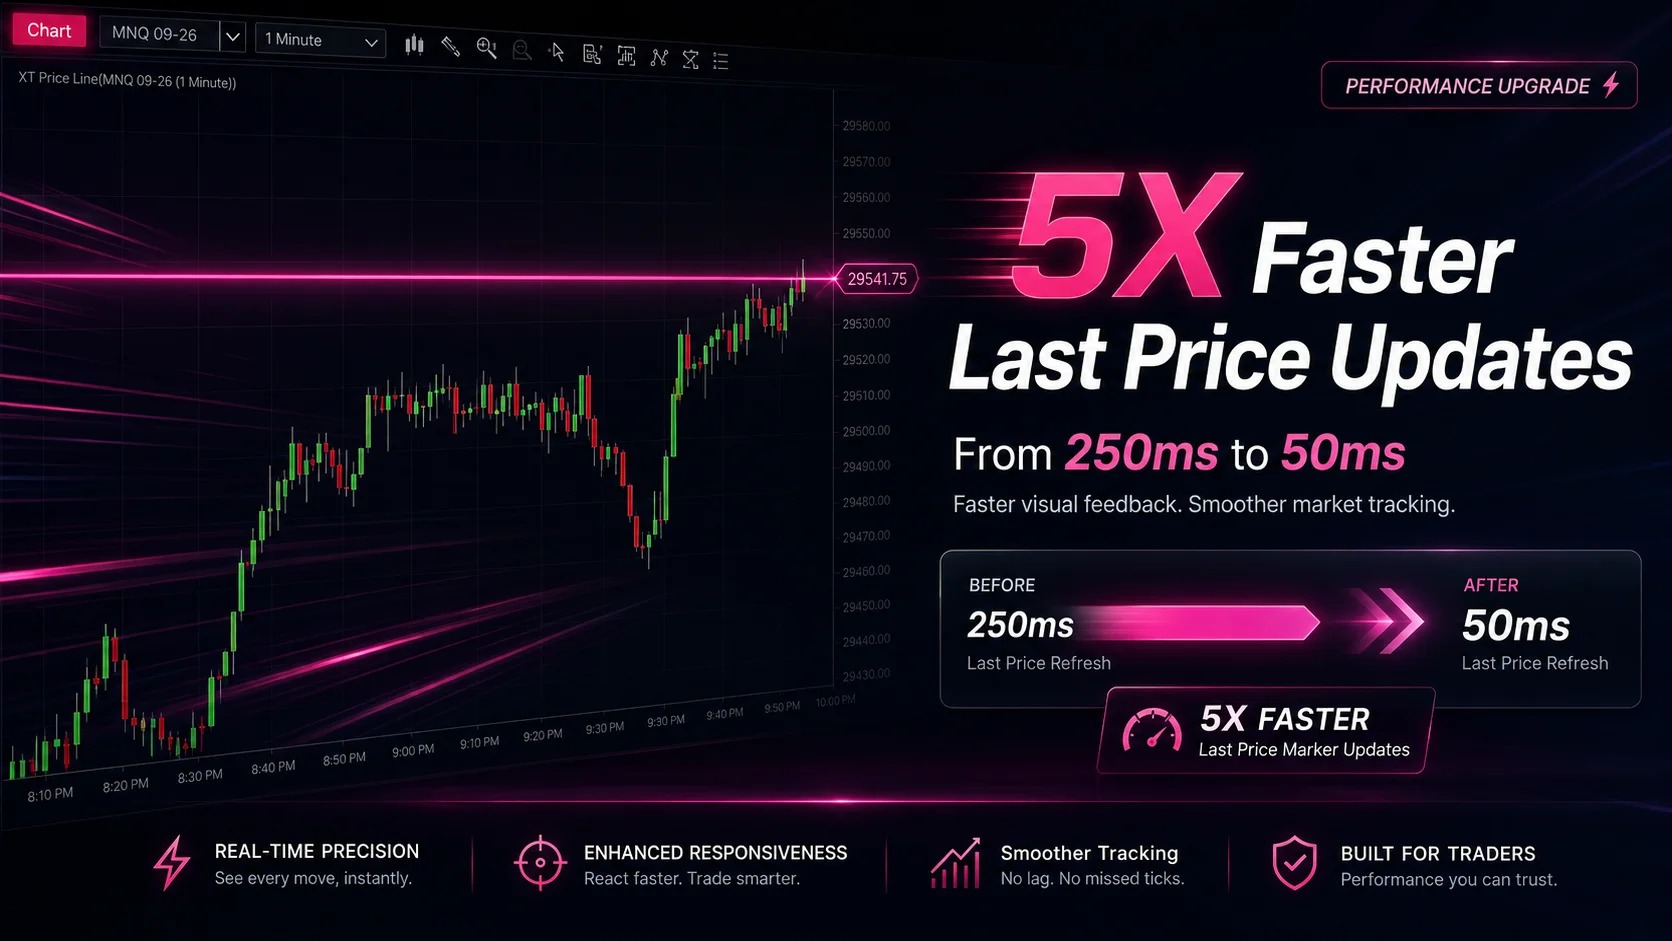
NinjaTrader Faster Last Price Updates on Charts Explained
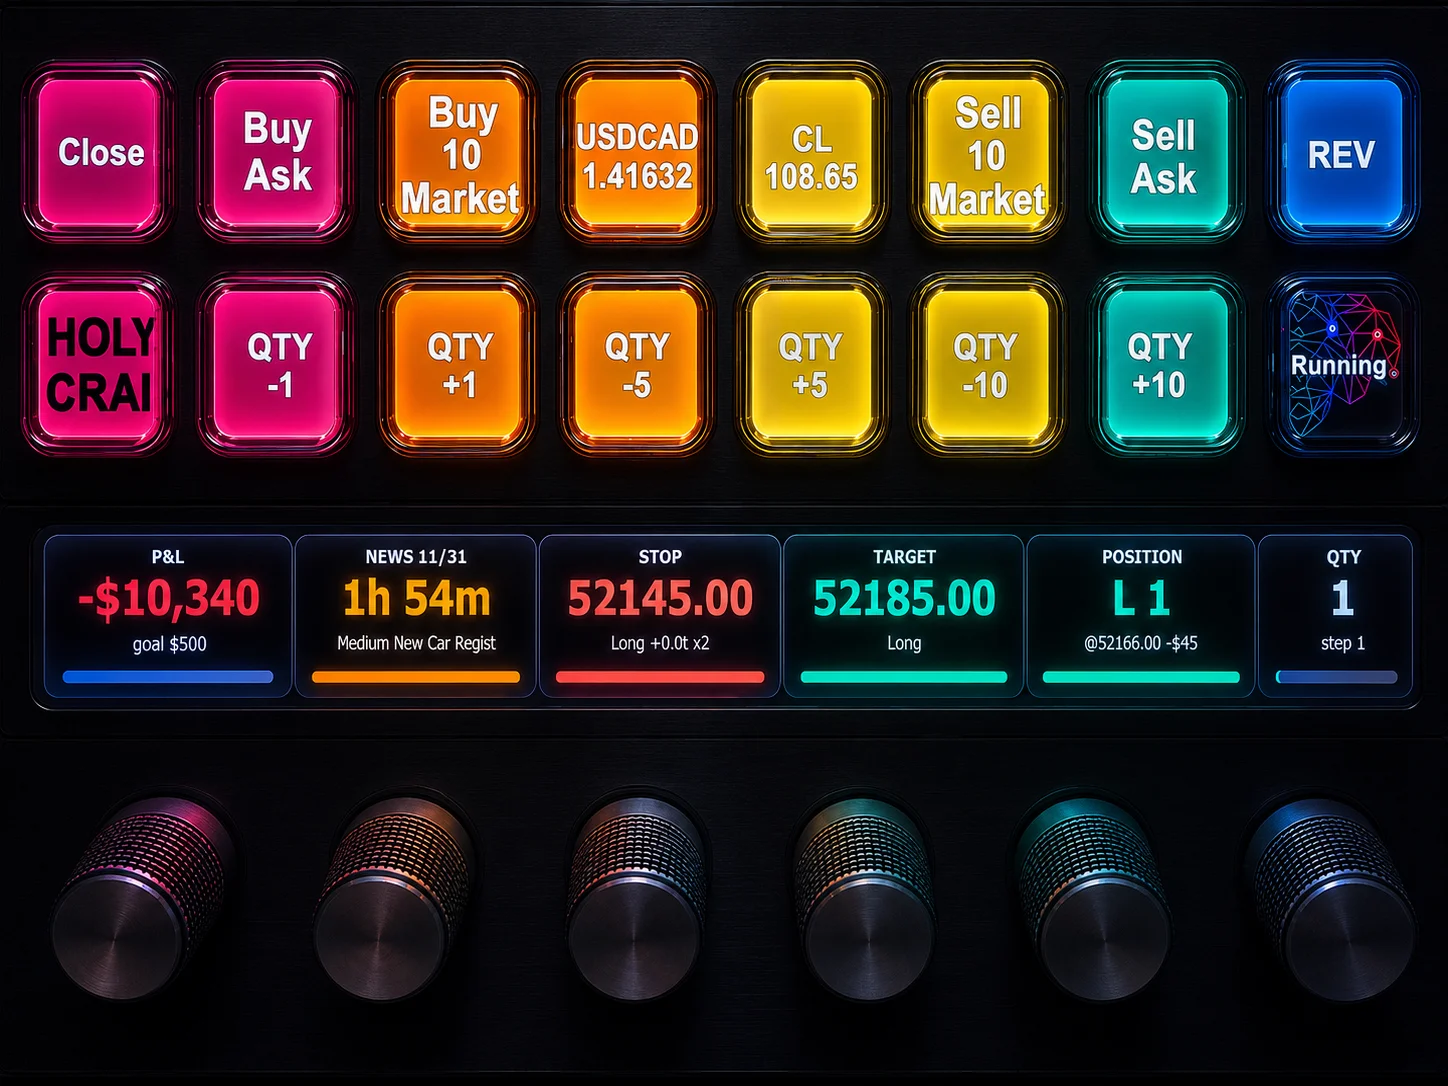
NinjaTrader 8 Hotkeys: Best Shortcuts for Faster Trading
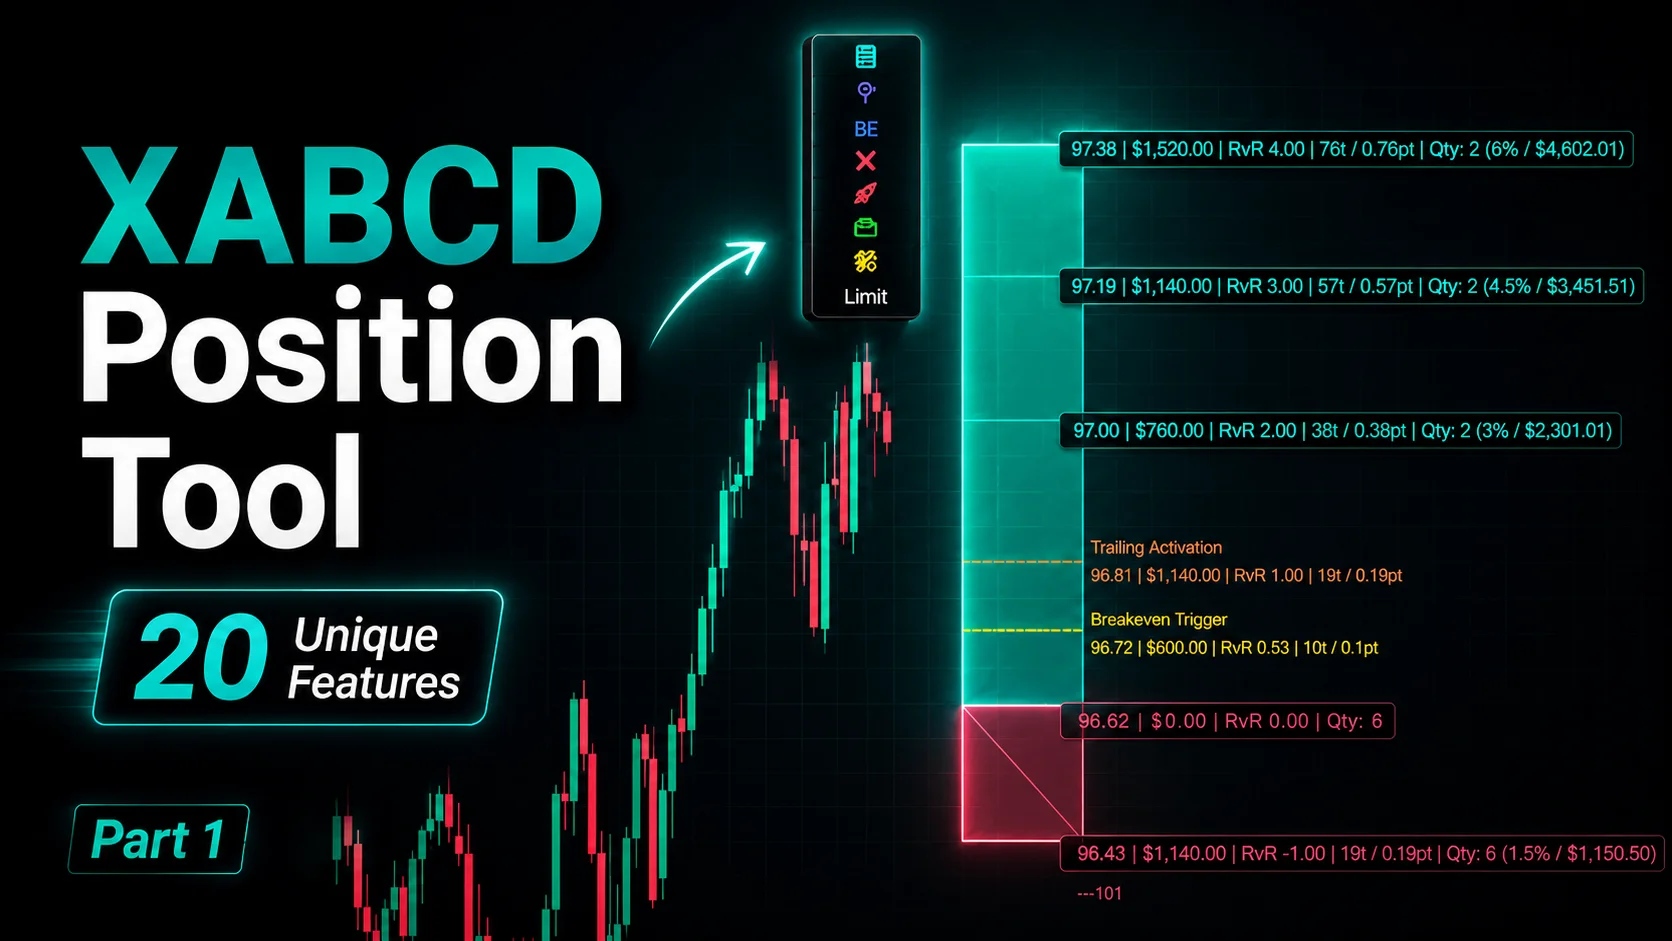
NinjaTrader Position Sizing Tool: 64 Features Stock NT8 Does Not Include
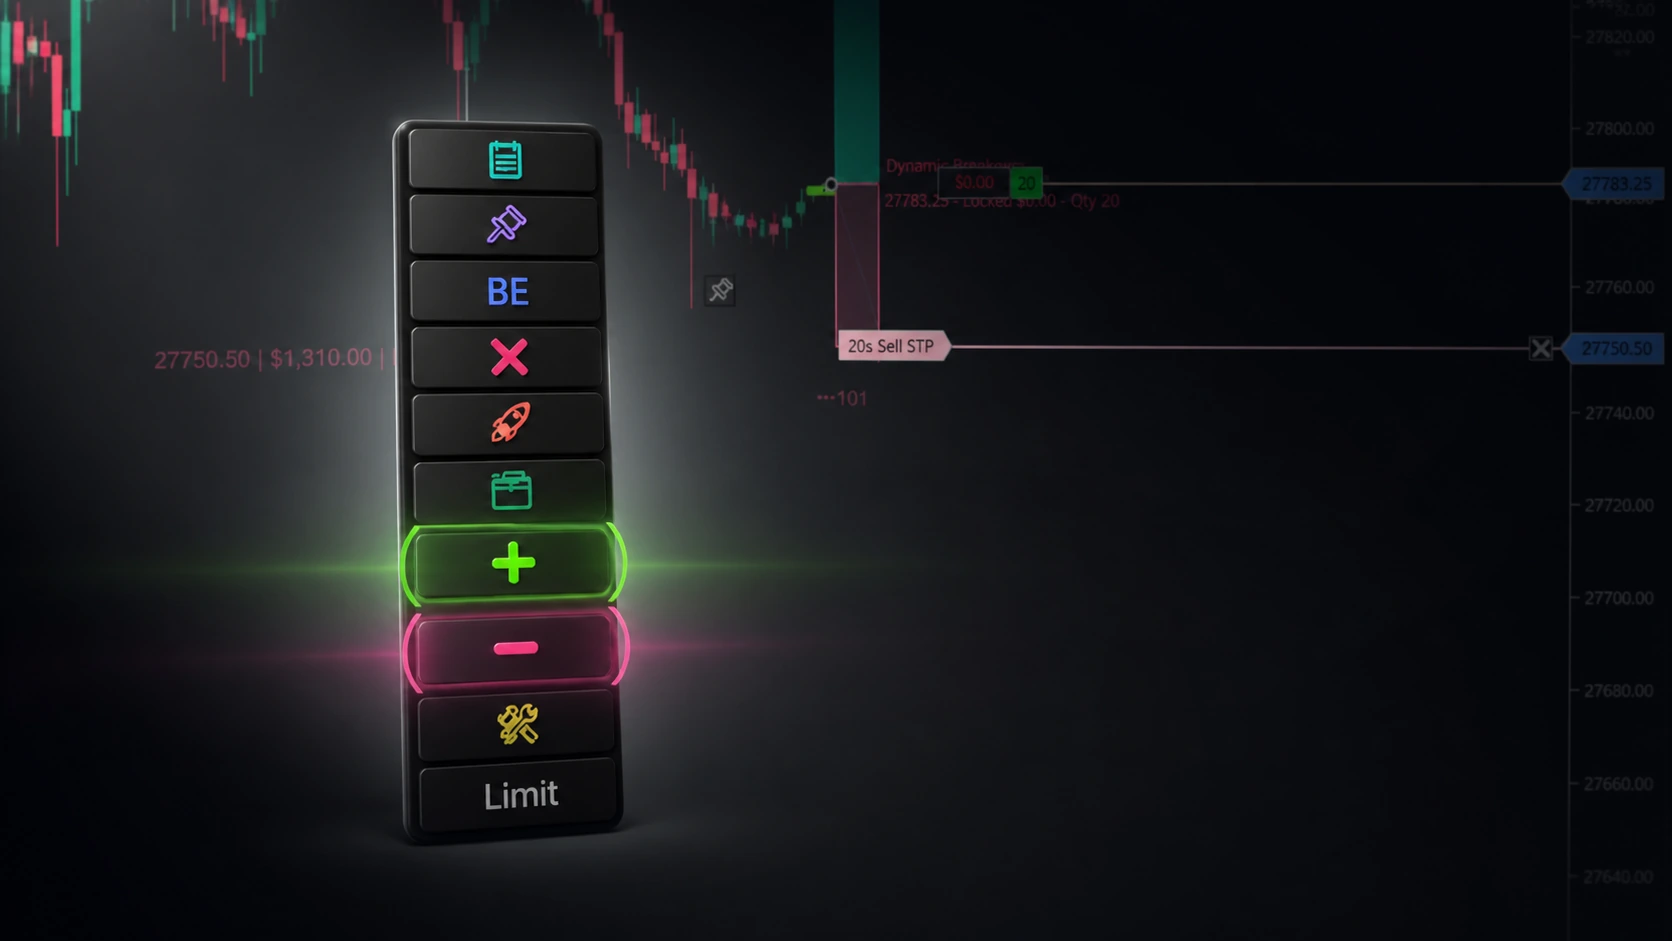
NinjaTrader – Adding to Position: A Field Guide for Active Traders
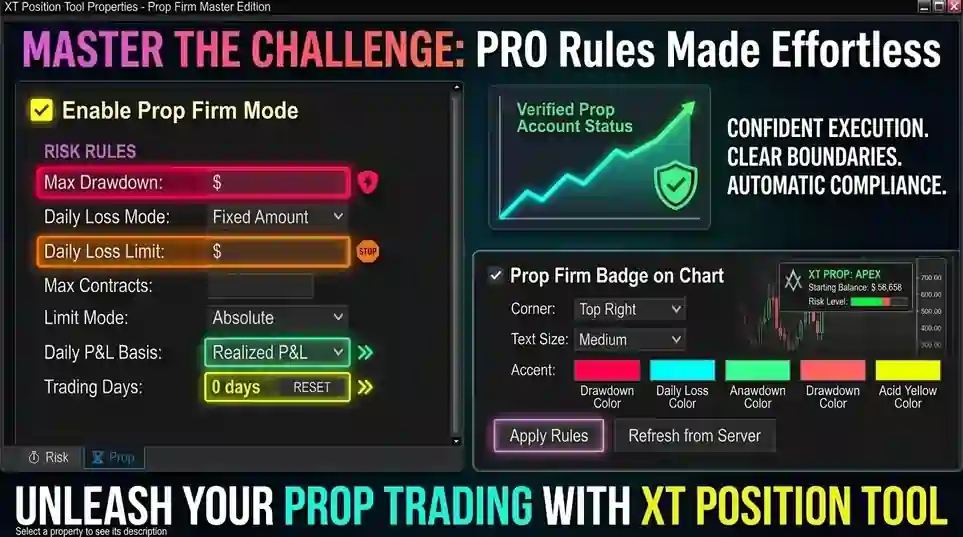
NinjaTrader Prop: The Ultimate Guide to Prop Firm Trading
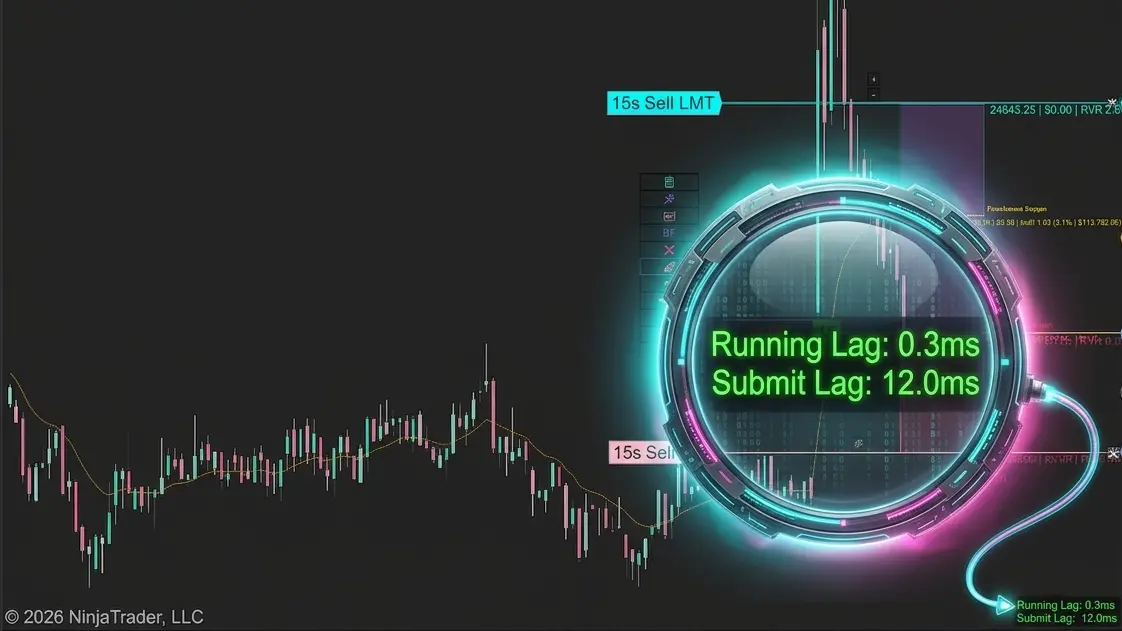
Does the XABCD Position Tool Lag?
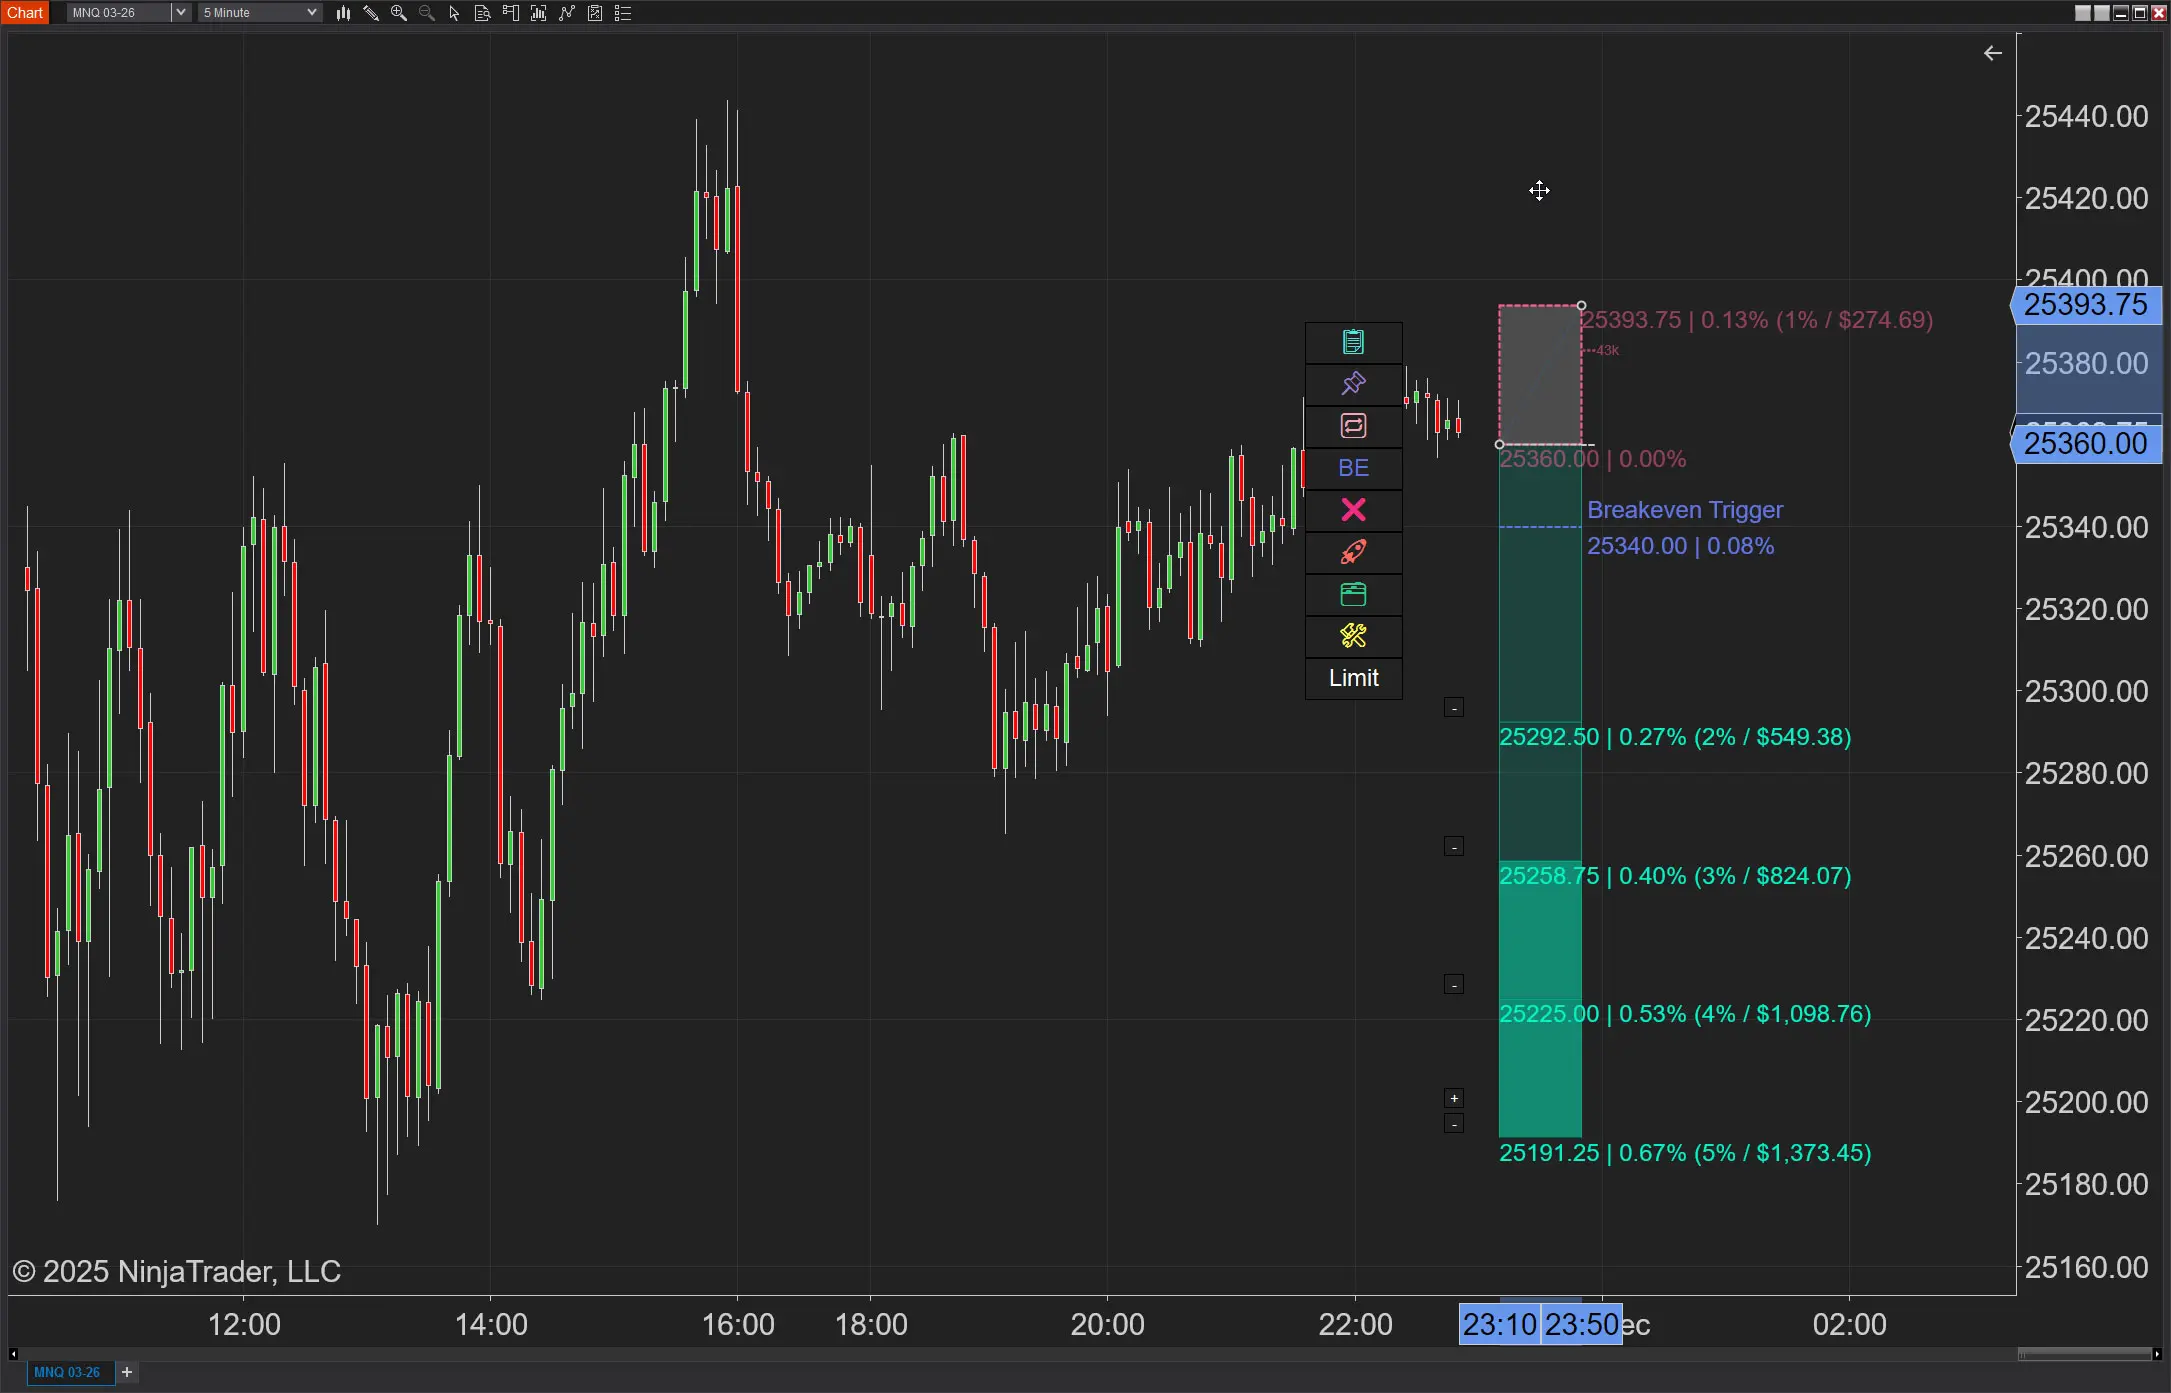
NinjaTrader Position Sizing: What the XABCD Position Tool Can Do That ATM’s Can’t
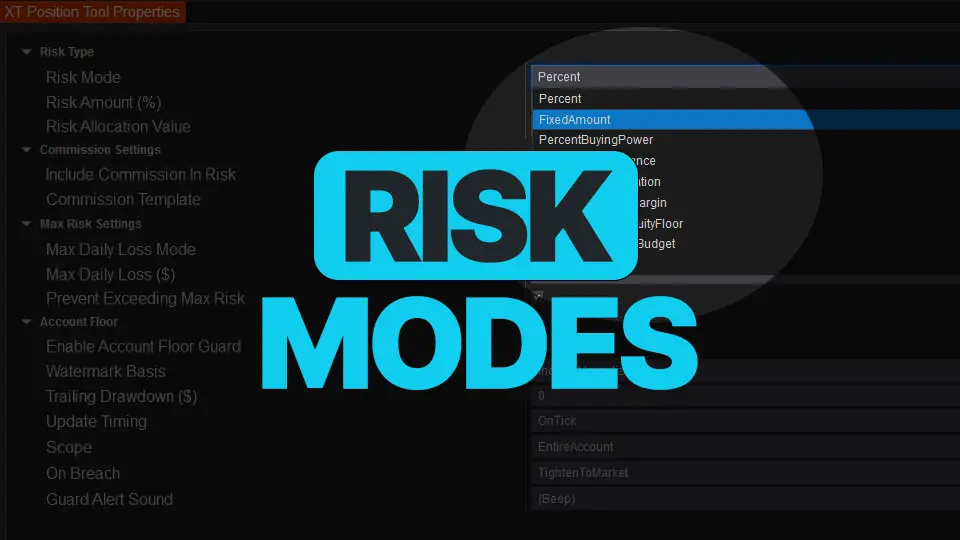
NinjaTrader Risk Management That Actually Moves the Needle
NinjaTrader 8.1.6 — The “No Fluff” Tour (Speed, Clarity, Fewer Clicks)