XABCD TRADING

Market Analyzer and Chart Patterns Not Syncing Up?
Subscribe
to get alerts to our next blog post!
Market Analyzer and Chart Not Matching the Right Patterns?
So you've noticed that your market analyzer is not syncing up with the chart - or the other way around. Why?
The answer is pretty simple. Your indicator has a list of properties and your market analyzer runs off the same properties but they are controlled differently.
First open up your indicator and take a screenshot of all the properties that are not the graphical settings. So more of the patterns/on/off or the validation and general category settings. Then go to your market analyzer and right click, click Columns and then select each time frame and make sure the properties there match the same settings in the indicator.
I made a video of this and found out which property was not set correctly. So if you're not sure how to do this watch the video as it might happen in the future and its good to know how to sync them back up.
Frequently Asked Questions
What is a Market Analyzer and how does it work?
A Market Analyzer is a market analysis tool that scans and evaluates multiple financial instruments simultaneously based on user-defined criteria such as technical indicators, price levels, and fundamental data. It works by continuously monitoring real-time and historical market data, then ranking or filtering symbols so traders can quickly identify opportunities that match their strategy.
How do I use the Market Analyzer in NinjaTrader 8?
In NinjaTrader 8, you can open the Market Analyzer from the New menu on the Control Center. From there you add instrument rows, configure columns with indicators or market data fields, and set up cell conditions that highlight values meeting your criteria. You can also create alert-based filters that notify you when specific conditions are triggered across your watchlist.
Can a Market Analyzer scan for real-time trading signals?
Yes, a Market Analyzer can scan for real-time trading signals by applying technical indicators, custom conditions, and alert rules that update dynamically as new price data arrives. This allows traders to monitor hundreds of instruments at once and receive immediate visual or audio alerts when a setup meets their predefined criteria.
What is the difference between a market analyzer and a stock screener?
A market analyzer typically operates in real time, continuously updating indicator values and conditions across multiple instruments throughout the trading session. A stock screener, by contrast, usually runs a one-time or periodic scan against a database of stocks using fundamental or end-of-day data. Platforms like NinjaTrader combine both concepts by letting users screen instruments with live-streaming analytical columns.
How many indicators and columns can I add to the Market Analyzer?
The number of indicators and columns you can add generally depends on the platform and your system's processing power. Most platforms allow dozens of custom and built-in indicator columns per analyzer window, though adding too many real-time columns across a large instrument list may impact performance. It is best practice to focus on the most relevant indicators to keep the display responsive and actionable.
Frequently Asked Questions
What is a Market Analyzer and how does it work?
A Market Analyzer is a market analysis tool that scans and evaluates multiple financial instruments simultaneously based on user-defined criteria such as technical indicators, price levels, and fundamental data. It works by continuously monitoring real-time and historical market data, then ranking or filtering symbols so traders can quickly identify opportunities that match their strategy.
How do I use the Market Analyzer in NinjaTrader 8?
In NinjaTrader 8, you can open the Market Analyzer from the New menu on the Control Center. From there you add instrument rows, configure columns with indicators or market data fields, and set up cell conditions that highlight values meeting your criteria. You can also create alert-based filters that notify you when specific conditions are triggered across your watchlist.
Can a Market Analyzer scan for real-time trading signals?
Yes, a Market Analyzer can scan for real-time trading signals by applying technical indicators, custom conditions, and alert rules that update dynamically as new price data arrives. This allows traders to monitor hundreds of instruments at once and receive immediate visual or audio alerts when a setup meets their predefined criteria.
What is the difference between a market analyzer and a stock screener?
A market analyzer typically operates in real time, continuously updating indicator values and conditions across multiple instruments throughout the trading session. A stock screener, by contrast, usually runs a one-time or periodic scan against a database of stocks using fundamental or end-of-day data. Platforms like NinjaTrader combine both concepts by letting users screen instruments with live-streaming analytical columns.
How many indicators and columns can I add to the Market Analyzer?
The number of indicators and columns you can add generally depends on the platform and your system's processing power. Most platforms allow dozens of custom and built-in indicator columns per analyzer window, though adding too many real-time columns across a large instrument list may impact performance. It is best practice to focus on the most relevant indicators to keep the display responsive and actionable.
New NinjaTrader Articles Delivered First
Recommended Video
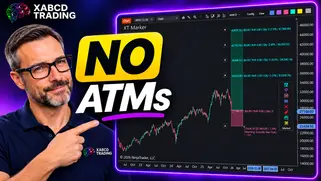
Ditch NinjaTrader ATMs: This Is More Powerful
See how to set your risk and calculate contracts directly on the chart.
Watch Now
Subscribe on YouTube
Related Tool
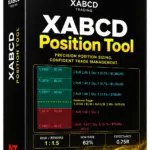
XABCD Position Tool
Automatic position sizing and on-chart trade management.
Explore the Tool
Why XABCD Trading
- Built for NinjaTrader 8 since 2009
- Trusted by 2,000+ traders
- On-chart tools, no ATM templates needed
- Free tools to get started
Get Project Updates
Twice-monthly maximum, we will give you updates on all the projects going here.
Quick Links
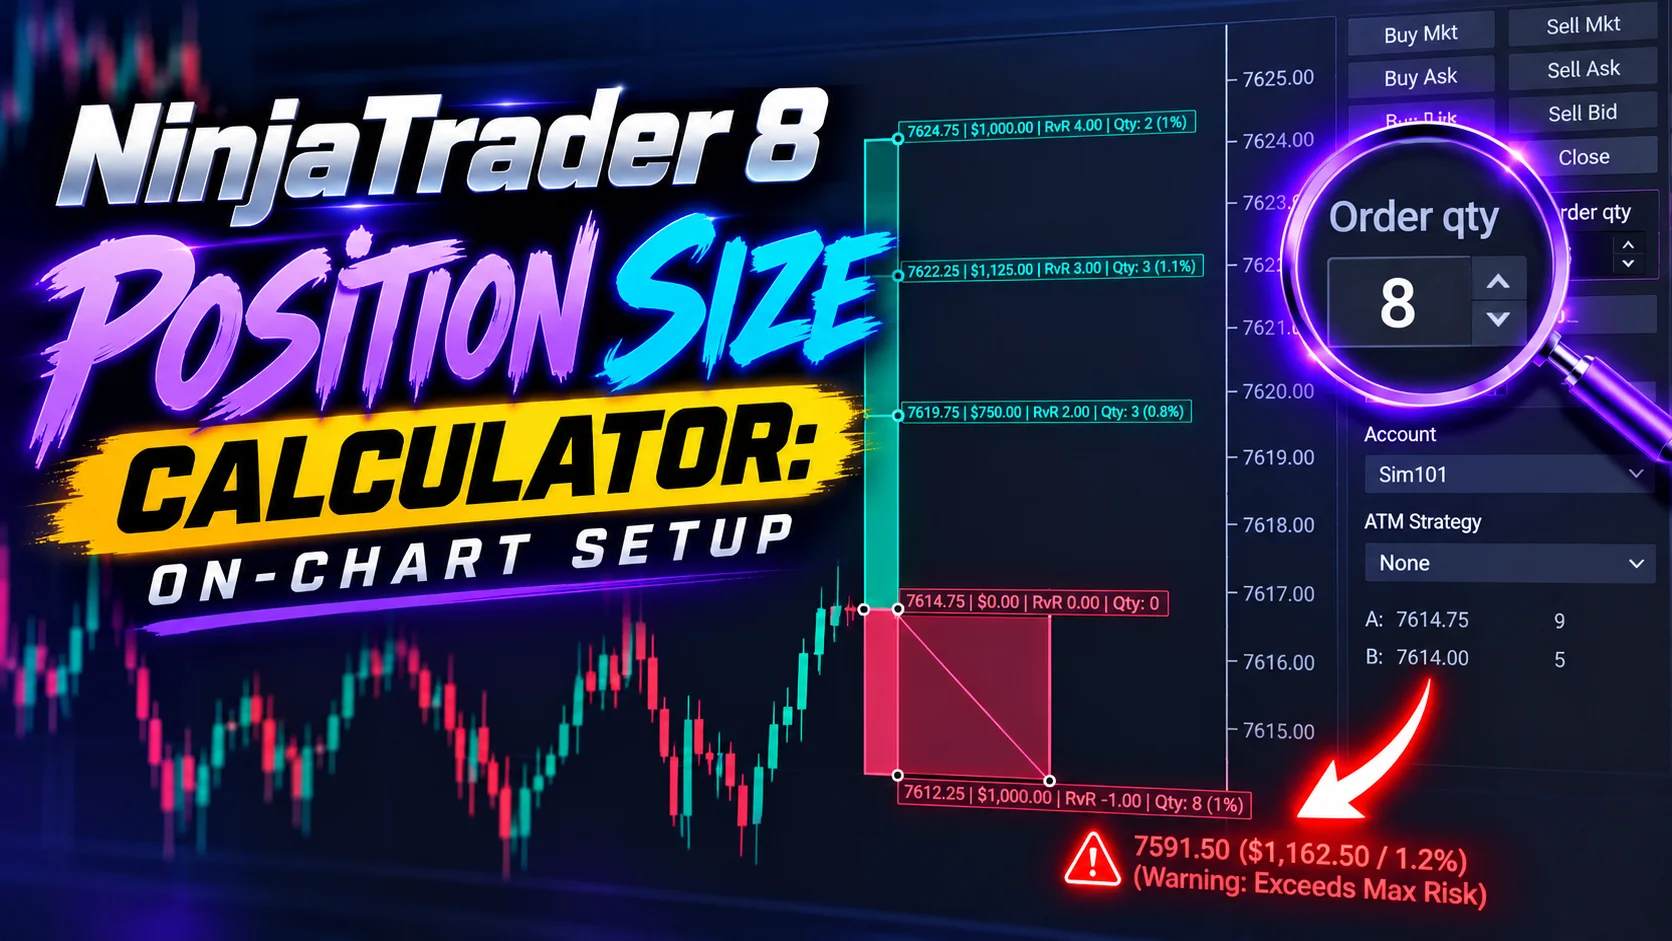
NinjaTrader 8 Position Size Calculator: On-Chart Setup
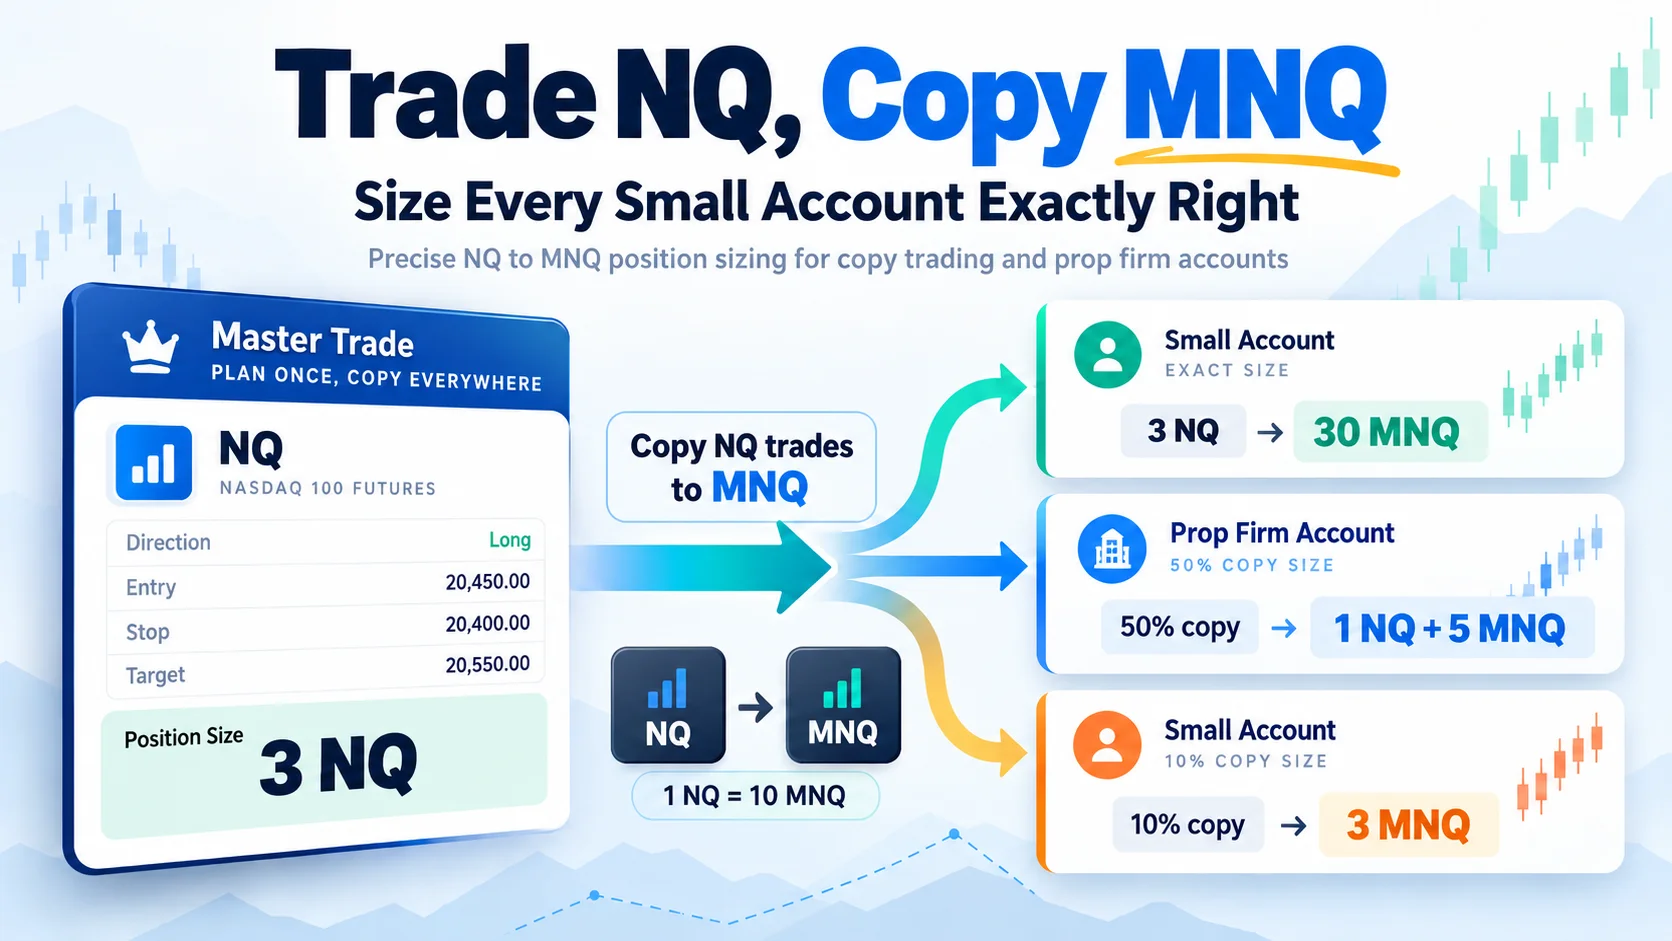
Trade NQ, Copy MNQ: Copy NQ Trades to MNQ in NinjaTrader 8
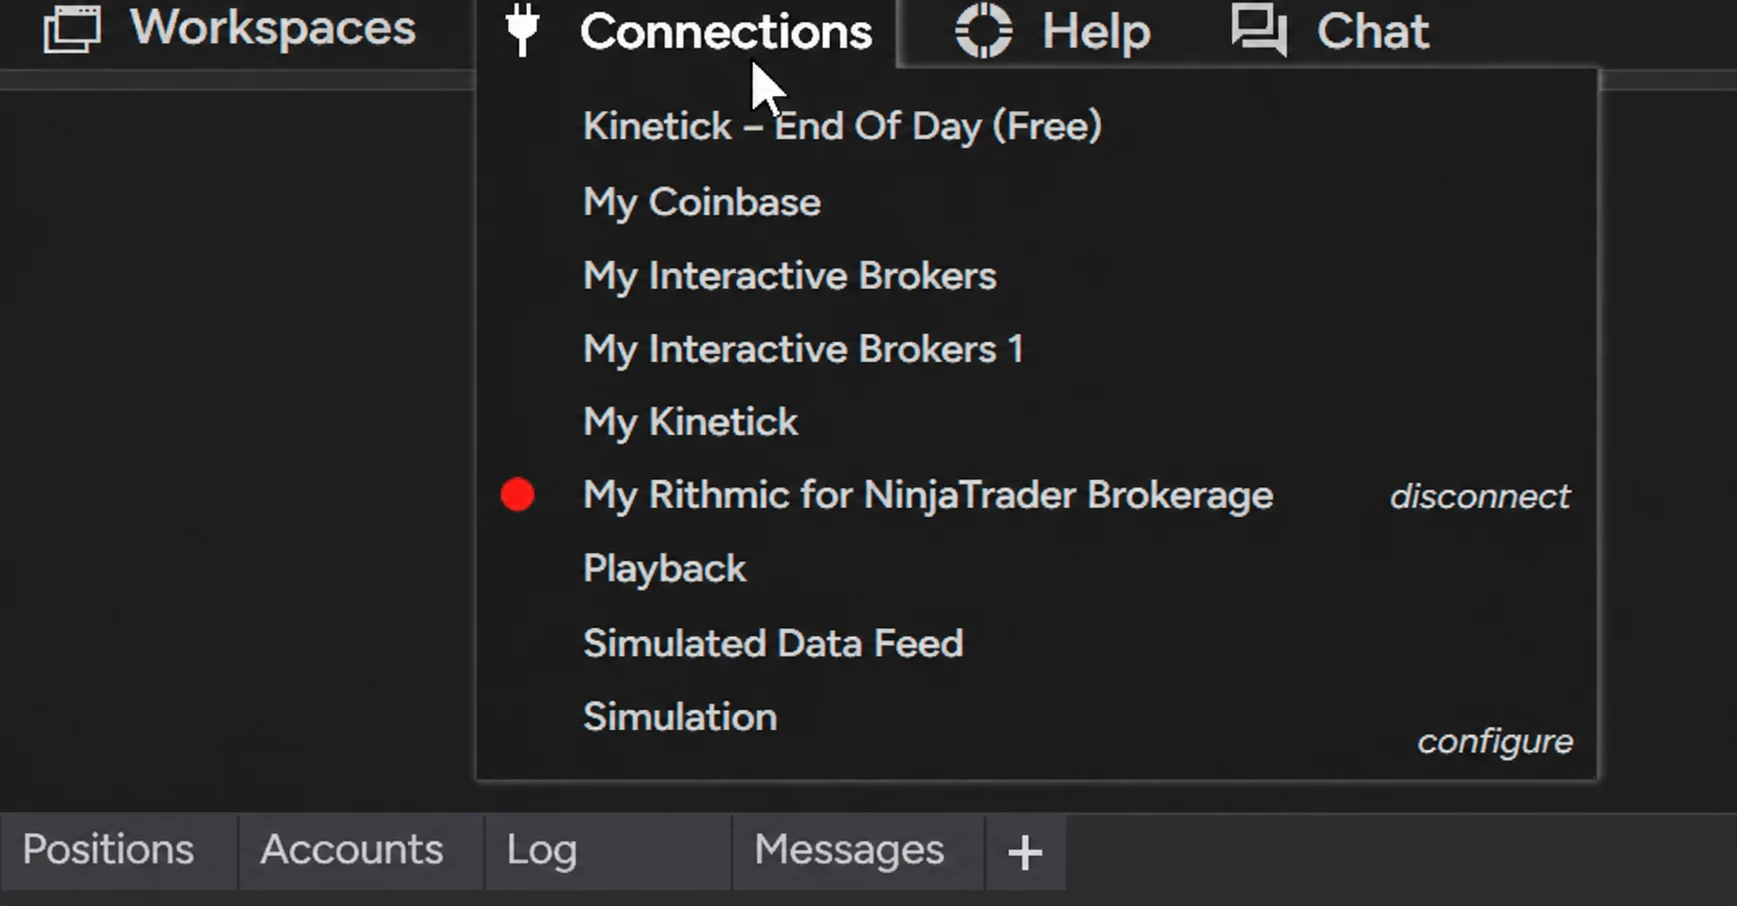
NinjaTrader Data Feed Not Updating? Quick Fixes
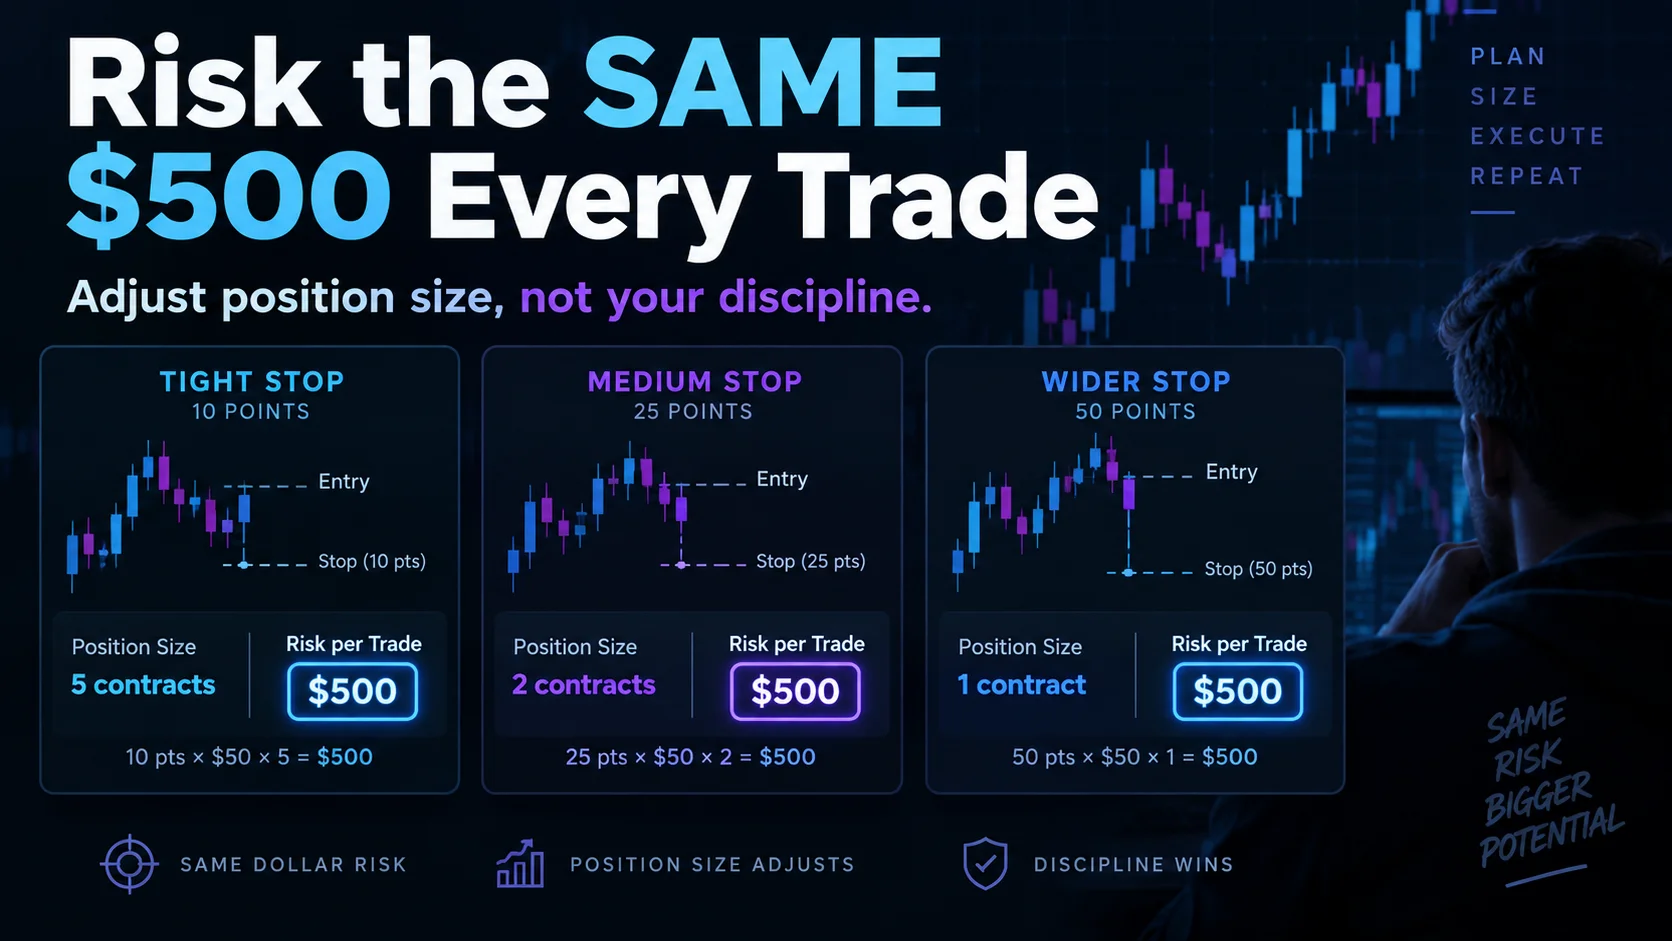
NinjaTrader Risk Per Trade: Risk $500 on Every Trade
NinjaTrader 8.1.8 Review: Should You Upgrade or Wait?
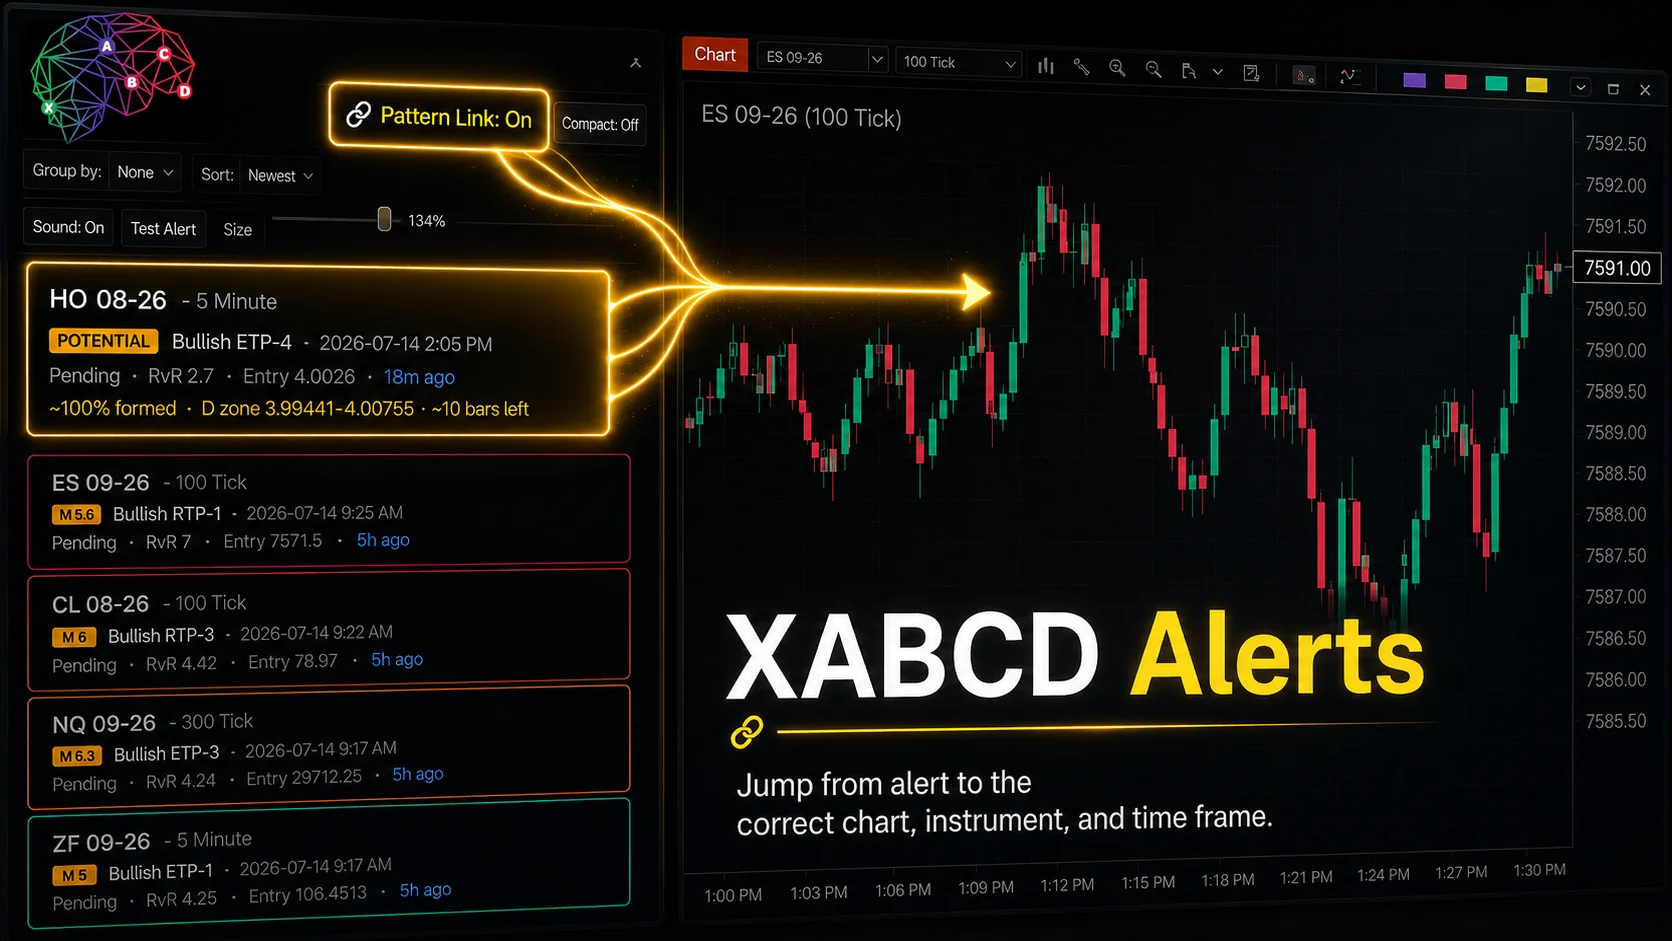
XABCD Pattern Alerts: The Complete Guide for Traders
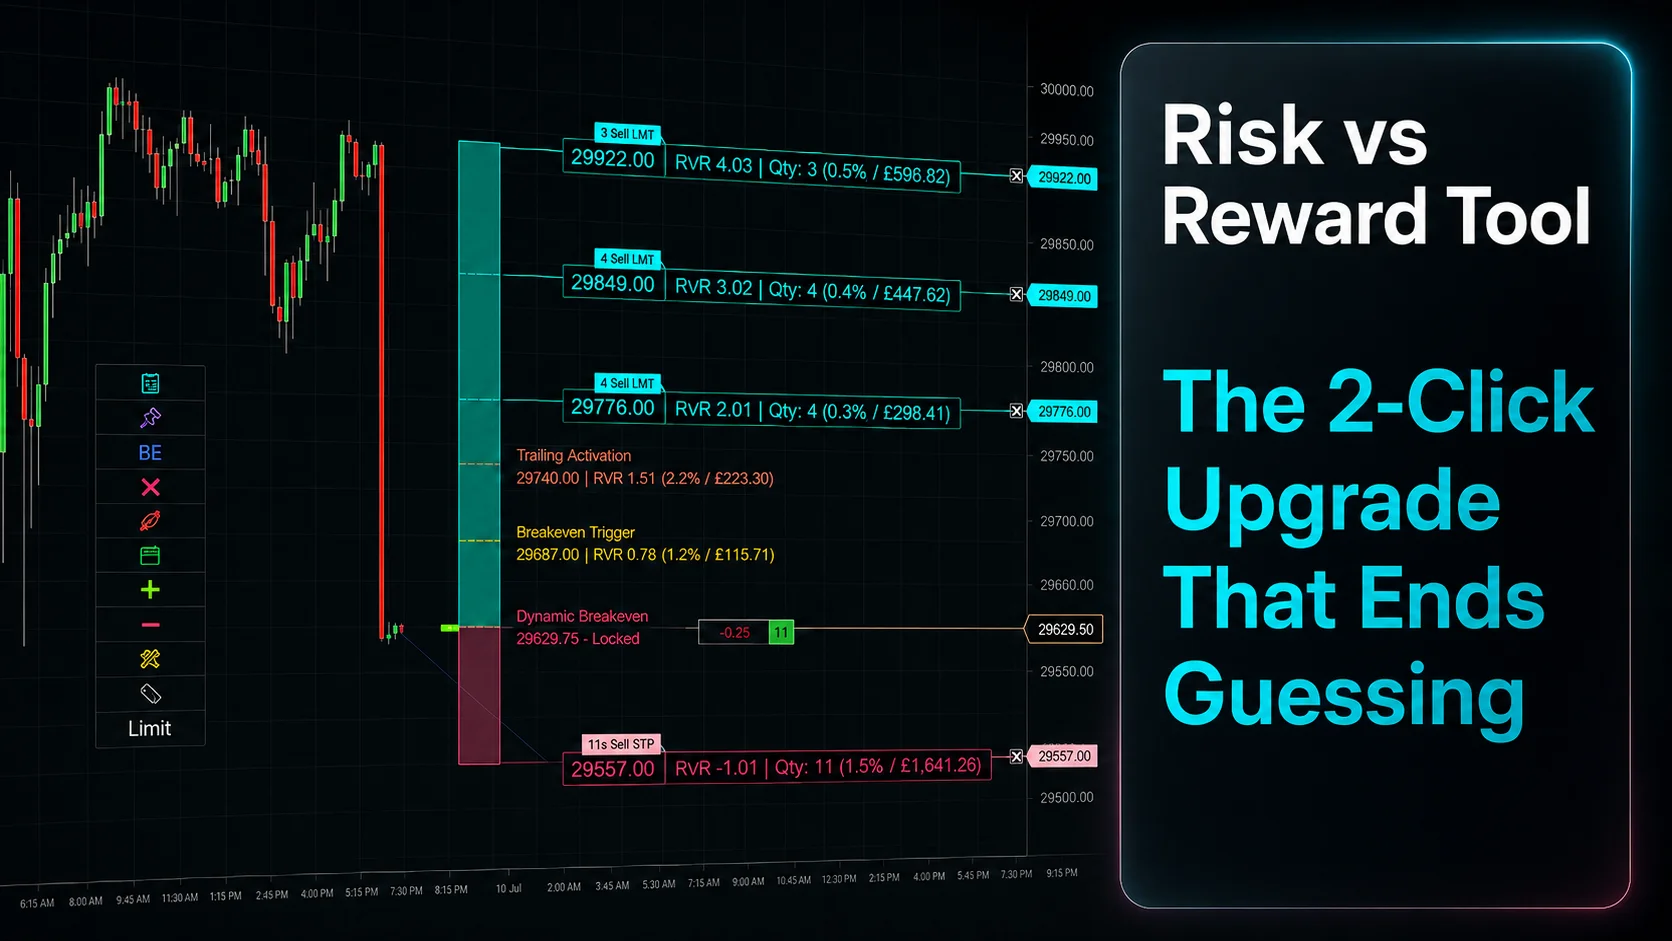
Risk vs Reward Tool: The 2-Click Upgrade That Ends Guessing
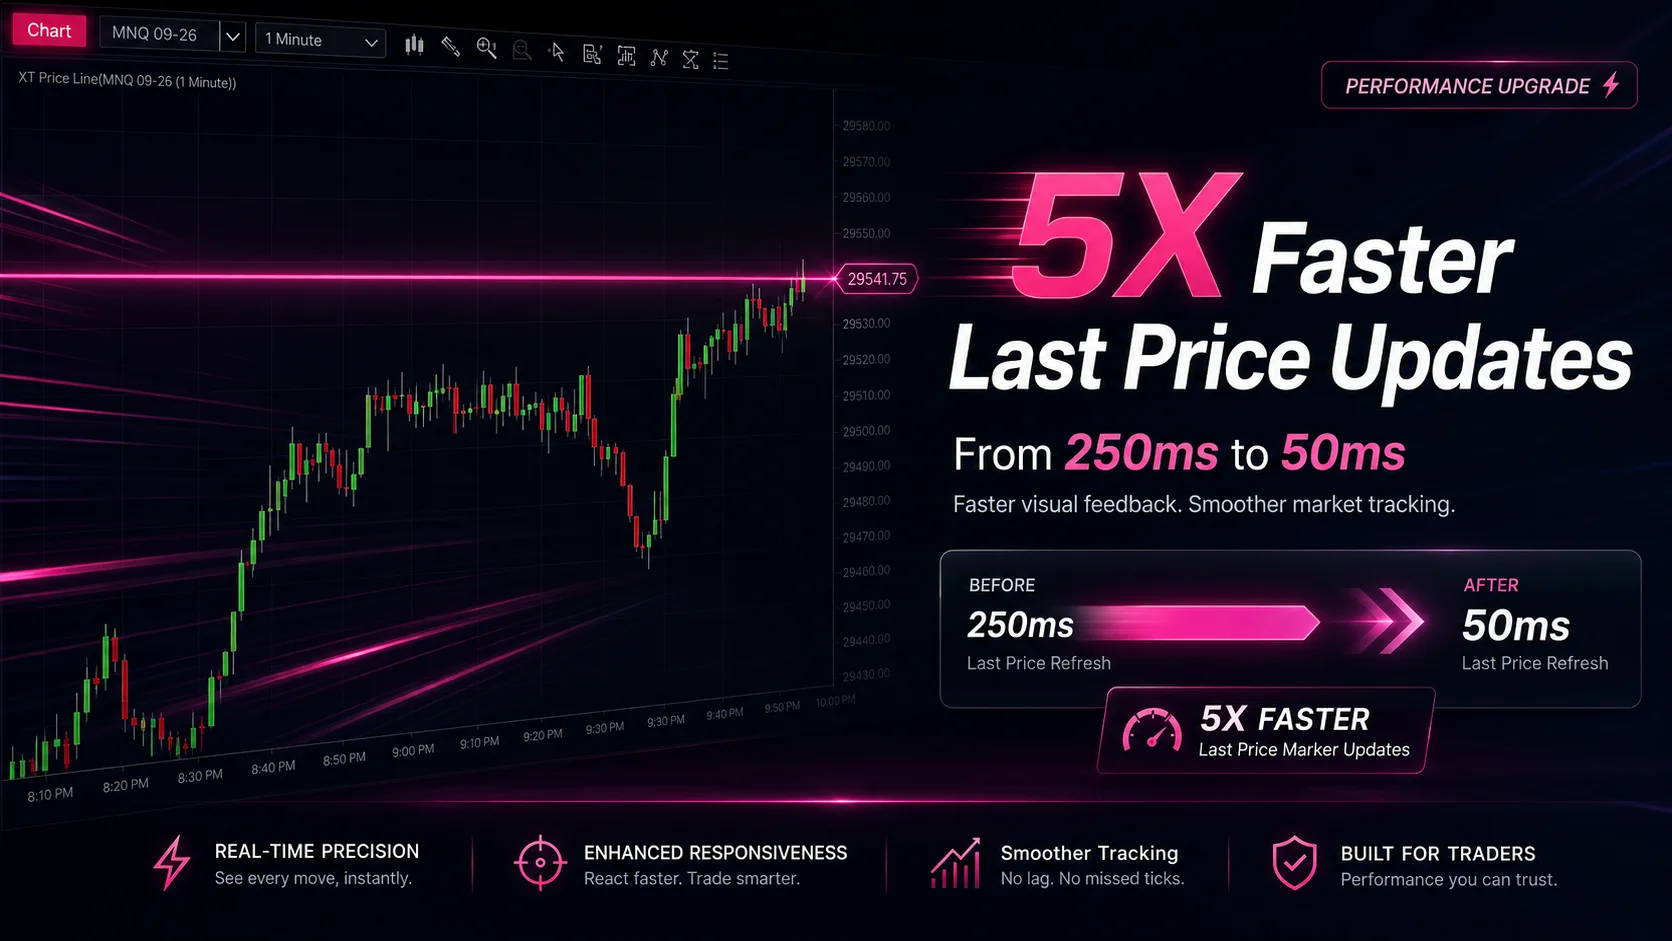
NinjaTrader Faster Last Price Updates on Charts Explained
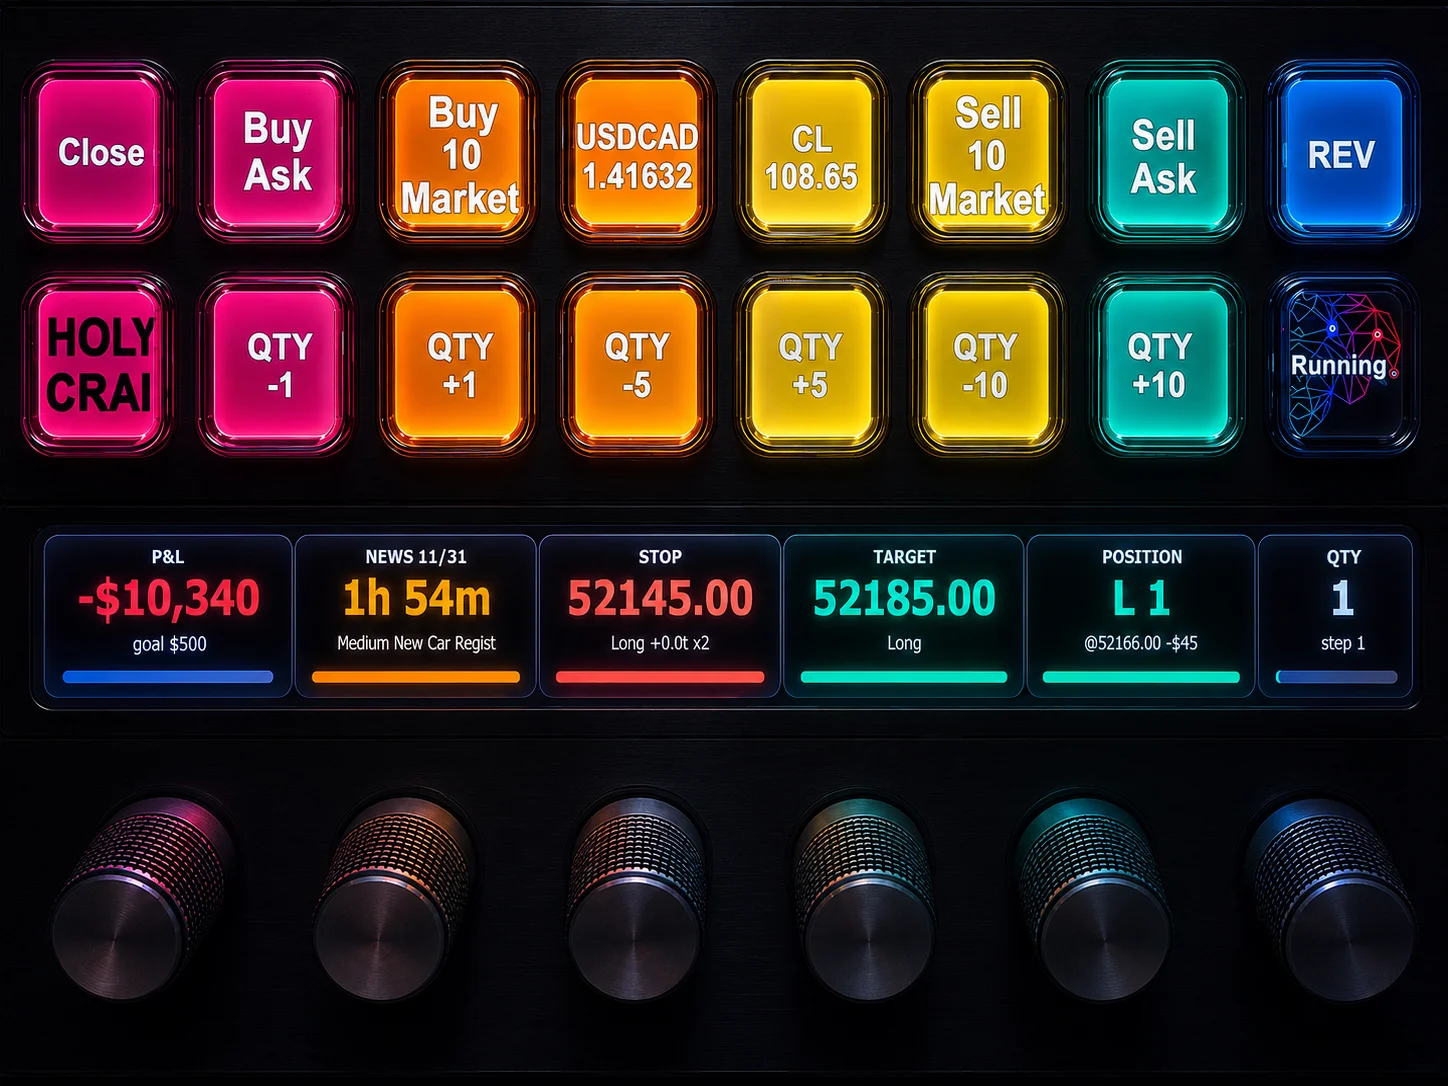
NinjaTrader 8 Hotkeys: Best Shortcuts for Faster Trading