XABCD TRADING
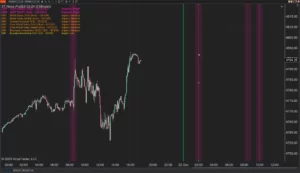
Tick Chart vs Time Chart
Subscribe
to get alerts to our next blog post!
When to Use Tick Charts vs Time Charts?
Knowing when to use a tick chart vs. time chart depends on your trading style, goals, and the specific market conditions you are facing. Here's a guide (with a conversion table to help you decide when each chart type is more suitable:
When To Use Tick Charts?
- High Volatility and Short-Term Trading: Tick charts are beneficial for short-term traders who aim to capture rapid price movements. In highly volatile markets, tick charts can provide a more detailed view of price action, helping traders make quicker decisions.
- Volume Fluctuations: If you're trading instruments with varying volumes or thin liquidity, tick charts can be more useful. Time charts may not accurately represent the market activity during low-volume periods, but tick charts still capture every trade, regardless of the time interval.
- Trading Specific Price Levels: Tick charts are excellent for identifying support and resistance levels and tracking how prices behave around these levels in real-time. This is crucial for traders who rely on precise price levels for their entries and exits.
- Scalping Strategies: Scalpers, who aim to make small profits from numerous quick trades, often prefer tick charts due to their ability to offer a granular view of price movements.
When To Use Time Charts?
- Stable and Longer-Term Analysis: For longer-term investors or swing traders, time charts are more appropriate. They provide a smoother and more consistent representation of price movements over fixed time intervals, making it easier to identify trends and patterns over extended periods.
- Standardized Analysis: Time charts offer standardized views of the market, making it easier to compare price actions across different assets and timeframes. This consistency is valuable for traders who follow multiple instruments simultaneously.
- Reducing Market Noise: In less volatile markets, time charts can help filter out market noise and provide a clearer perspective on long-term trends and price movements.
- Setting Clear Time-Based Strategies: Traders who have specific trading plans based on time intervals, such as daily, weekly, or monthly strategies, find time charts more suitable for their long-term planning.
So, here's the deal: tick charts are the way to go when you need pinpoint accuracy and real-time analysis, especially during crazy volatile or low-liquidity times. On the flip side, time charts are perfect for the long game, cutting out all that market noise and sticking to a steady time-based plan.
When it comes down to it, the choice between tick and time charts is all about what you prefer, how much risk you can handle, and the kind of market conditions you're dealing with. Just dive in, try 'em both out, and see which one vibes best with your trading style and goals. People who use our XABCD Pattern Software have been both traders using tick or time charts. Many even use both since they each have their own purpose.
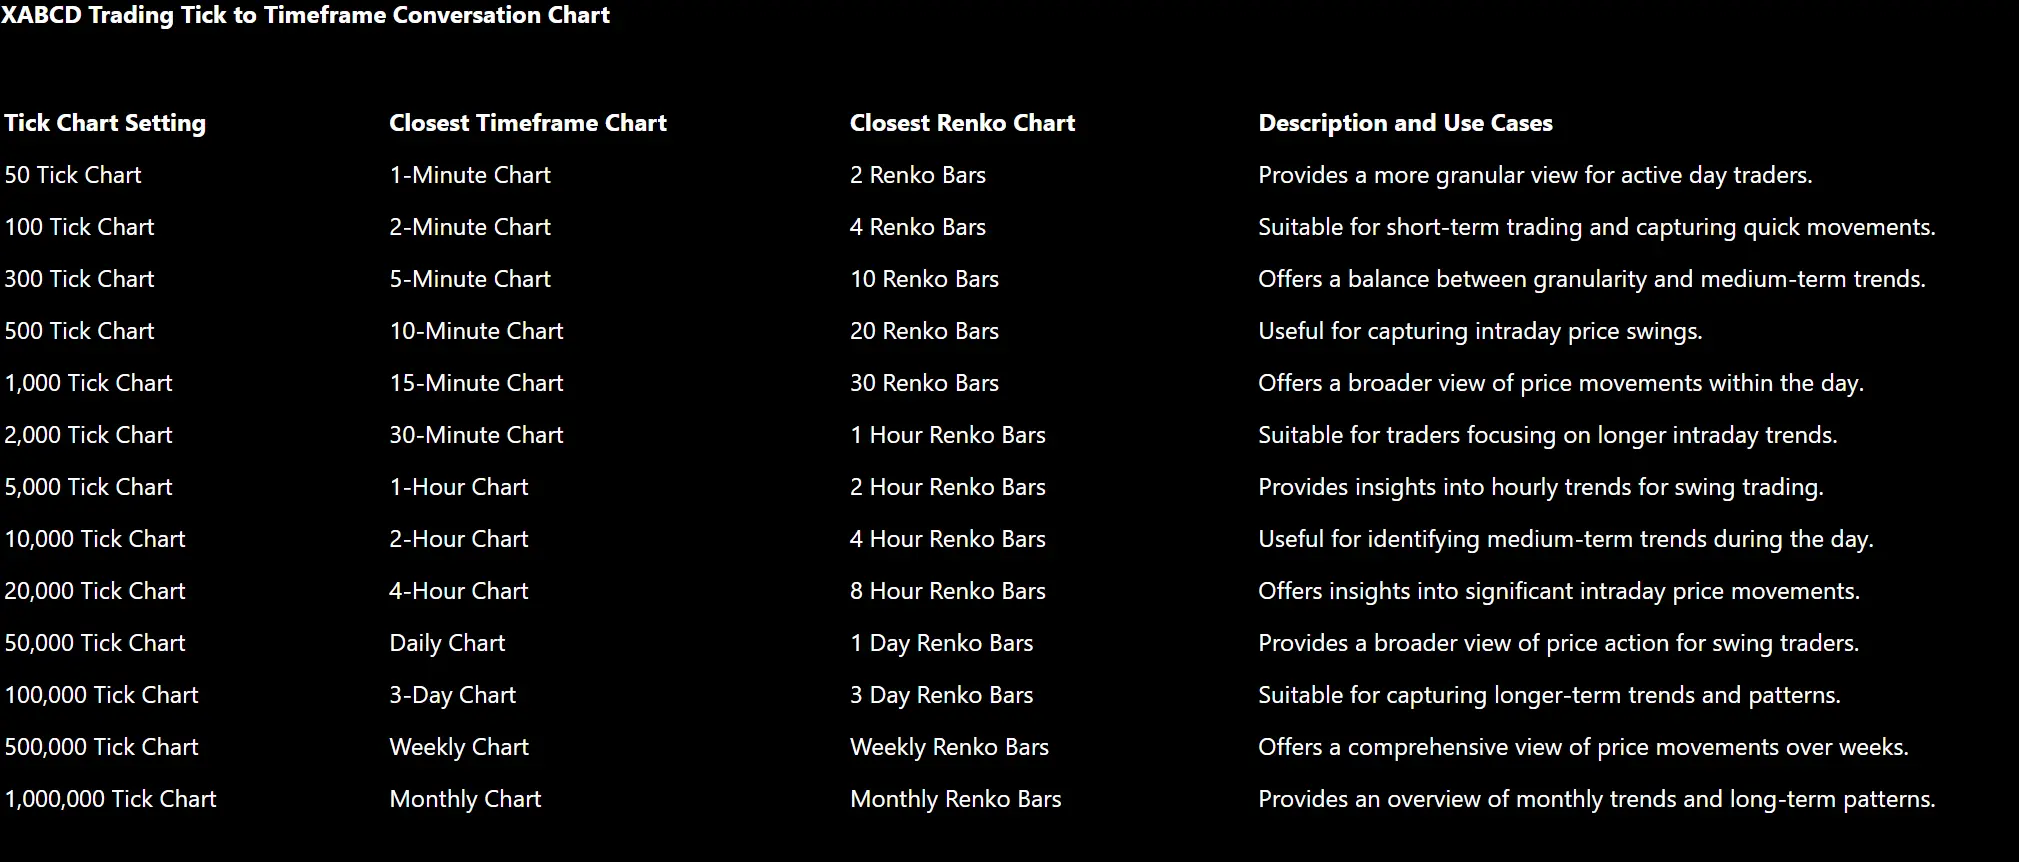
A Conversion Table Between Tick, Time and Renko
What is a 2000 tick chart in minutes? Does a 100T equal a minute chart? We've included a table below that shows a comparison between Tick, Time and Renko charting styles. We've also included a description with use cases on when you would look at each one.
| Tick Chart | Time Chart (Approx.) | Renko Chart (Approx. Brick Size) | Use Case |
|---|---|---|---|
| 50 | 1-minute | 2 | Scalping, quick decision-making |
| 100 | 2-minute | 4 | Intraday trading, fast-paced markets |
| 300 | 5-minute | 10 | Short-term analysis, rapid price moves |
| 500 | 8-minute (estimation) | 20 | Short-term analysis, intraday trading |
| 1,000 | 10-minute | 30 | Trend identification |
| 2,000 | 15-minute | 50 | Swing trading, filtering out noise |
| 5,000 | 30-minute | 70 | Medium-term analysis |
| 10,000 | 1-hour | 100 | Longer-term trends, intraday analysis |
| 20,000 | 2-hour | 175 | Position trading, macro analysis |
| 50,000 | 5-hour | 300 | Long-term trend identification |
| 100,000 | 10-hour | 500 | Identifying major market cycles |
| 300,000 | 1-day | 1,500 | Long-term trend identification |
| 500,000 | 2-day (estimation) | 2,500 | Long-term trend identification |
| 1,000,000 | 3-4 days (estimation) | 5,000 | Intraday and Long-term analysis |
Printable Table
What Chart Style Used for Pattern Trading? Tick or Time Based?
Alright, when you're into pattern trading, the chart style you use totally depends on your trading strategy, how long you plan to hold your trades, and the specific patterns you're all about. Tick charts and time-based charts each have their perks and can totally work for pattern trading, but at the end of the day, it's all about what you vibe with and the kind of patterns you're hunting for. So, just go with what feels right for you and the patterns you wanna nail down.
Reasons for Tick Charts
- Precision and Real-Time Analysis: Tick charts can provide a more granular view of price movements, which is beneficial for traders who rely on precise entry and exit points when trading patterns.
- Volatility and Short-Term Trading: If you're focusing on short-term patterns that unfold rapidly in highly volatile markets, tick charts might be more suitable as they capture every trade, regardless of time intervals.
- Tick Size Considerations: For some patterns, the tick size (minimum price movement) of the asset can be crucial. Tick charts, which are based on trade activity, can better reflect these tick size variations.
Reasons for Time Charts
- Trend Identification: Time-based charts, such as daily or weekly charts, are excellent for identifying long-term patterns and trends. They provide a smoother view of price movements, making it easier to spot patterns that develop over extended periods.
- Reducing Noise: Time charts can help filter out market noise, allowing you to focus on the underlying patterns and trends without being distracted by short-term fluctuations.
- Consistency in Analysis: Time-based charts offer standardized views of the market, making it easier to compare patterns across different assets and timeframes.
Are Tick Charts Better Than Time Charts?
Lots of traders rock at pattern trading by mixing it up with both tick charts and time-based charts. They bust out the tick charts when they need those super-precise entries and exits during those crazy active trading moments or when prices are moving like lightning. Then, they switch gears and dive into time-based charts to scope out the bigger trends and confirm those patterns like a boss. It's all about finding that killer combo that works best for you and your trading game.
In conclusion, there is no one-size-fits-all answer to which chart style is best for pattern trading. It's essential to understand the characteristics of each chart type and how they align with your trading strategy and goals. Experiment with both tick charts and time-based charts to see which one works best for your pattern trading approach.
Which Future Platforms Offer Tick Charts?
List of Platforms and If They Support Tick Charts
Here's the lowdown on different futures trading platforms and whether they're down with tick charts. So, let's have some fun checking out which platforms got our back with native tick chart support, and which ones might need some extra love in the form of custom settings or third-party help.
| Platform | Tick Charts Availability |
|---|---|
| NinjaTrader | Yes |
| TradeStation | Yes |
| Sierra Chart | Yes |
| eSignal | Yes |
| MultiCharts | Yes |
| CQG | Yes |
| Thinkorswim | No |
| MetaTrader 5 | No |
| Interactive Brokers (IBKR) | No |
| TradingView | No |
Which NinjaTrader Data Feed Supports Tick Charts
All of them do, except for: Thinkorswim, Interactive Brokers, Forex.com. Whether or not it's a big deal to use tick chart vs time chart in your trading platform will be independent but I imagine most people would want to see it there as an option. Tick charts offer a different perspective on market activity compared to time-based charts but only in super high volume times, as they focus on the number of trades executed rather than fixed time intervals.
New NinjaTrader Articles Delivered First

Easy Order Tool
The Strategy

Scanning & Alerting

NinjaTrader Release
XABCD News (Free Version)
XABCD News (Community Edition) is the best free Indicator for NinjaTrader 8. Don't let news sneak up on you again. Puts economic news events on your charts so you can stay informed and move around positions/stops before the news is released. Works in any market.
XABCD Priceline (Free)
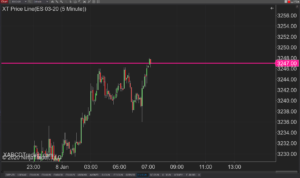
XABCD Price Line tool for NinjaTrader 8 will draw a line at current price and move every time the market changes price. This is useful because it will allow you to easily identify where price is at all times and the exact quoted price.
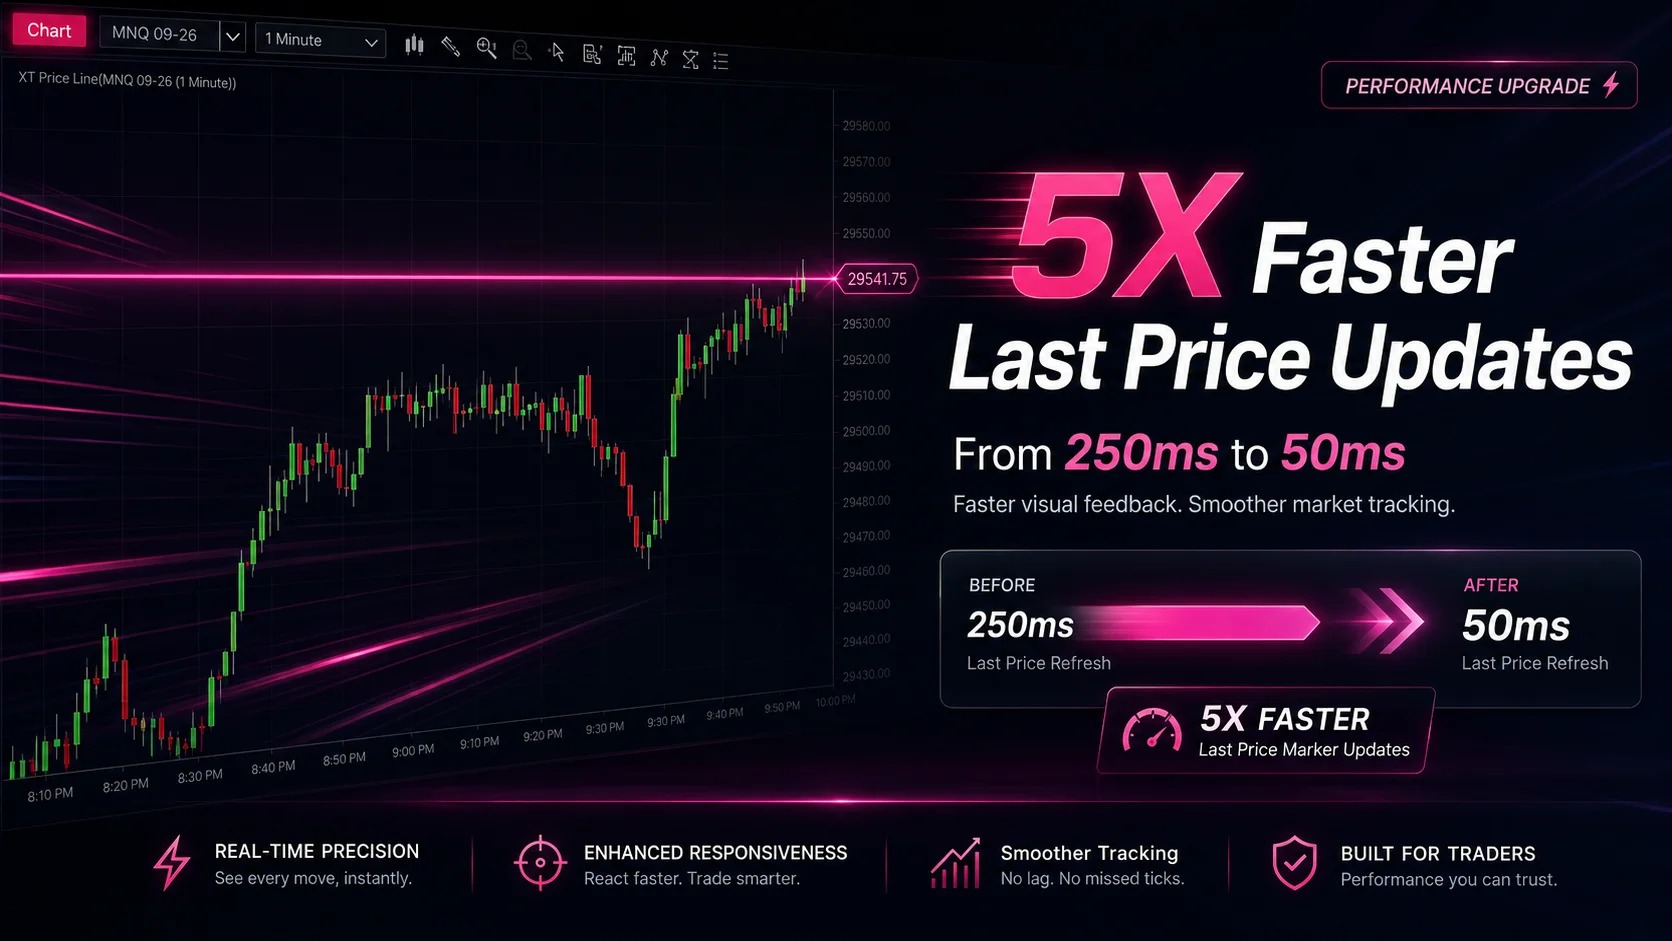
NinjaTrader Faster Last Price Updates on Charts Explained
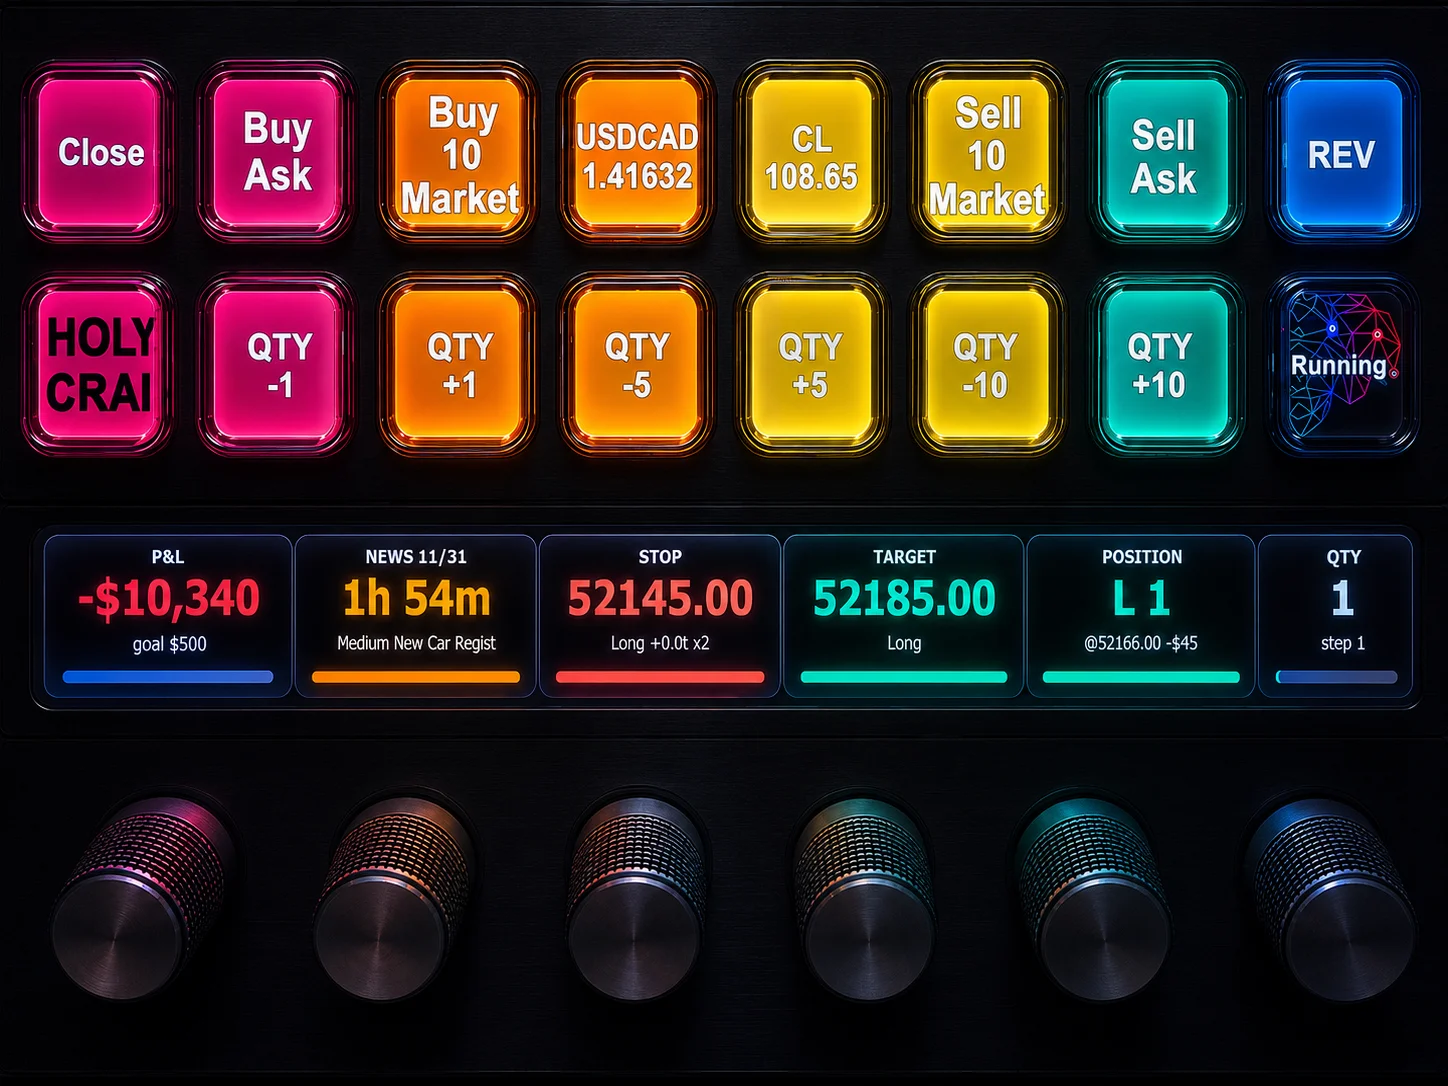
NinjaTrader 8 Hotkeys: Best Shortcuts for Faster Trading
NinjaTrader Position Sizing Tool: 64 Features Stock NT8 Does Not Include
NinjaTrader – Adding to Position: A Field Guide for Active Traders
NinjaTrader Prop: The Ultimate Guide to Prop Firm Trading
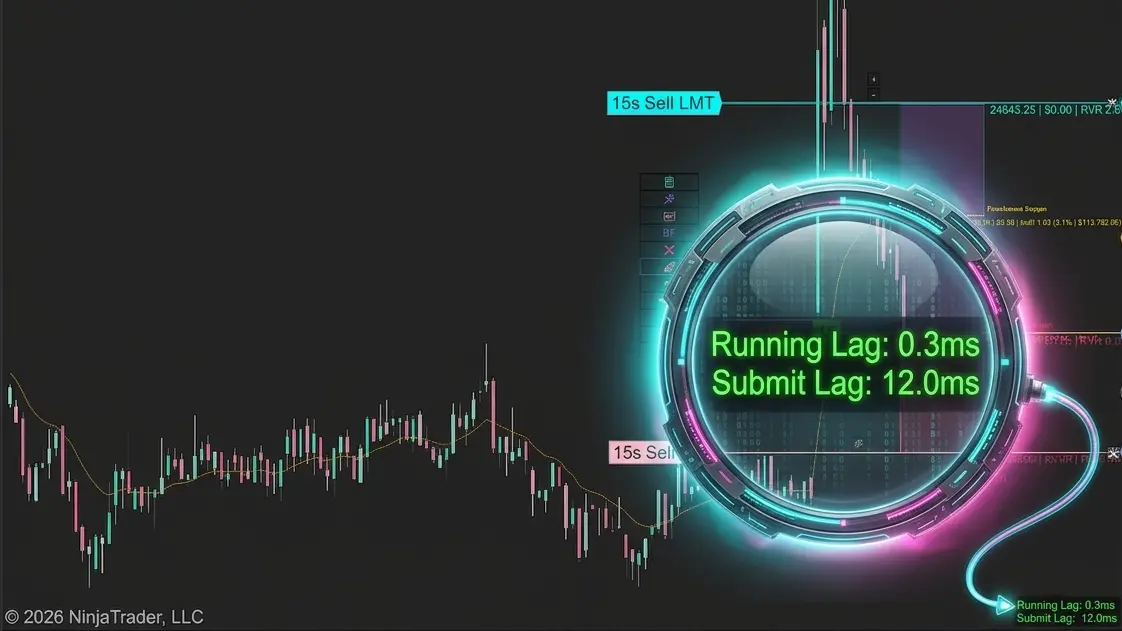
Does the XABCD Position Tool Lag?
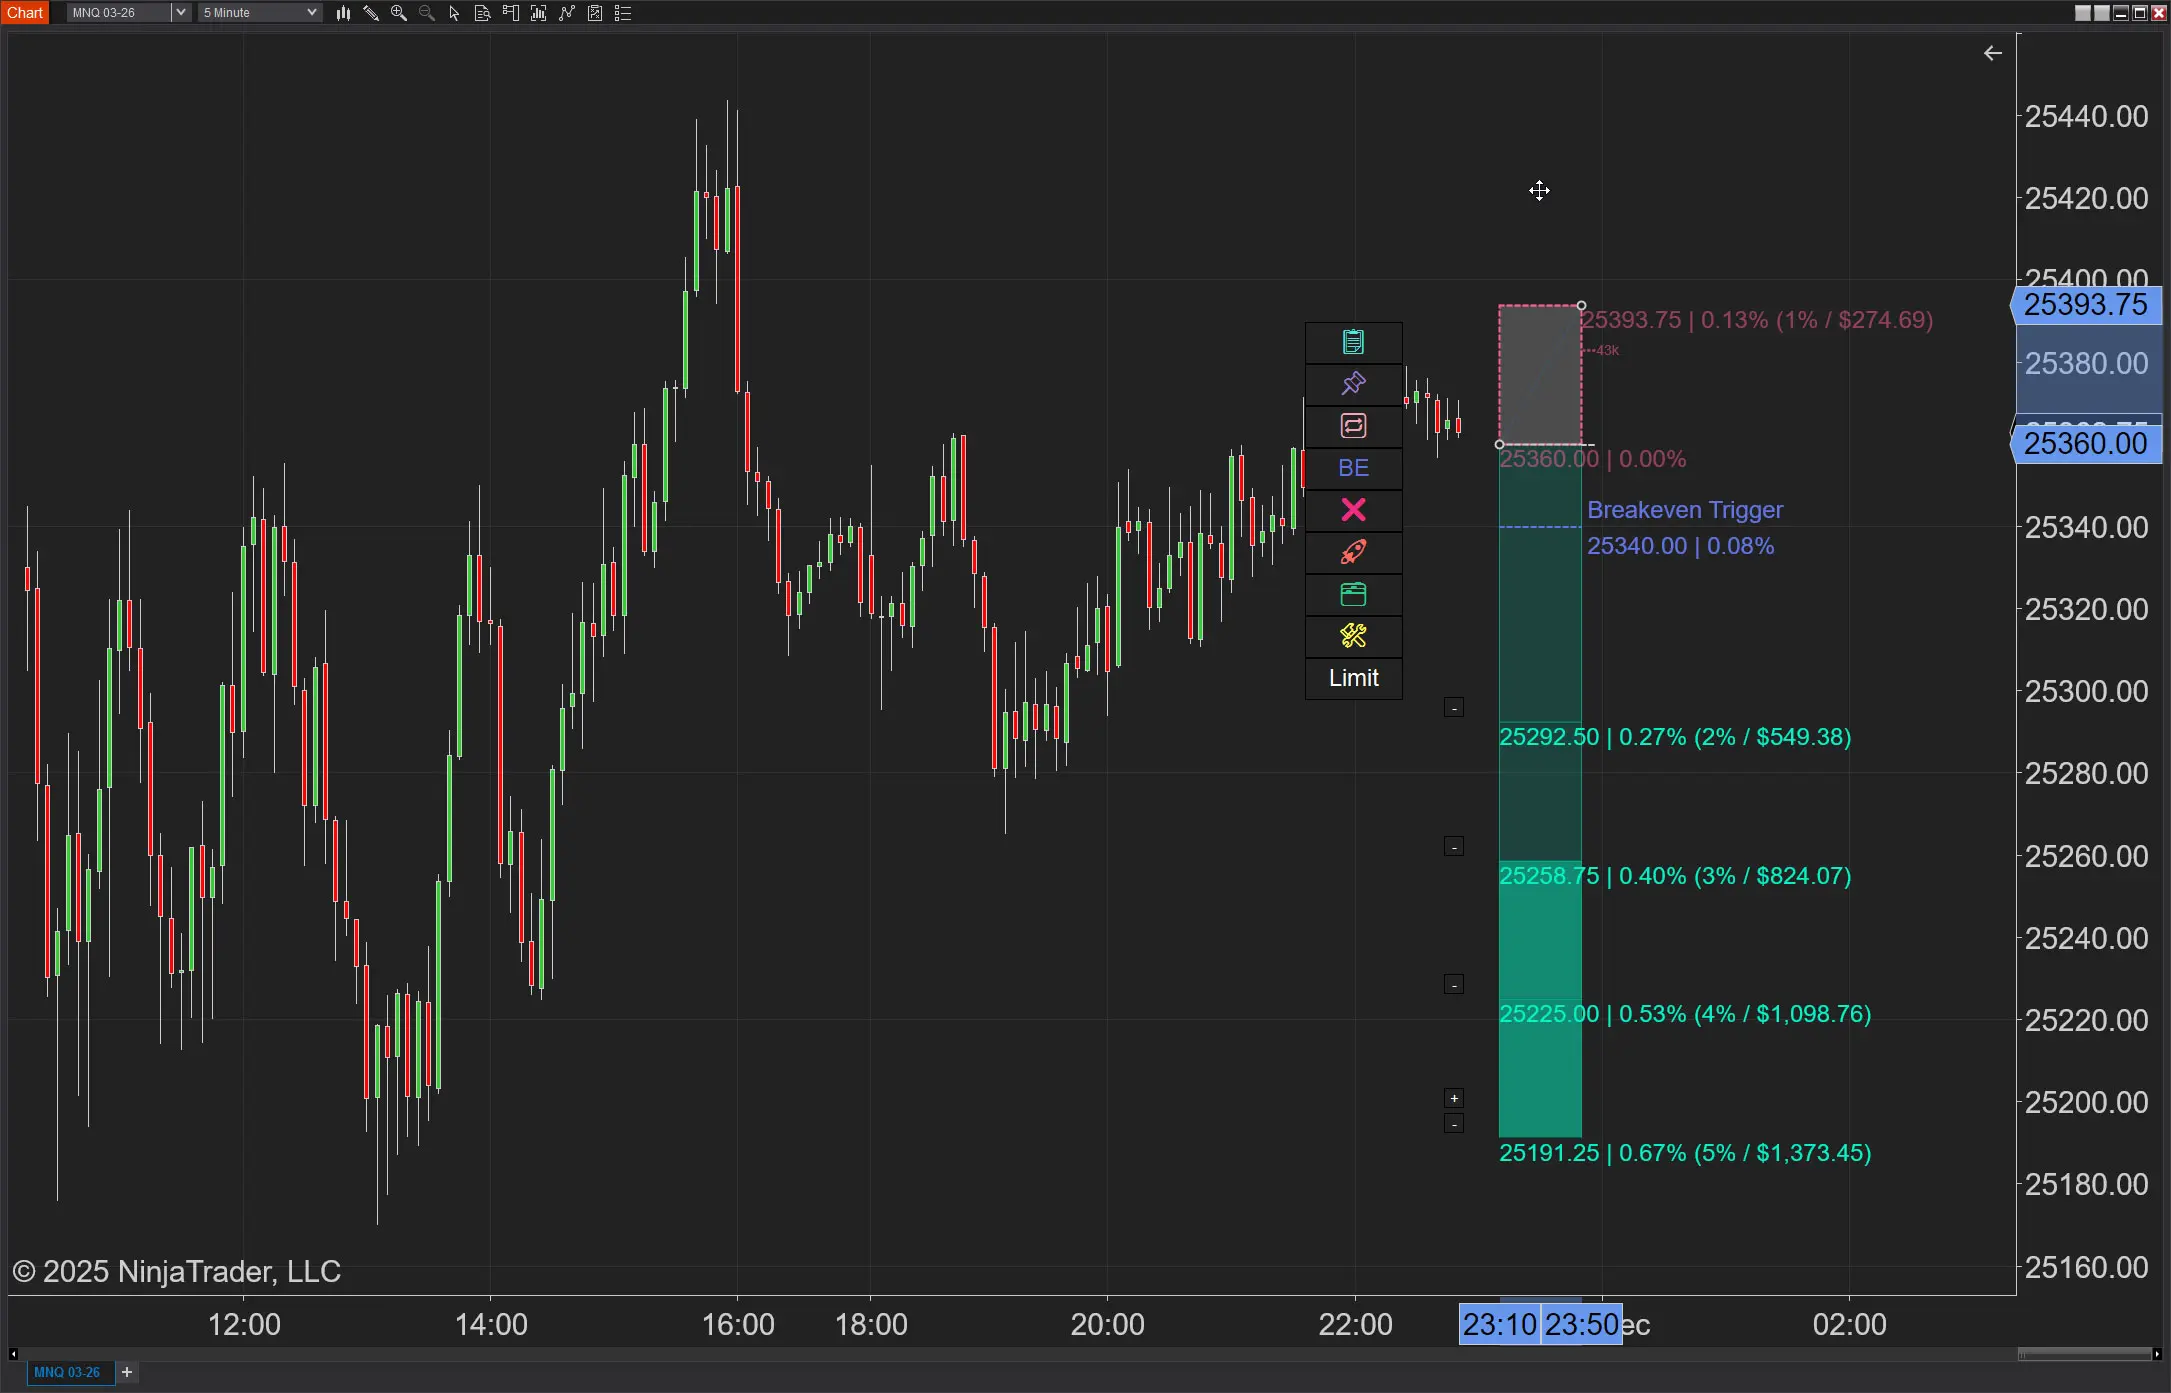
NinjaTrader Position Sizing: What the XABCD Position Tool Can Do That ATM’s Can’t
NinjaTrader Risk Management That Actually Moves the Needle
NinjaTrader 8.1.6 — The “No Fluff” Tour (Speed, Clarity, Fewer Clicks)