XABCD TRADING

Are XABCD Patterns Hard? The Real Truth
Subscribe
to get alerts to our next blog post!
The Real Truth - Are XABCD Patterns Hard To Trade?
When a trader first discovers XABCD Patterns, they can look confusing.
There are multiple points on the chart. There are measured price swings. There are Fibonacci ratios involved. At first glance, it can feel like something only advanced traders would understand.
But the truth is much simpler.
XABCD Patterns are not as hard as they look. In fact, once you understand what the pattern is trying to show you, they can become one of the most useful chart patterns for beginners because they provide structure, visual clarity, and a complete trade idea in one place.
The real challenge is not the pattern itself.
The challenge is trying to manually find, draw, measure, and manage the pattern without the right tools.
That is where our pattern software changes everything.
Why XABCD Patterns Look Complicated at First
The reason many traders feel overwhelmed by XABCD Patterns is because they are often taught in a very technical way.
You may see traders talking about ratios, extensions, retracements, leg measurements, completion zones, and multiple price levels. For a beginner, that can make the entire concept feel intimidating.
But at its core, these patterns are a simple structured way of reading price movement.
It helps answer important trading questions like:
- Where could price react?
- Where might a trade setup form?
- Where could the stop go?
- Where could targets be placed?
- How much time does the setup have?
- When may the opportunity no longer be valid?
That is why an XABCD Pattern can be viewed as more than just a chart shape. It is a complete trading framework.
XABCD Patterns and Fibonacci Trading Strategy
XABCD Patterns are closely connected to a fibonacci trading strategy because they use measured price relationships to help identify important areas on the chart.
Many traders use Fibonacci levels to estimate where price may pull back, extend, or complete a move. XABCD Patterns take that idea and organize it into a repeatable structure.
Instead of randomly placing Fibonacci tools on a chart and guessing what matters, an these chart patterns gives you a more complete roadmap.
The pattern connects the major turning points of price movement, usually labeled X, A, B, C, and D. Each point helps define the structure of the setup.
The benefit is that you are not just looking at one isolated Fibonacci level. You are looking at a complete price structure that combines multiple measurements into one trade idea.
That is what makes an xabcd pattern trading strategy so useful. It gives traders a way to approach the market with more consistency instead of guessing from one candle to the next.
XABCD Pattern Indicator Suite
Our XABCD Pattern Indicator Suite was designed to make this process easier.
Instead of manually searching your charts, measuring every swing, and drawing each pattern by hand, the indicator does the heavy lifting for you.
The patterns appear directly on your chart, allowing you to focus on reading the opportunity instead of spending all your time trying to find it.
This is a major advantage for newer traders.
Years ago, traders had to manually draw patterns, measure ratios, calculate levels, and decide whether the pattern was valid. That required a lot of experience and a lot of patience.
Today, modern tools can automatically detect and map these patterns for you.
That means you can spend more time asking the important questions:
- Is this setup clean?
- Does the entry area make sense?
- Where is my stop?
- Where are my targets?
- How much risk am I taking?
- Is the trade still valid?
Easy Strategies for Every Trader
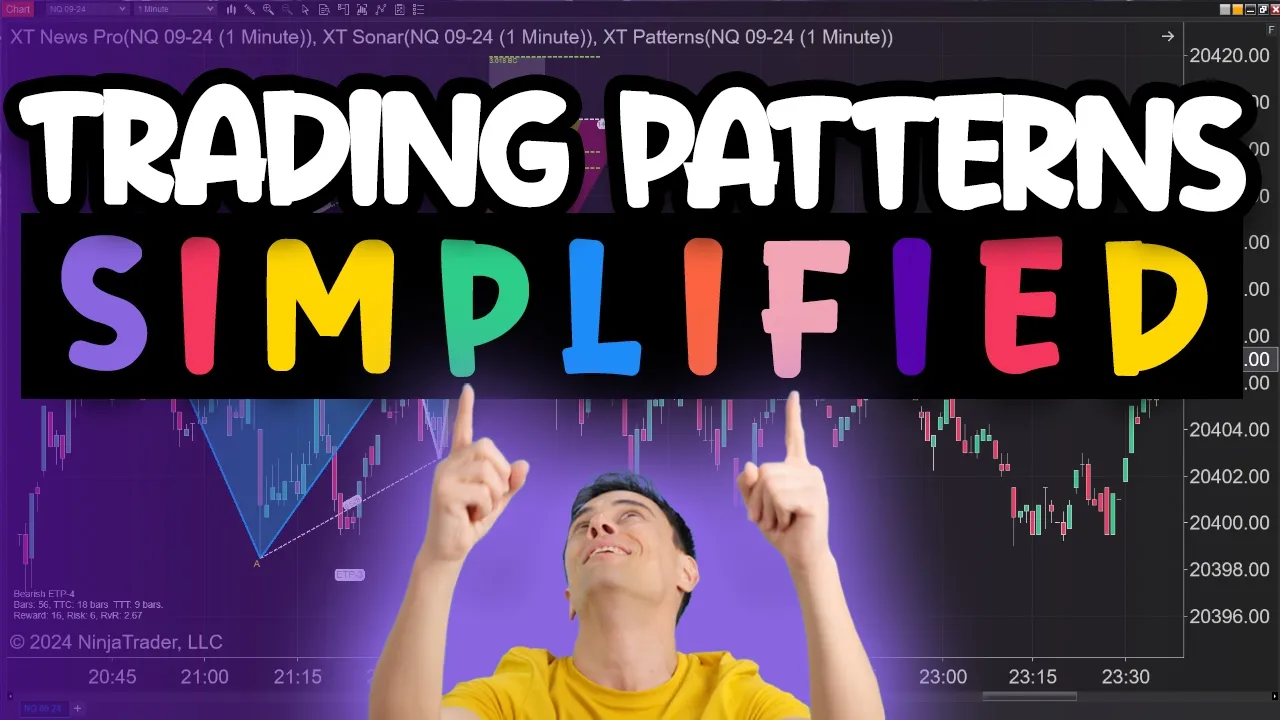
If you watched the video, you can visually see how much information XABCD Patterns provide.
With one completed pattern, you can clearly identify your entry area, stop area, and potential price targets. That gives you a structured way to approach the trade before you ever click buy or sell.
This is one of the biggest reasons traders are attracted to our patterns.
They are not just random shapes on a chart. They are decision-making tools.
A well-formed pattern can help you understand where price may react, where your trade idea becomes invalid, and where you may want to take profit.
That is incredibly valuable because many traders struggle with the same basic questions:
- Where do I get in?
- Where do I get out?
- Where do I place my stop?
- How do I know if the setup is still valid?
XABCD Patterns help bring those answers together.
Why XABCD Patterns Are Great Chart Patterns for Beginners
Many beginners are taught to trade basic chart patterns, but they are often left guessing where the actual trade plan is.
They may recognize a shape on the chart, but then they still have to figure out the entry, stop, target, and risk.
That is where these patterns can be different.
For traders looking for chart patterns for beginners, patterns offer a more complete structure because the pattern itself can help define the trade plan.
Instead of only saying, “This looks interesting,” the pattern can help show:
- The potential entry area
- The risk area
- The target zones
- The timing window
- The overall structure of the setup
This makes the trading process easier to understand.
You are no longer just reacting to price. You are following a structured setup.
Conclusion: XABCD Patterns Are Easier Than You Think
So, are XABCD Patterns hard to trade?
Not anymore.
They may look complicated at first, especially because they involve Fibonacci measurements and structured price movement. But with the right tools, they become much easier to understand and apply.
For traders looking for chart patterns for beginners, these patterns can be an excellent place to start because they provide a complete visual framework for entries, stops, targets, and timing.
For traders looking for a more advanced fibonacci trading strategy, XABCD Patterns offer a structured way to use measured price movement instead of relying on random levels.
And for traders who want a practical trading strategy, the XABCD Pattern Indicator Suite can help simplify the entire process by automatically finding, drawing, and mapping patterns directly on your chart.
The patterns are not the hard part.
The hard part is trying to do everything manually.
With modern tools, XABCD Patterns are easier to find, easier to understand, and easier to trade with confidence.
What are XABCD patterns in trading?
XABCD patterns are five-point chart patterns used in technical analysis to help traders identify possible reversal areas using Fibonacci measurements. The structure is built from five key price points: X, A, B, C, and D. Traders use these patterns to spot where price may react, define entries, place stops, and plan price targets with a clear risk-to-reward setup.
How do you identify XABCD patterns on a chart?
To identify XABCD patterns, traders look for five distinct swing points that follow a measured price structure. The pattern usually begins with an initial move from X to A, followed by a retracement from A to B, another price leg from B to C, and a final move from C to D. The D point is important because it marks the area where traders watch for a possible reversal, confirmation signal, or trade setup.
Which XABCD patterns are the most reliable for trading?
The most reliable XABCD patterns are usually the ones that follow clean price structure, align closely with Fibonacci measurements, and appear near meaningful support or resistance areas. Reliability can improve when the pattern is supported by additional confirmation, such as price rejection, momentum divergence, volume changes, or a broader market context that supports the trade idea.
What is the difference between ABCD and XABCD patterns?
The ABCD pattern is a simpler four-point structure that measures a move using points A, B, C, and D. An XABCD pattern adds the X point, which gives traders more context for the full price structure. Because XABCD patterns use five points instead of four, they can provide a more detailed view of the setup, including the reversal area, risk location, and potential price targets.
What is the best indicator or tool to find XABCD patterns automatically?
The best tool for finding XABCD patterns automatically is one that can scan charts in real time, measure Fibonacci relationships, mark valid pattern structures, and provide clear alerts when a setup appears. The XABCD Pattern Suite for NinjaTrader is designed for this purpose, helping traders find XABCD formations faster without manually measuring every swing point. A good pattern tool should also make it easy to see the entry area, stop area, targets, and overall trade structure directly on the chart.
New NinjaTrader Articles Delivered First

Easy Order Tool

The Strategy


Scanning & Alerting

NinjaTrader Release
XABCD News (Free Version)
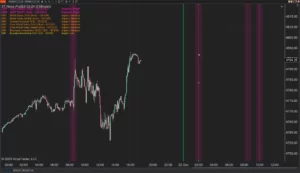
XABCD News (Community Edition) is the best free Indicator for NinjaTrader 8. Don't let news sneak up on you again. Puts economic news events on your charts so you can stay informed and move around positions/stops before the news is released. Works in any market.
XABCD Priceline (Free)
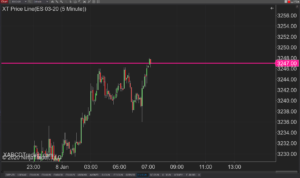
XABCD Price Line tool for NinjaTrader 8 will draw a line at current price and move every time the market changes price. This is useful because it will allow you to easily identify where price is at all times and the exact quoted price.

NinjaTrader Risk Per Trade: Risk $500 on Every Trade
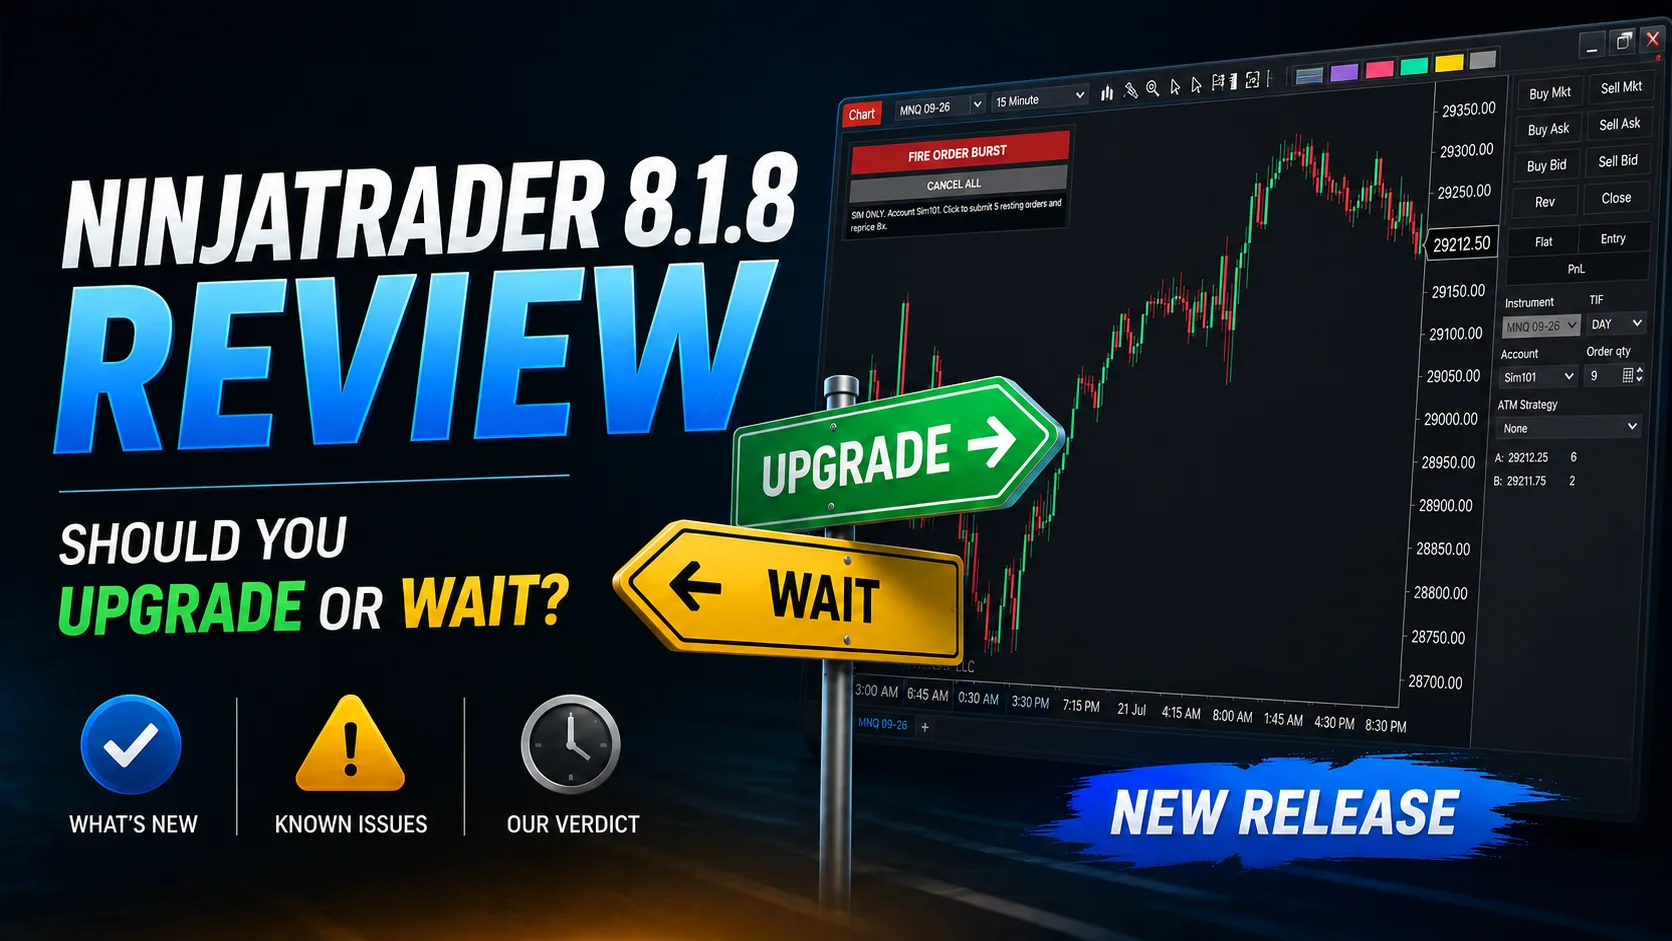
NinjaTrader 8.1.8 Review: Should You Upgrade or Wait?
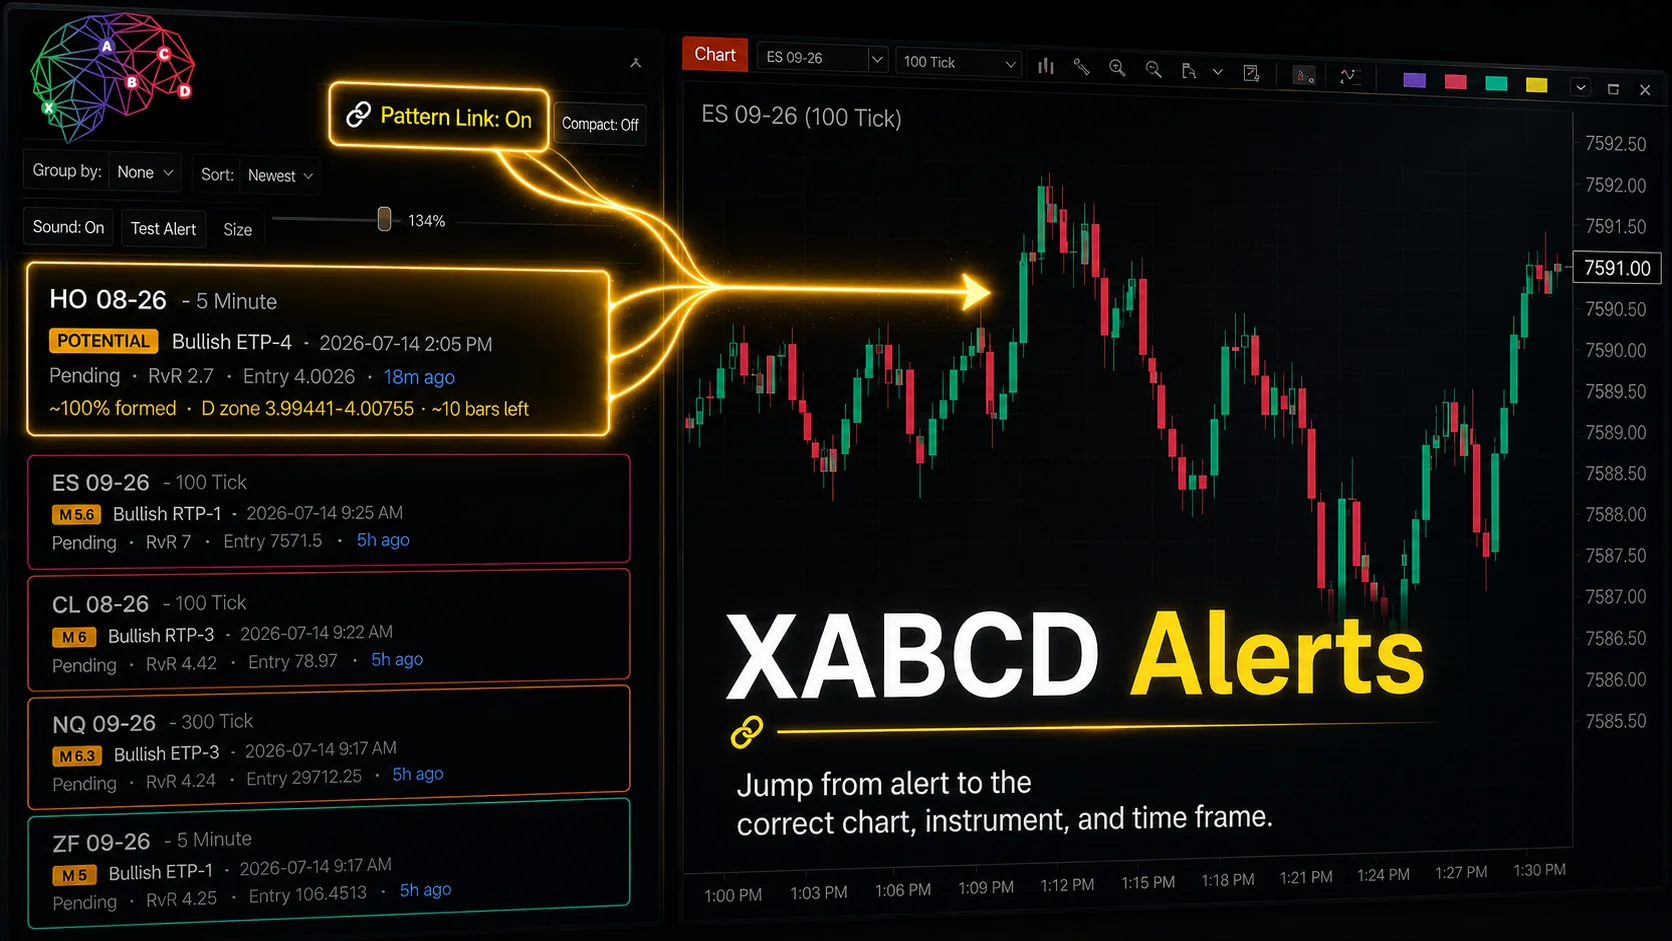
XABCD Pattern Alerts: The Complete Guide for Traders
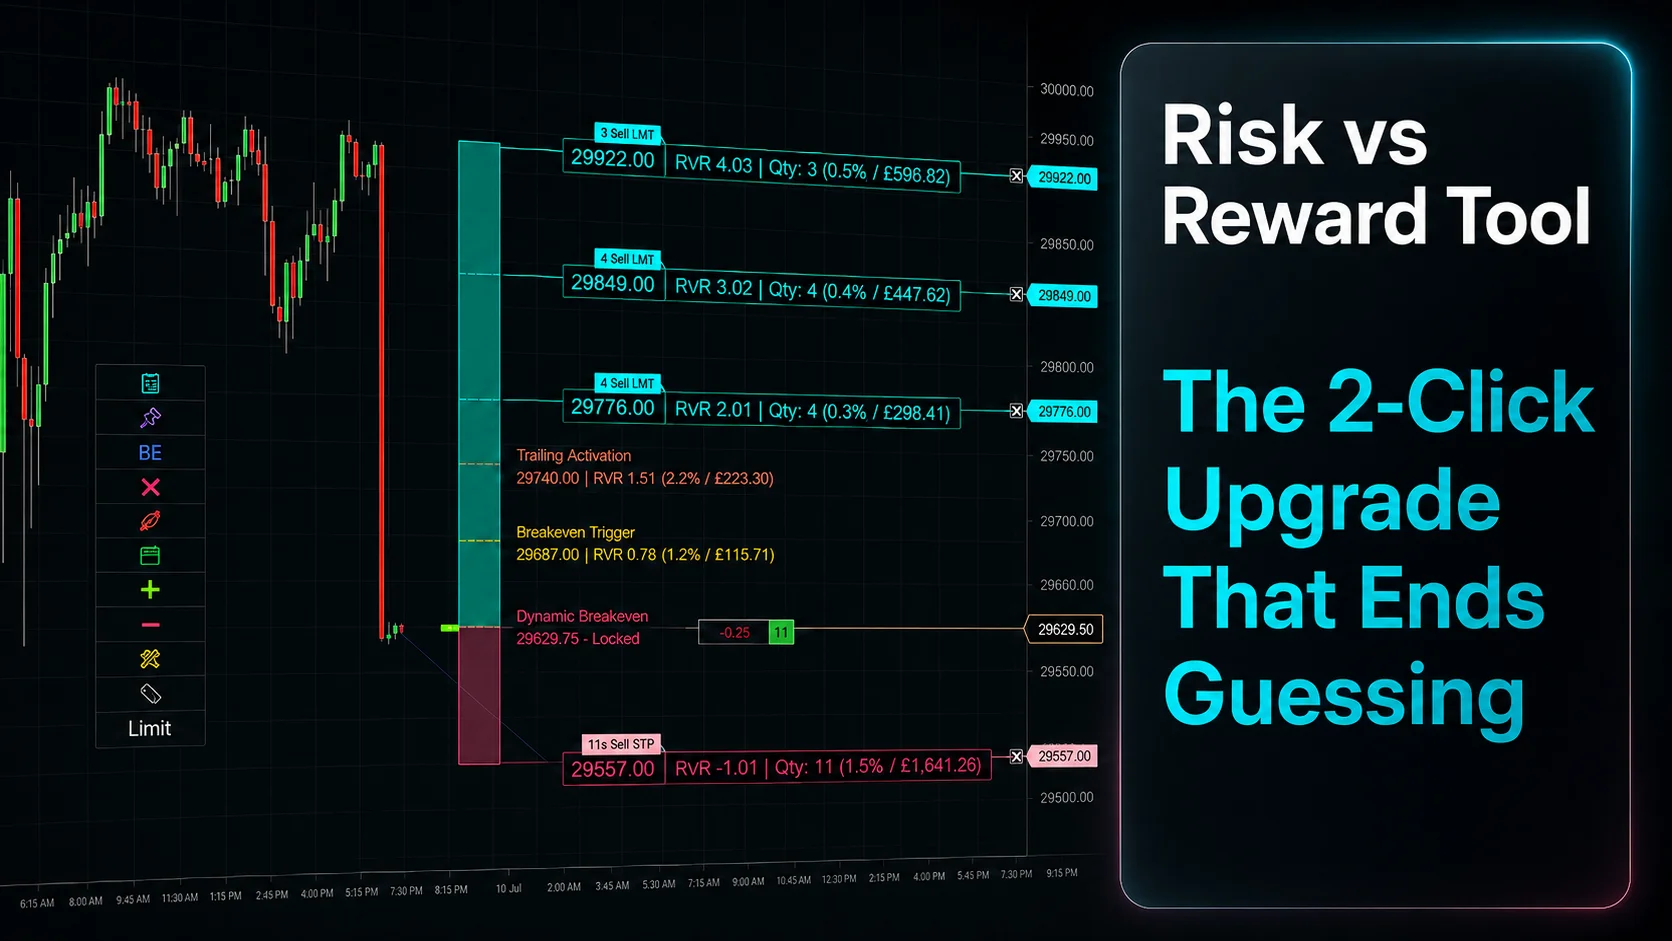
Risk vs Reward Tool: The 2-Click Upgrade That Ends Guessing
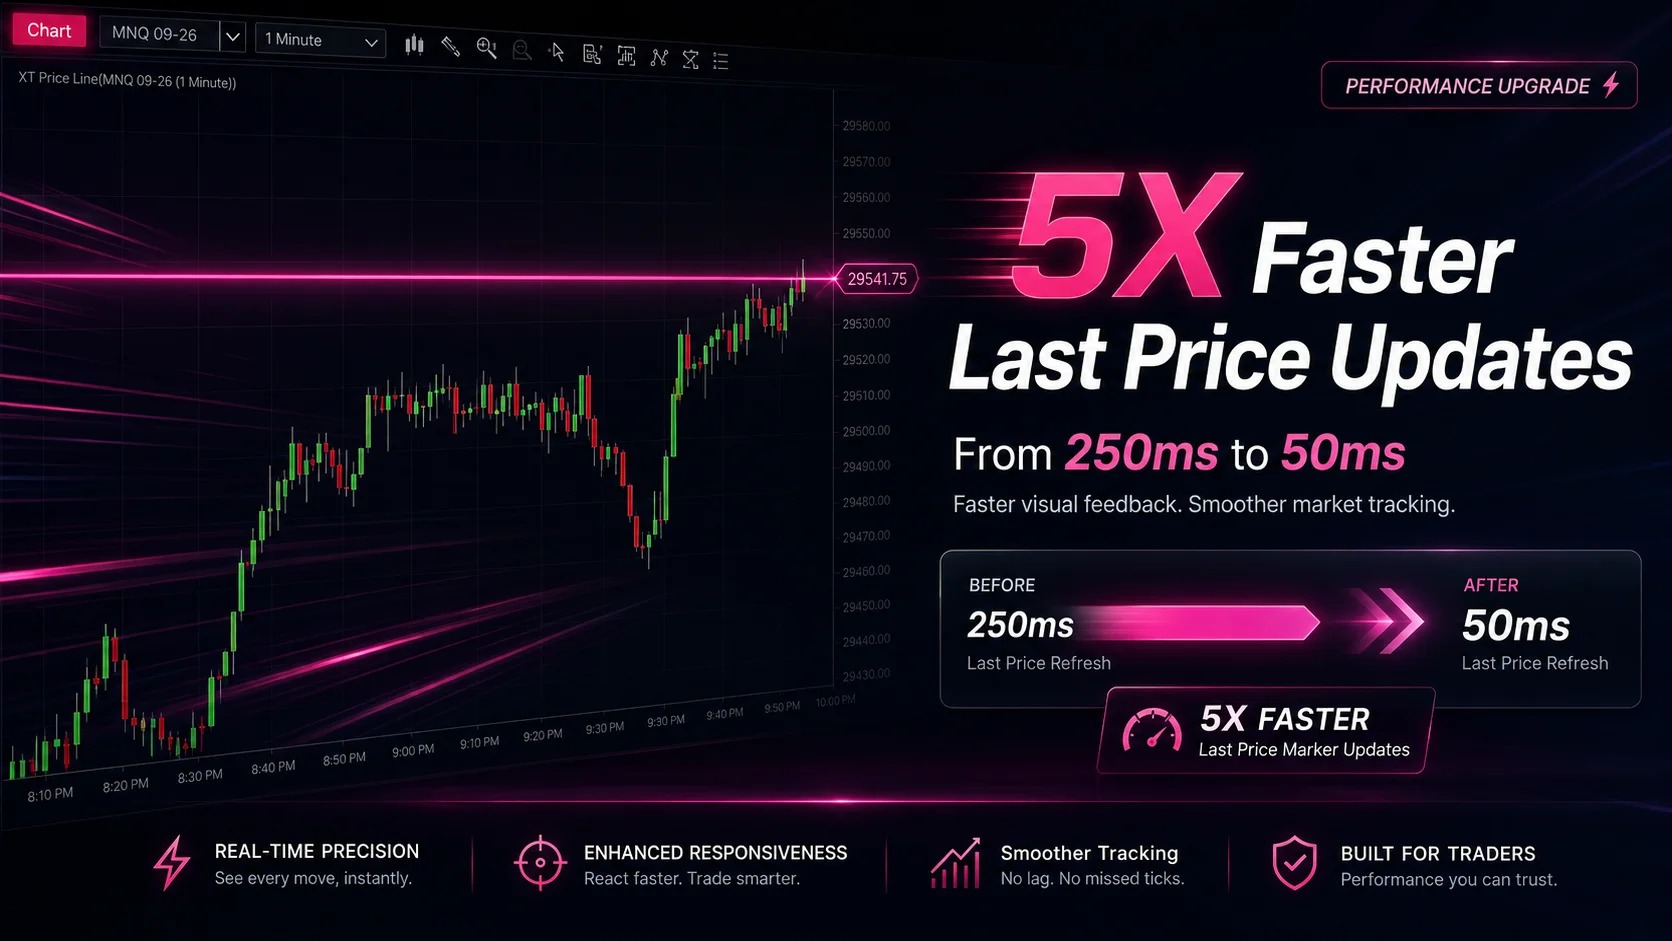
NinjaTrader Faster Last Price Updates on Charts Explained
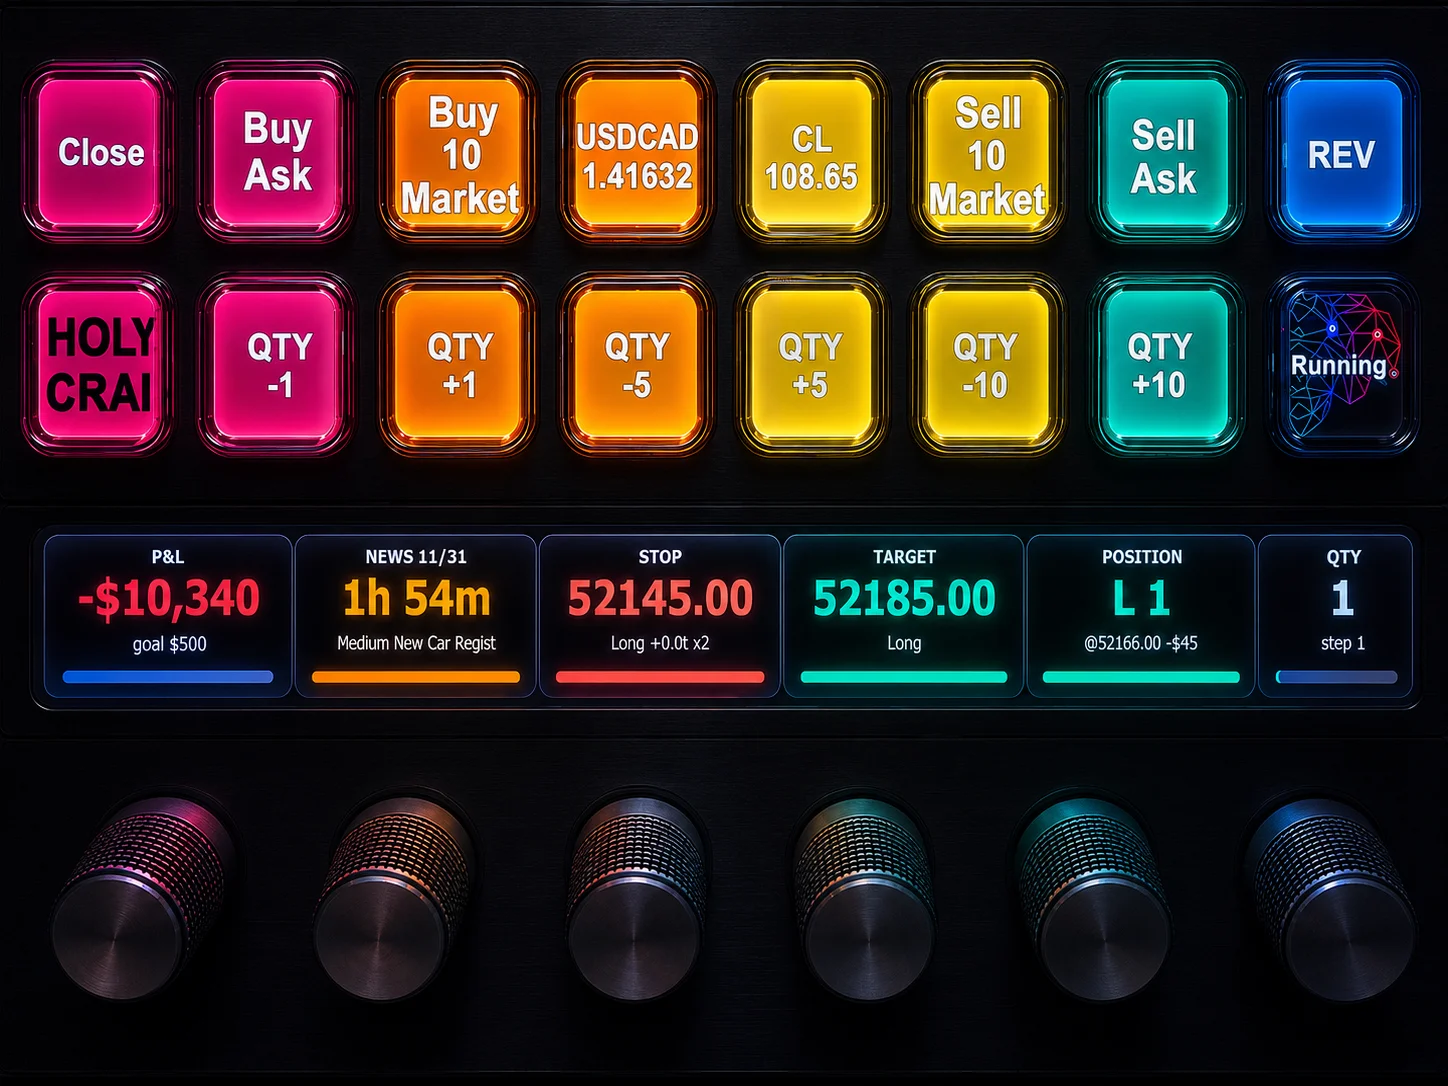
NinjaTrader 8 Hotkeys: Best Shortcuts for Faster Trading
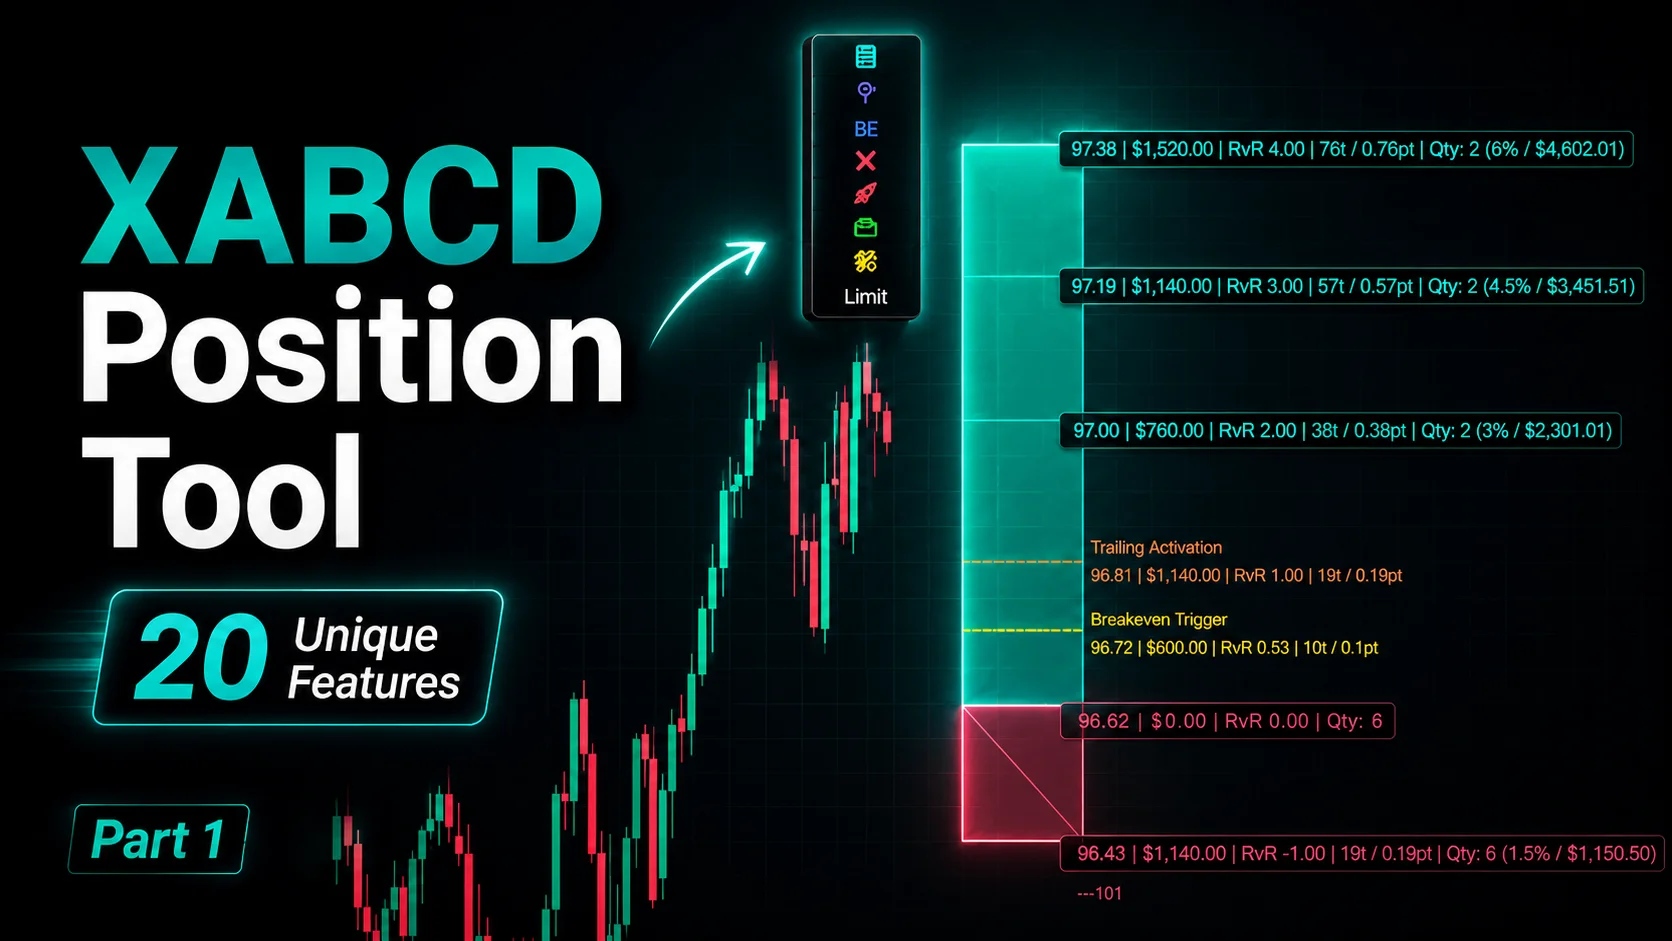
NinjaTrader Position Sizing Tool: 64 Features Stock NT8 Does Not Include
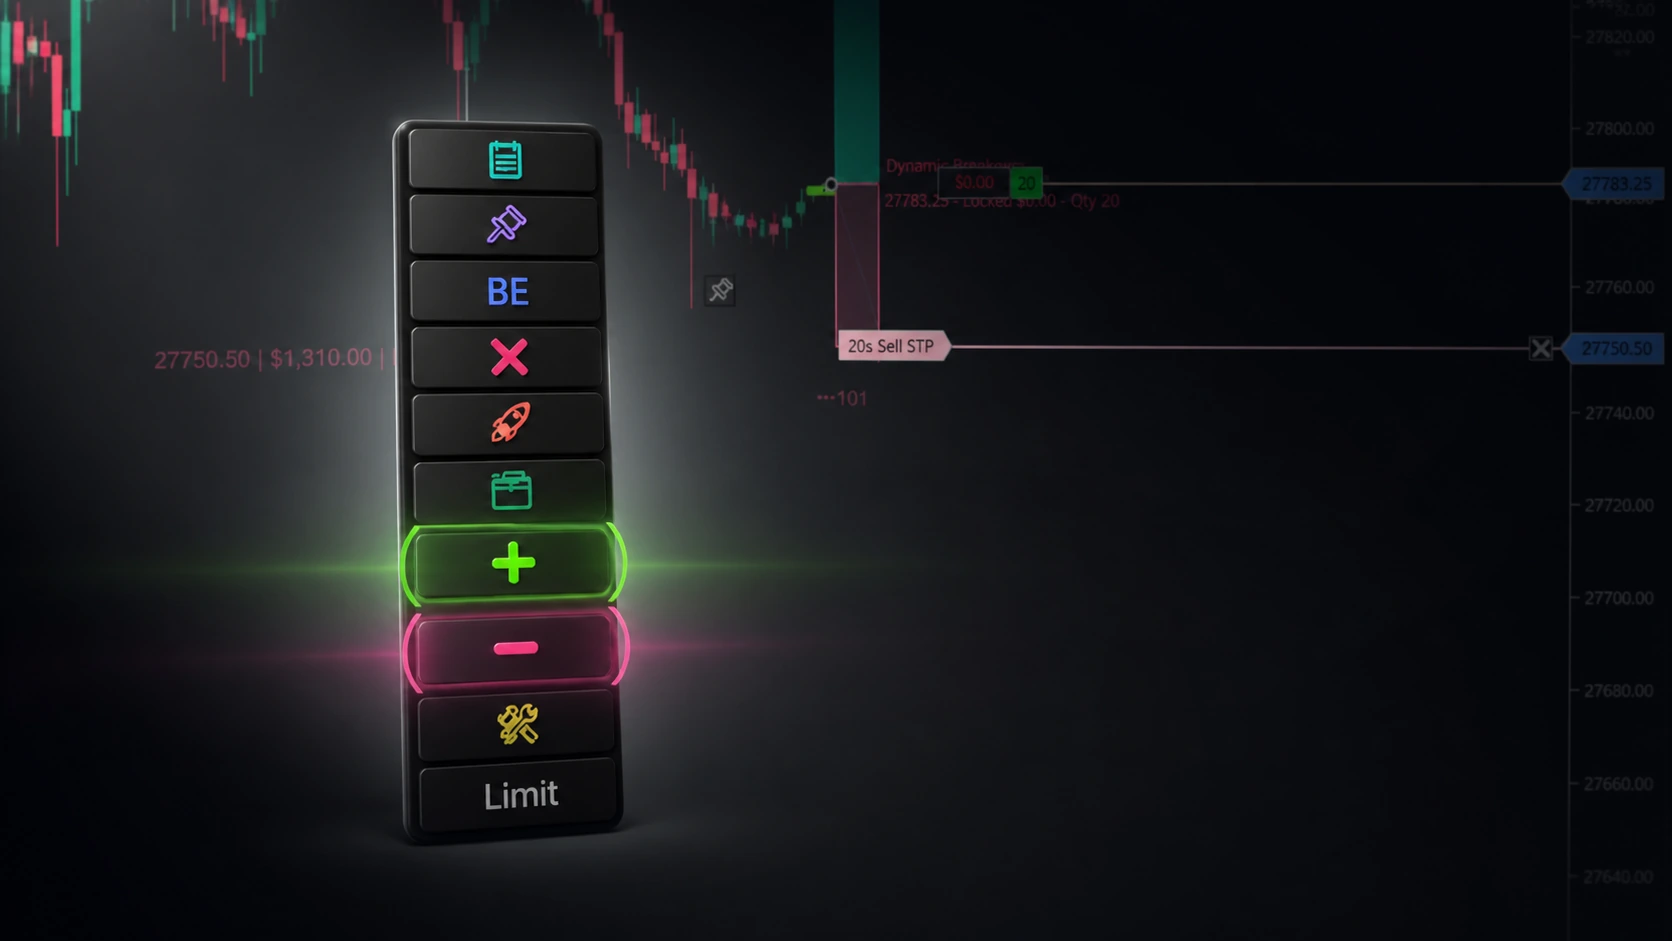
NinjaTrader – Adding to Position: A Field Guide for Active Traders
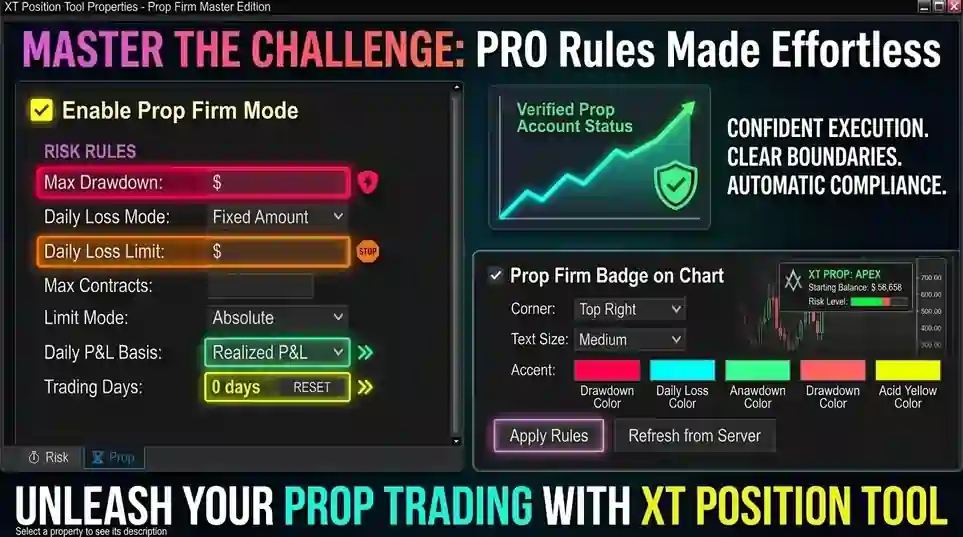
NinjaTrader Prop: The Ultimate Guide to Prop Firm Trading