XABCD TRADING
Difference Between XABCD Patterns vs Elliott Wave
Subscribe
to get alerts to our next blog post!
Comparing XABCD Patterns to Elliott Wave
We've recently spoken to a bunch of Elliott Wave traders, and have heard many have been moving in droves to use patterns. A large portion of those have turned specifically to XABCD Trading and these patterns specifically. But why? What are the differences between elliott wave and xabcd patterns?
There are many differences to point out between Eilott Wave traders and XABCD Pattern traders that we'll go through below. However, one that is really important to point out first is that Elliott Wave traders look for patterns in trends only. Very few have talked about any "end of trend trades" as they are often avoided because their outcome is not as predictable. Many would agree that the market will range 70% of the time and trend 30%. With that being said, Elliot Wave traders should only be trading 30% of the time and this could potentially lead to a lot of missed opportunities.
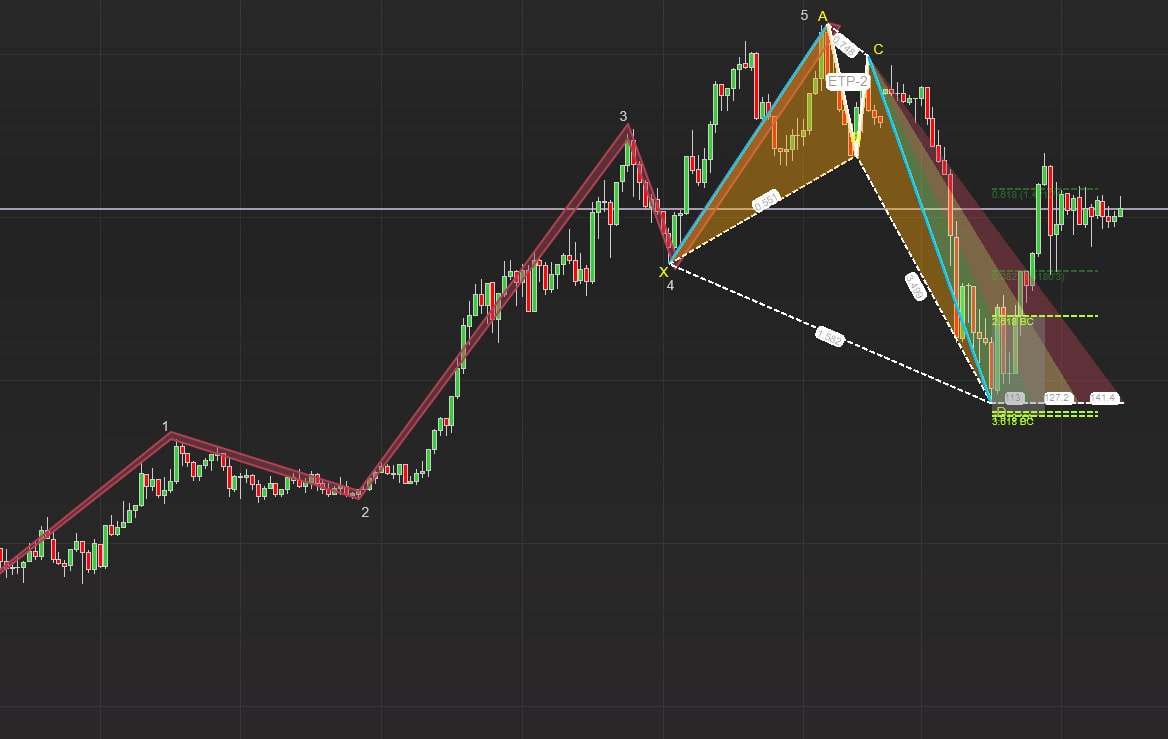
With XABCD Patterns they can be used in both trending and ranging environments. Patterns such as the RTP-2 are great for ranges, and patterns like the RTP-1 would be better suited for a channel. The key though is that you can seek opportunities regardless if your in a trending or ranging market.
Here is how we will compare the two strategies:
- How Patterns Are Measured Differently
- How Pattern Points Are Selected in Elliot Wave vs XABCD Patterns
- Stop Placements on Trades
How Patterns Are Measured Differently:
XABCD Patterns
A more specific pattern. The benefit here for XABCD Pattern traders is the ability to have patterns measure using both price and time ratios.
Elliott Wave
More vague. Elliott wave patterns are made up of impulse and corrective waves. These are selected by high'sand lows in the market. The reason why this is a problem is because high's and low's are different for a lot of people. There is a lot of debate to try and figure out what is a good high or low. This causes a lot of confusion when dealing with elliot waves.
How Pattern Points Are Selected in Elliot Wave vs XABCD Patterns:
XABCD Patterns
With XABCD Patterns there are specific requirements to determine correct high's and low's. This would include measuring the distance between each high and low or how many bars required to a lead up before every high or low. Specific rules are followed.
Elliott Wave
The difficulties traders find with Elliot Wave is that you could put 10 people in a row and ask them to come up with valid high's and low's for a pattern and all 10 people would have 10 different results. This is because any high/low is valid depending on who is looking at it.
Stop Placements on Trades:
XABCD Patterns
With XABCD Patterns, stops are placed outside of the maximum fibonacci lines and within the correct time restraints. So a stop out side of these values are very easy to decide.
Elliott Wave
With Elliott Wave you have a point where you expect price to reverse, however where after that your stop goes is anyone's best guess. You would have to have a consistent way of having your stop placed in the same way every time.
As you can see in the above differences, Elliott Wave patterns tend to have an audience that is left more confused than if you used XABCD Patterns with specific rules.
New NinjaTrader Articles Delivered First

Easy Order Tool
The Strategy


Scanning & Alerting

NinjaTrader Release

XABCD News (Free Version)
XABCD News (Community Edition) is the best free Indicator for NinjaTrader 8. Don't let news sneak up on you again. Puts economic news events on your charts so you can stay informed and move around positions/stops before the news is released. Works in any market.
XABCD Priceline (Free)
XABCD Price Line tool for NinjaTrader 8 will draw a line at current price and move every time the market changes price. This is useful because it will allow you to easily identify where price is at all times and the exact quoted price.
NinjaTrader Position Sizing Tool: 64 Features Stock NT8 Does Not Include
NinjaTrader – Adding to Position: A Field Guide for Active Traders
NinjaTrader Prop: The Ultimate Guide to Prop Firm Trading
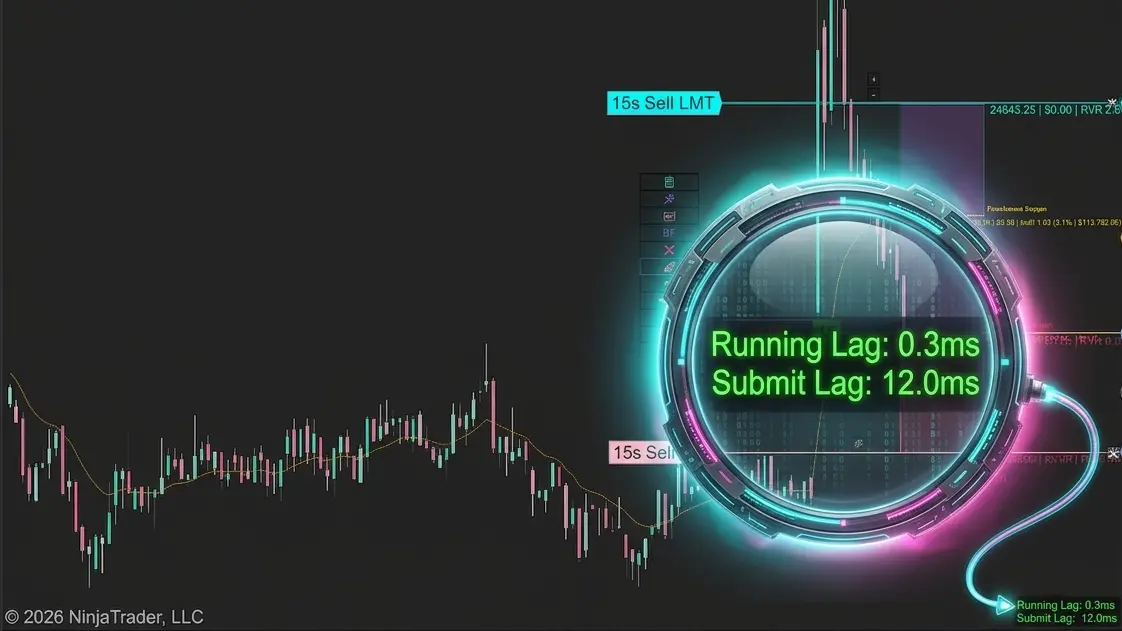
Does the XABCD Position Tool Lag?
NinjaTrader Position Sizing: What the XABCD Position Tool Can Do That ATM’s Can’t
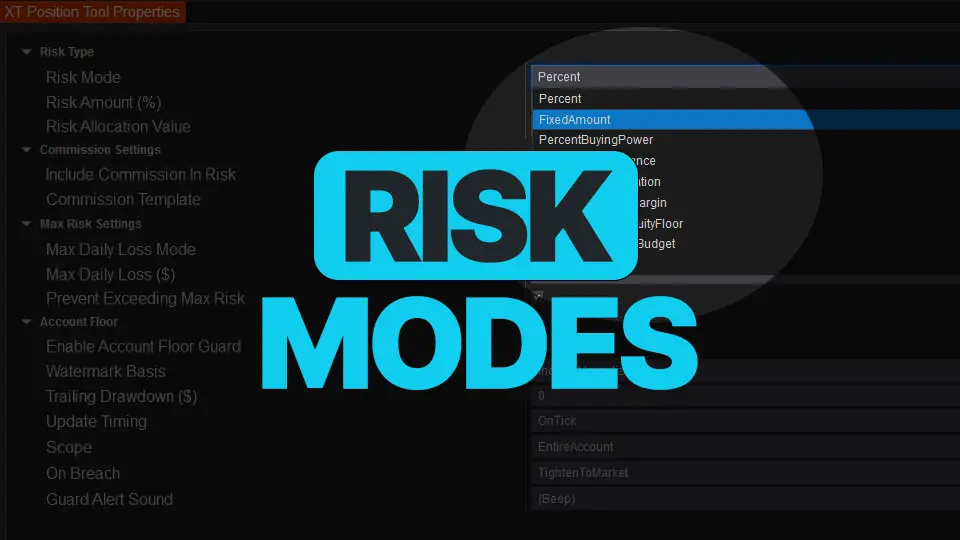
NinjaTrader Risk Management That Actually Moves the Needle
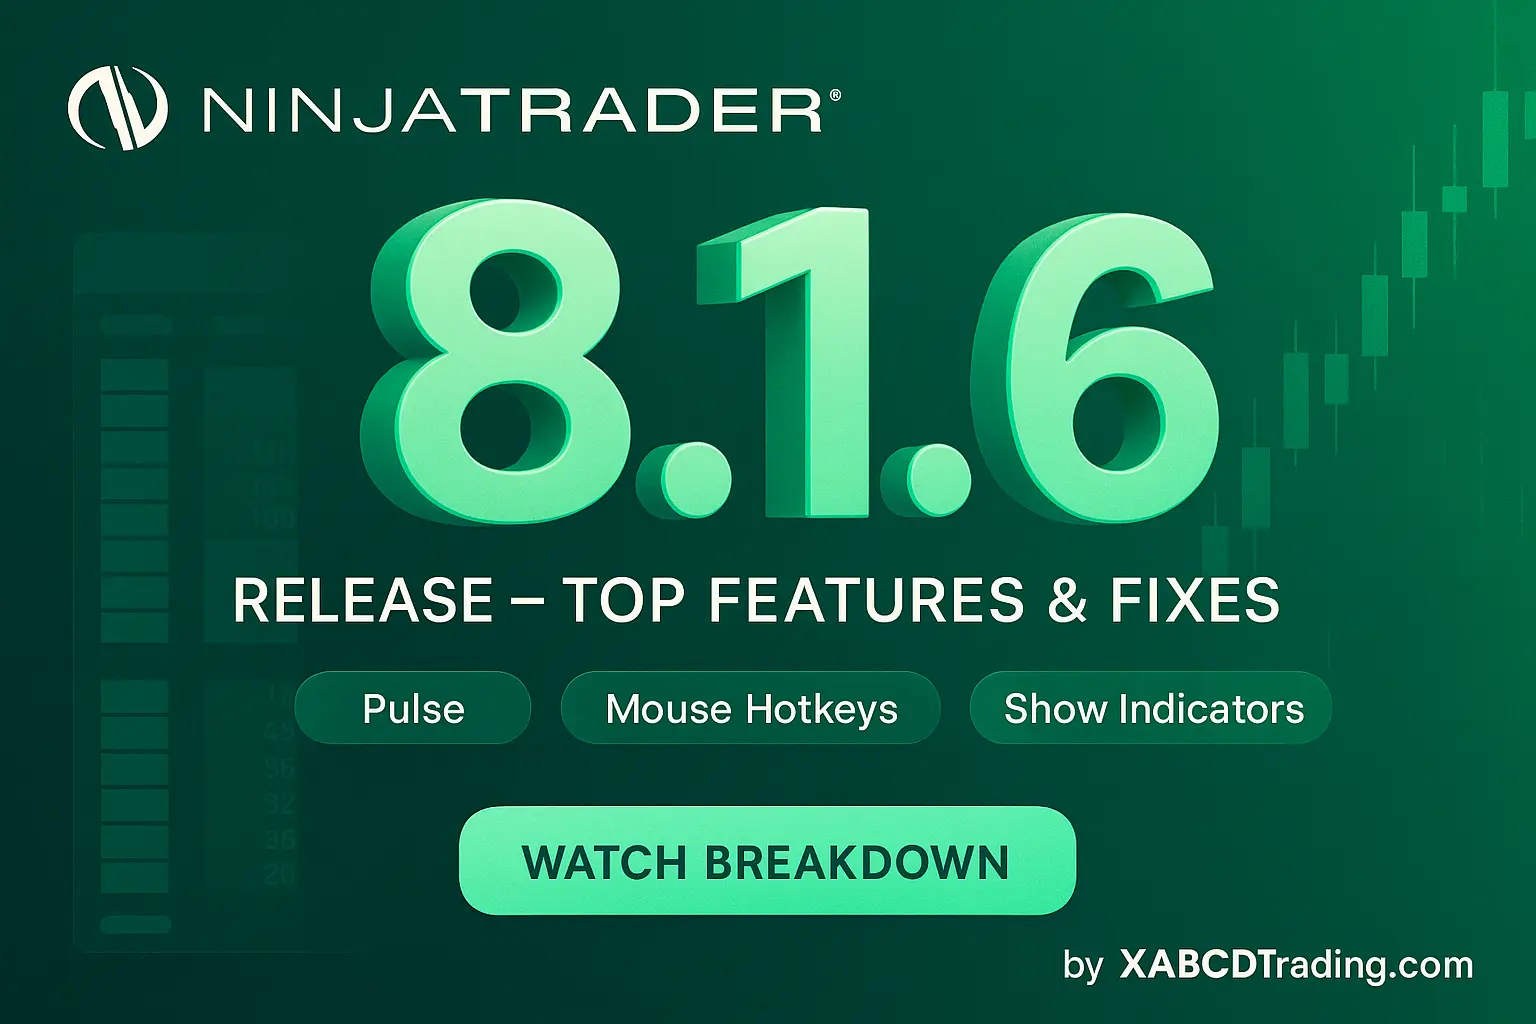
NinjaTrader 8.1.6 — The “No Fluff” Tour (Speed, Clarity, Fewer Clicks)
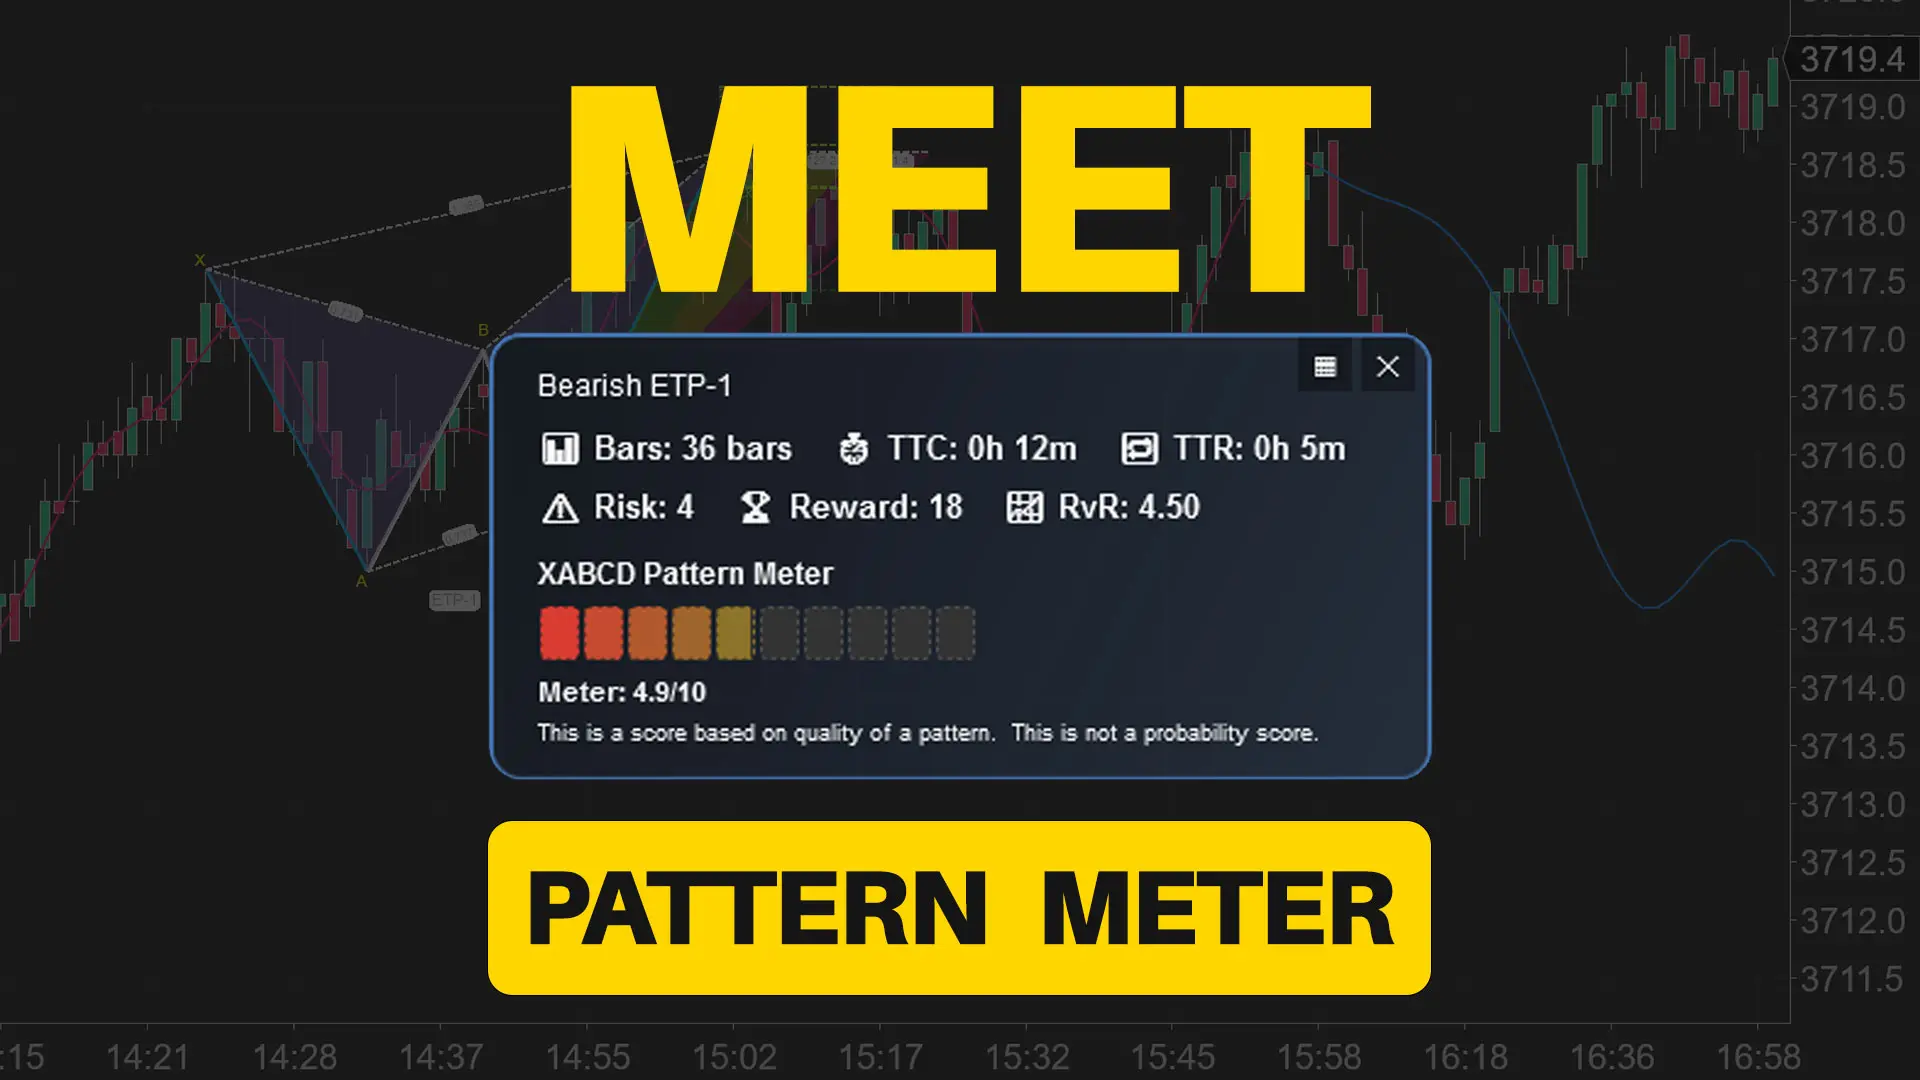
Meet the XABCD Pattern Meter (Real-Time Clarity)
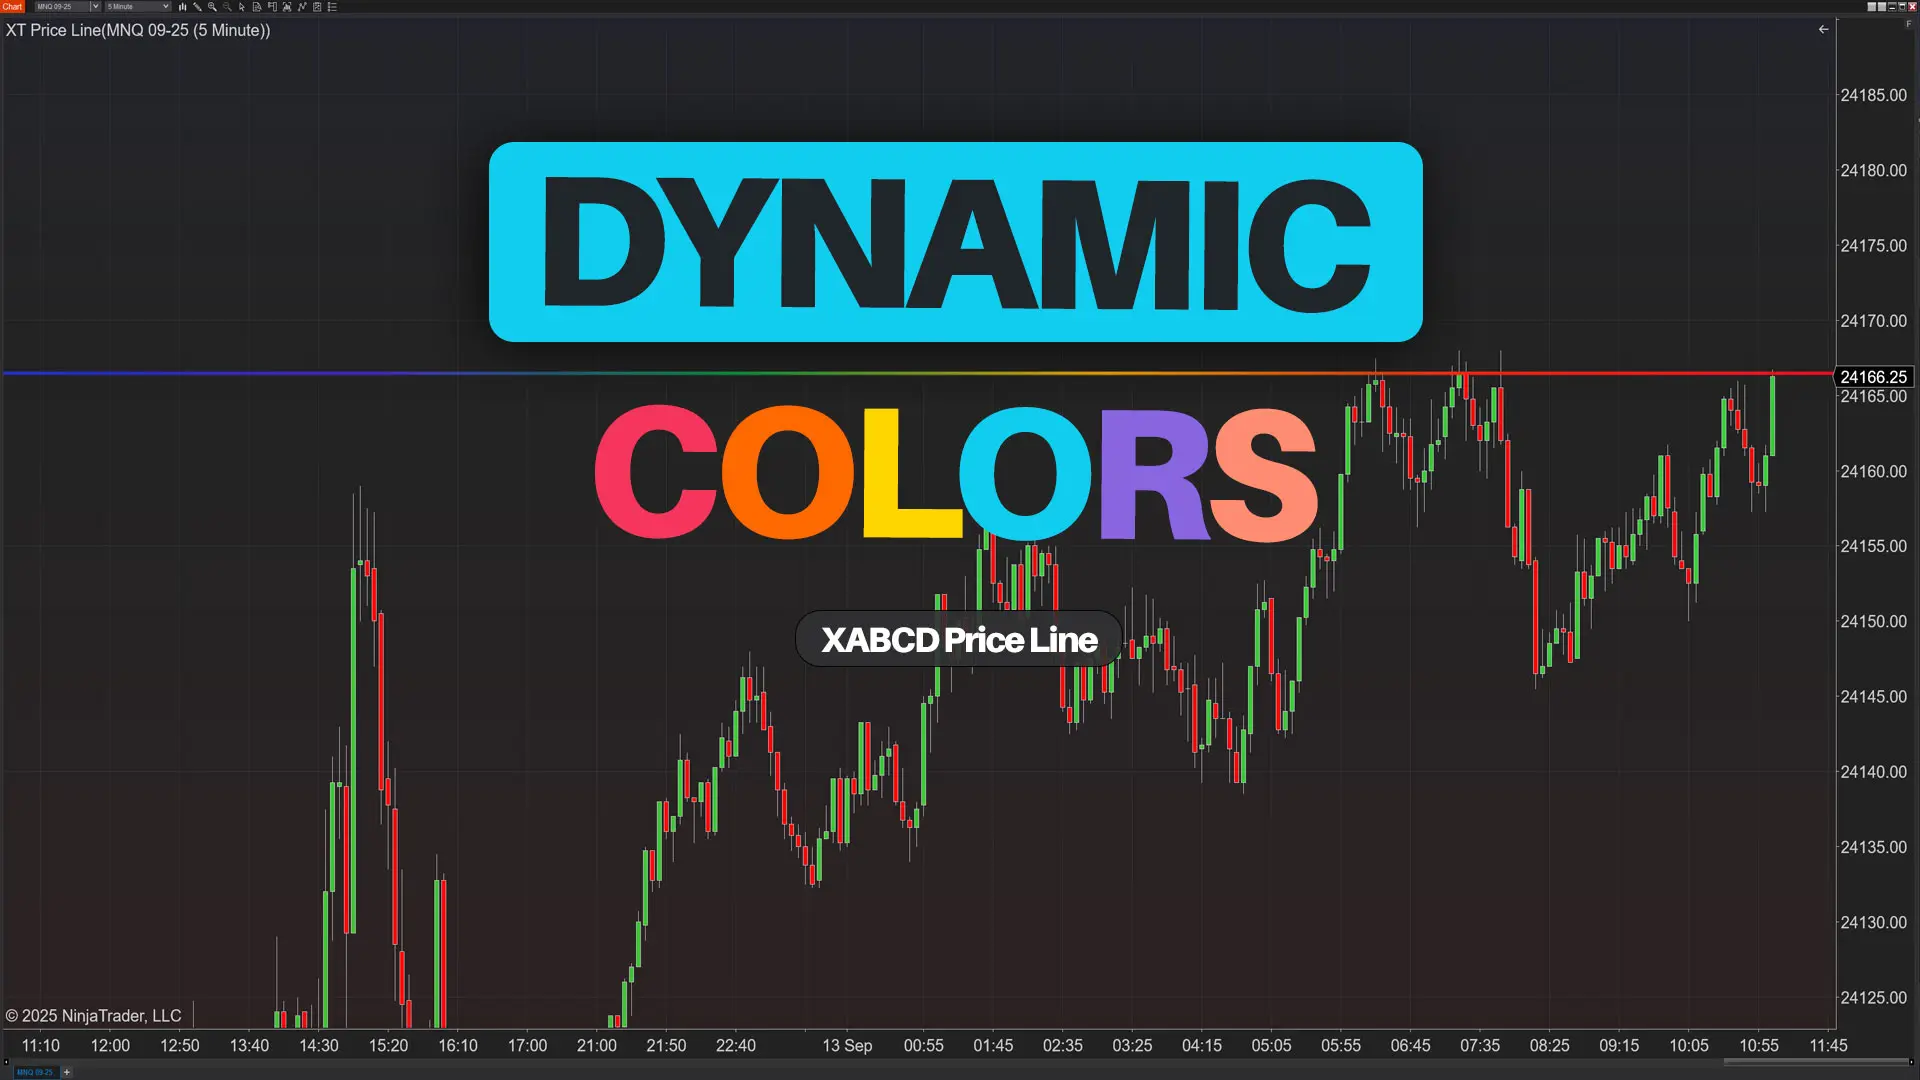
XT PriceLine: Dynamic Colors That Let You See Every Tick