XABCD TRADING
The Complete Guide to XABCD Pattern Trading
How to Identify, Draw & Trade XABCD Patterns Step-by-StepWhat is a XABCD Pattern?
An XABCD Pattern must contain 3 types of measurements.
- Fibonacci Price Measurements
- Fibonacci Time Measurements
- Frequency Wave Analysis
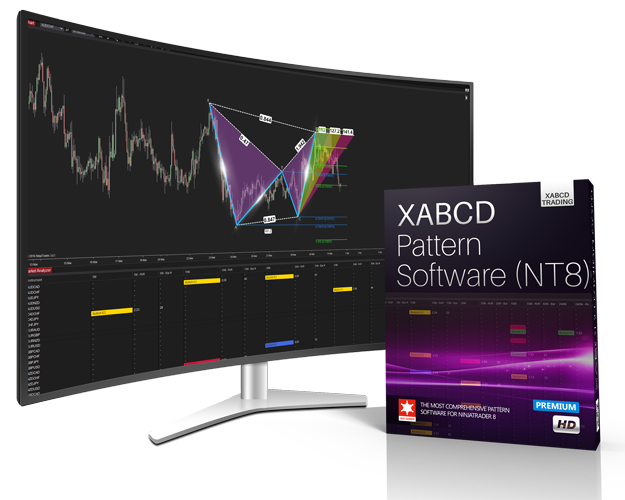
Scanning, Alerting and Auto-Drawing: Our one-of-a-kind software fully automates XABCD pattern scanning, drawing, and alerts—leveraging both price and time analysis for unmatched precision and trading speed.
Table of Contents
- What is a XABCD Pattern?
- How to Find XABCD Patterns?
- Benefits and Challenges of XABCD Patterns
- Learn to Trade XABCD Patterns (Free Video Course)
- There Are Several Categories of XABCD Patterns
- What Makes for Better XABCD Patterns?
- The Pattern You Can't Afford to Ignore
- The Best Time Frames for Trading XABCD Patterns
- The Best XABCD Pattern Indicators
- Mastering Risk Management with XABCD Patterns
- Want to Learn More About XABCD Patterns?
How to Find XABCD Patterns?
Manually Looking for Patterns
You can find these XABCD Patterns manually by using your Fibonacci tools. However there are 12 measurements that need to be done. This could lead you to draw things incorrectly as human error is possible. In fact, its very rare where i've seen a chart drawn in by someone else that didn't have any big glaring mistakes. In this day and age, its best to use software that can draw this accurately.
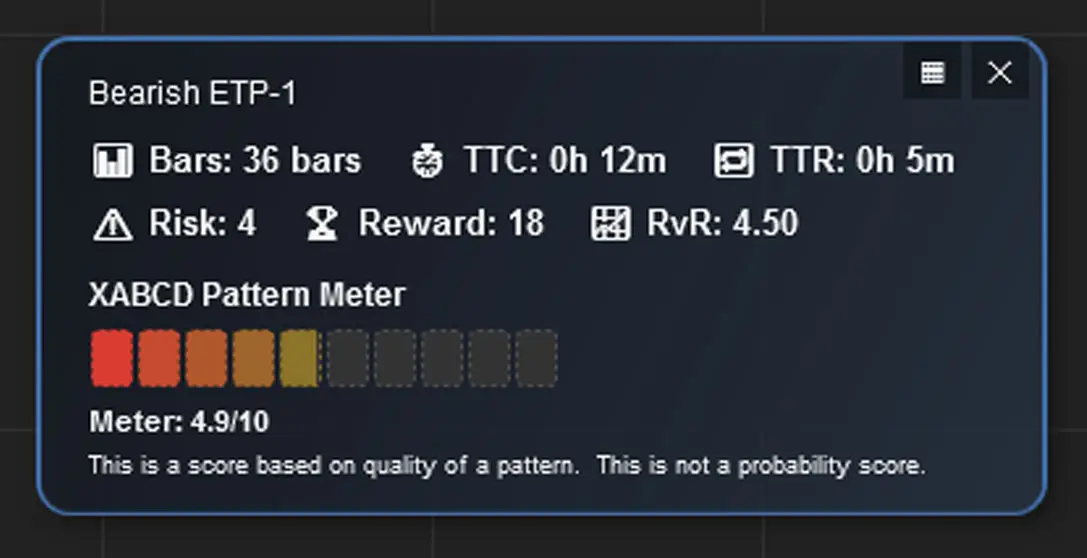
The XABCD Pattern Meter to help filtering patterns.
If you did want to map out the patterns, your going to want to follow a video on how to identify the best xabcd patterns. This video will go over how to understand if you have a good "X" point. This will be important. Drawing a xabcd pattern means you have to follow certain rules in order for all the ratios to line up.
Finding and Alerting Automatically
We're in the day of age where we should be leveraging technology. Software such as our chart pattern indicators can process large amounts of data without getting tired. This is what prevents a lot of human error and makes trading a lot easier by getting alerts that a pattern has been found.
Some examples for using the XABCD Pattern Indicator Suite are:
- Chart pattern indicator software can be unbiased
- Continuous monitoring for Fibonacci trading patterns
- Can discover hidden patterns your eyes might not see
- Consistency doing technical analysis to find reversal patterns
Benefits and Challenges of XABCD Patterns
XABCD Benefits
Let's create a list of XABCD Pattern benefits:
- Consistency - Giving you the ability to take a consistent approach in your execution but also in how you approach your trade and risk of every trade.
- Very black / white decisions compared to other methods of training. Technical analysis reversal patterns are not subjective like Elliot Wave patterns where wave counts would be counted different ways by many people.
- Automating Your Workflow A large portion of the work can be automated since scanning and discovery can be challenging especially to new traders.
XABCD Challenges
Given all the positives around XABCD Patterns, can there be any negatives?
- Learning Curve - While most would think this would take up a huge chunk of time - it doesn't and if the information is presented well, the knowledge can be transferred more easily. So although there is some learning curve it's not as large as it might seem.
Learn to Trade XABCD Patterns (Free Video Course)
Below the videos we continue with the text, so if you can't watch the XABCD Pattern videos (bookmark the page to watch them later) but you can continue reading about them below the videos too.
There Are Several Categories of Fibonacci Trading Patterns
The categories of XABCD patterns can be broken down into retracement, extensions and x-point patterns. Below we have broken them down and have given you a bit of a description about each of them. Finding them can be tricky if doing it on your own and very time consuming as there are approx 11 ratios in each pattern to measure out. Instead we do it automatically with some tools we've created. They also work with audio alerts and other alerting methods so you don't have to waste your time trying to find them but instead just doing your analysis.
Retracement Time Patterns (RTP Patterns)
RTP Pattern Rules
XABCD Patterns that fall into the category of RTP patterns all have a D point that does not exceed the X point of a pattern. These patterns will have a D point (where we would like to see price reverse) close to the B point. Different RTP XABCD patterns can be used in channels or ranges so be sure to know which one to use in which situation.
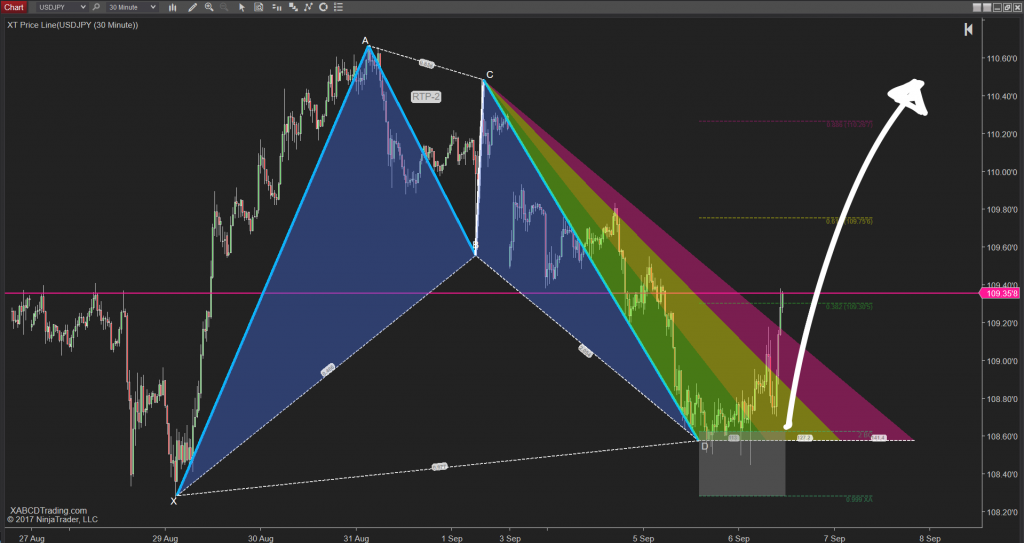
Important Note About RTP XABCD Patterns
These RTP (Retracement Time Patterns) look like M's and W's and are the same geometrical shape with different measurements. They are the same pattern of emotions with different lengths and we look for different ratios.
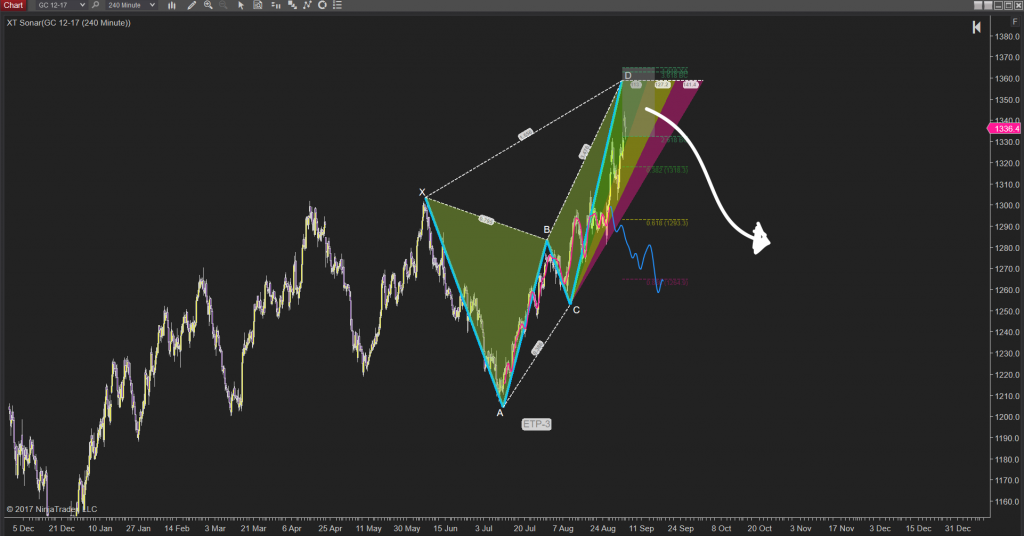
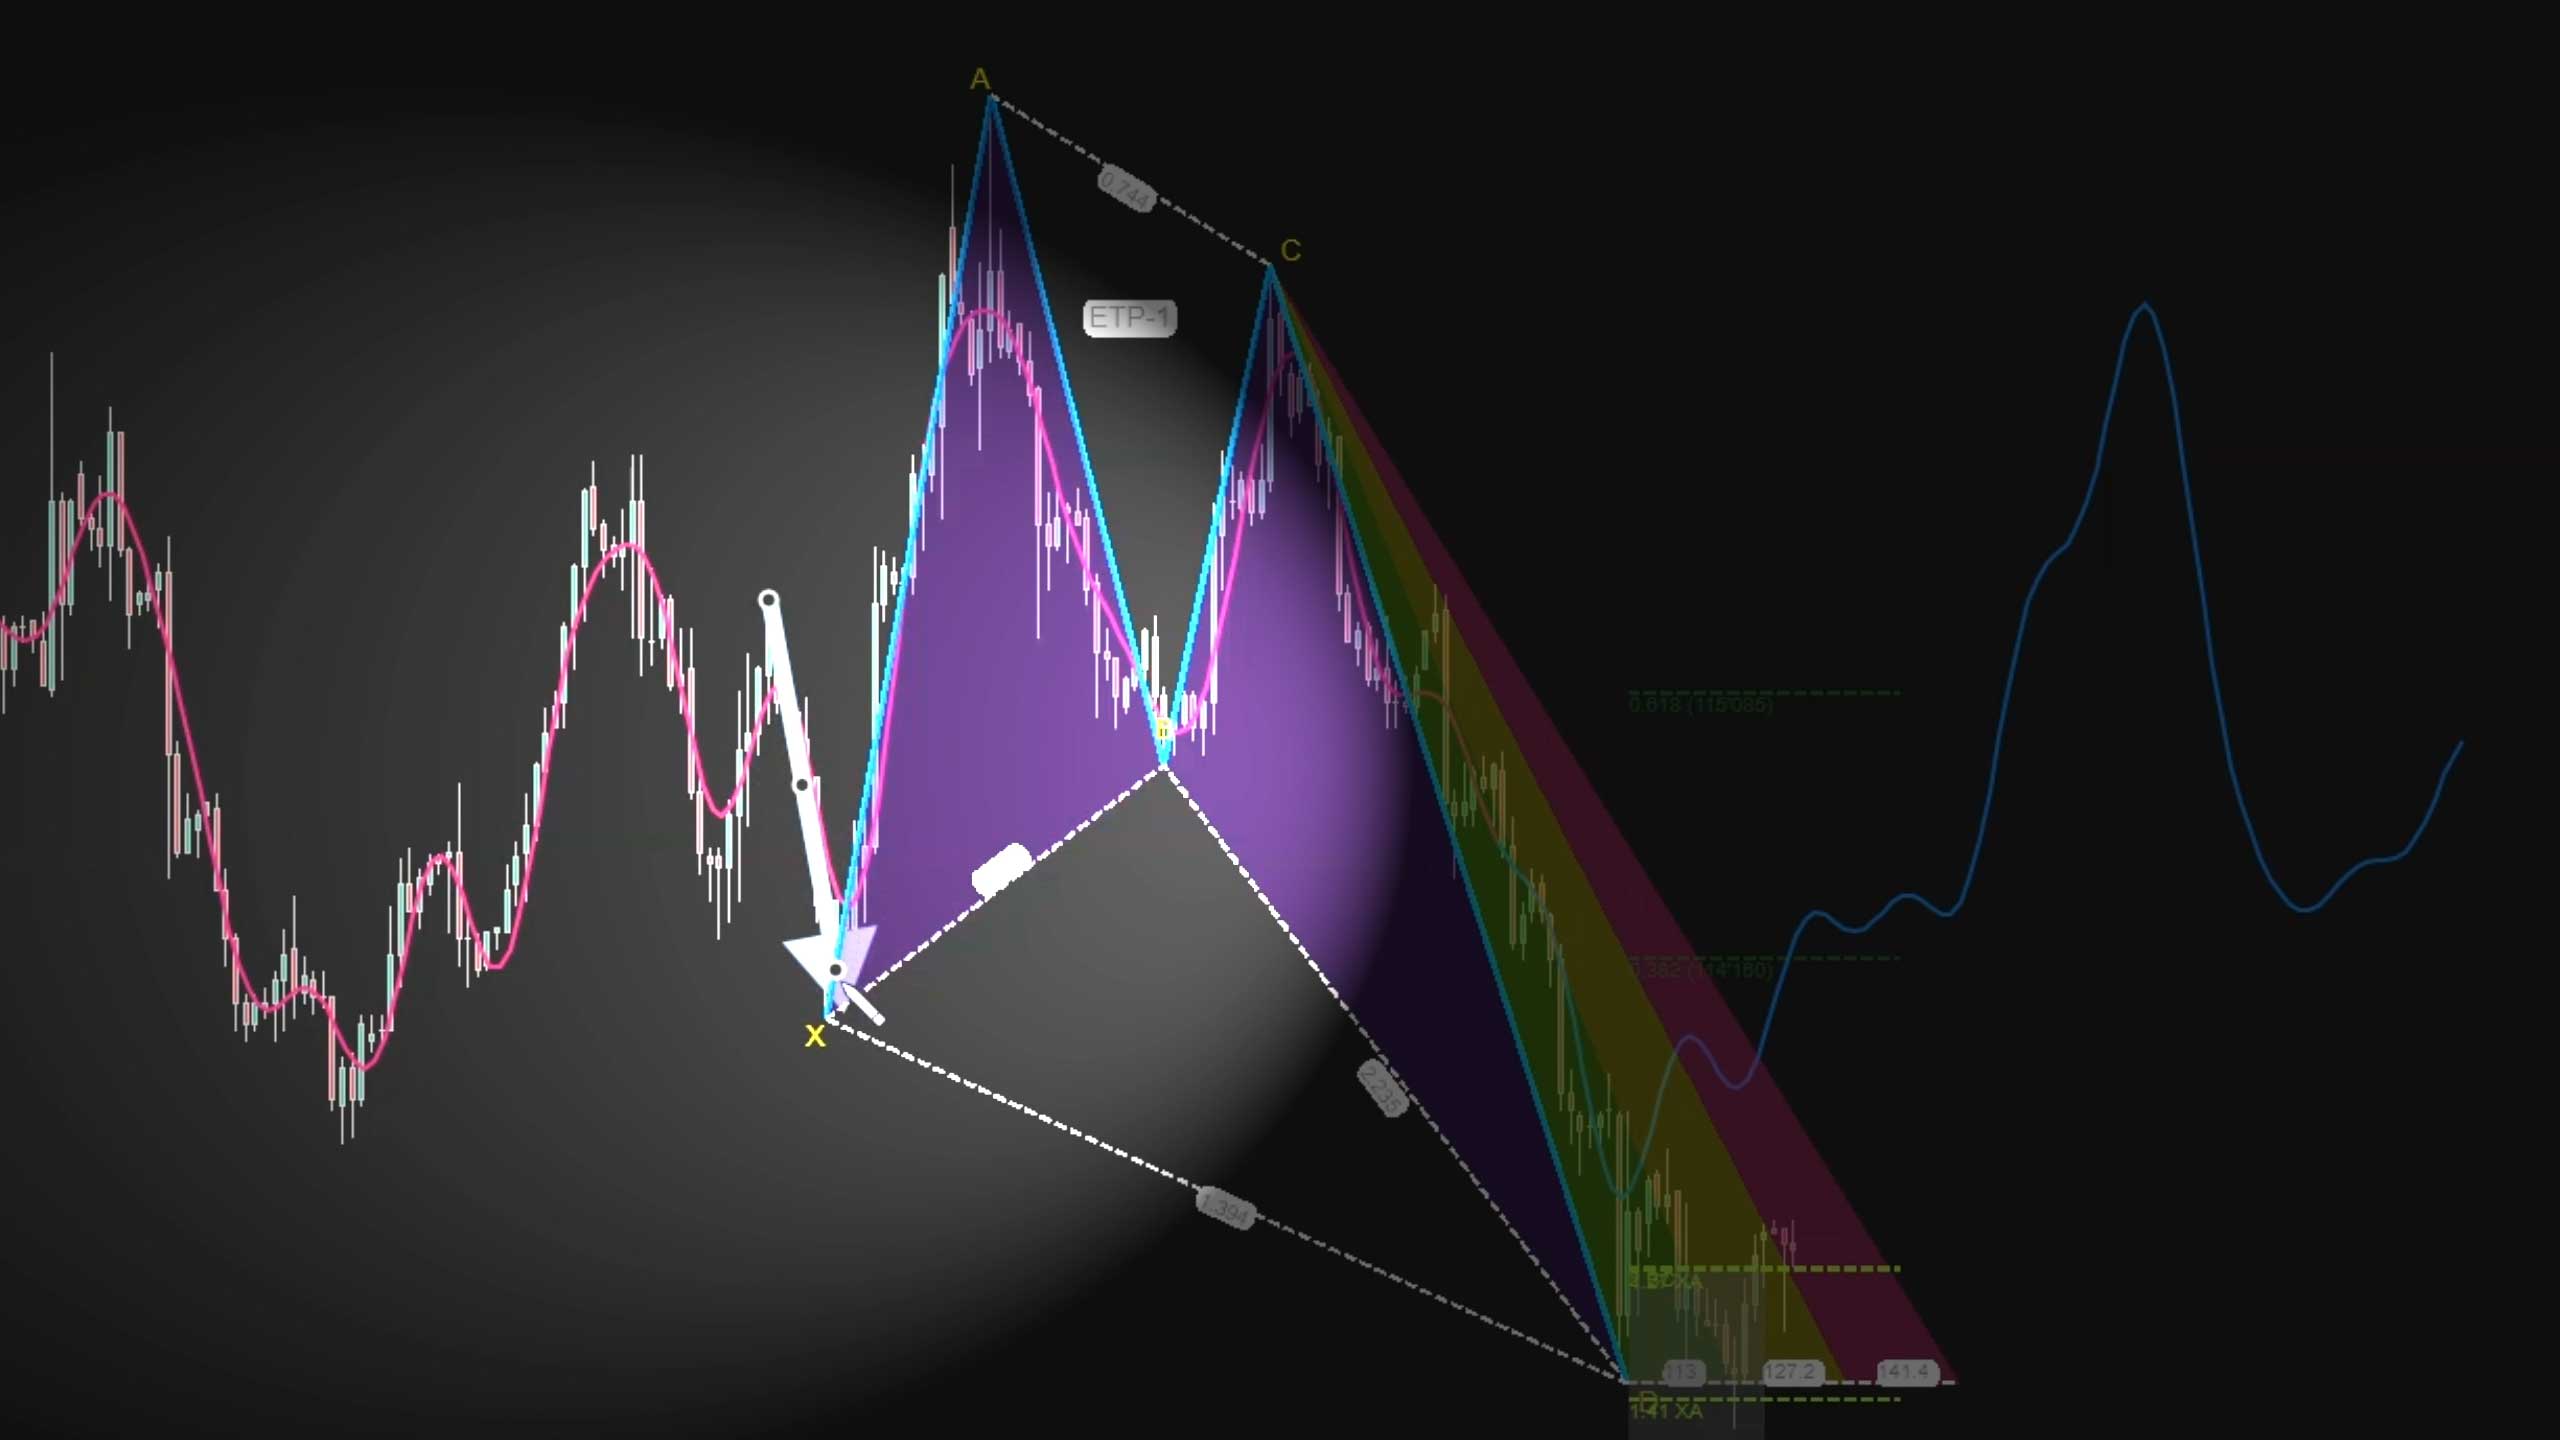
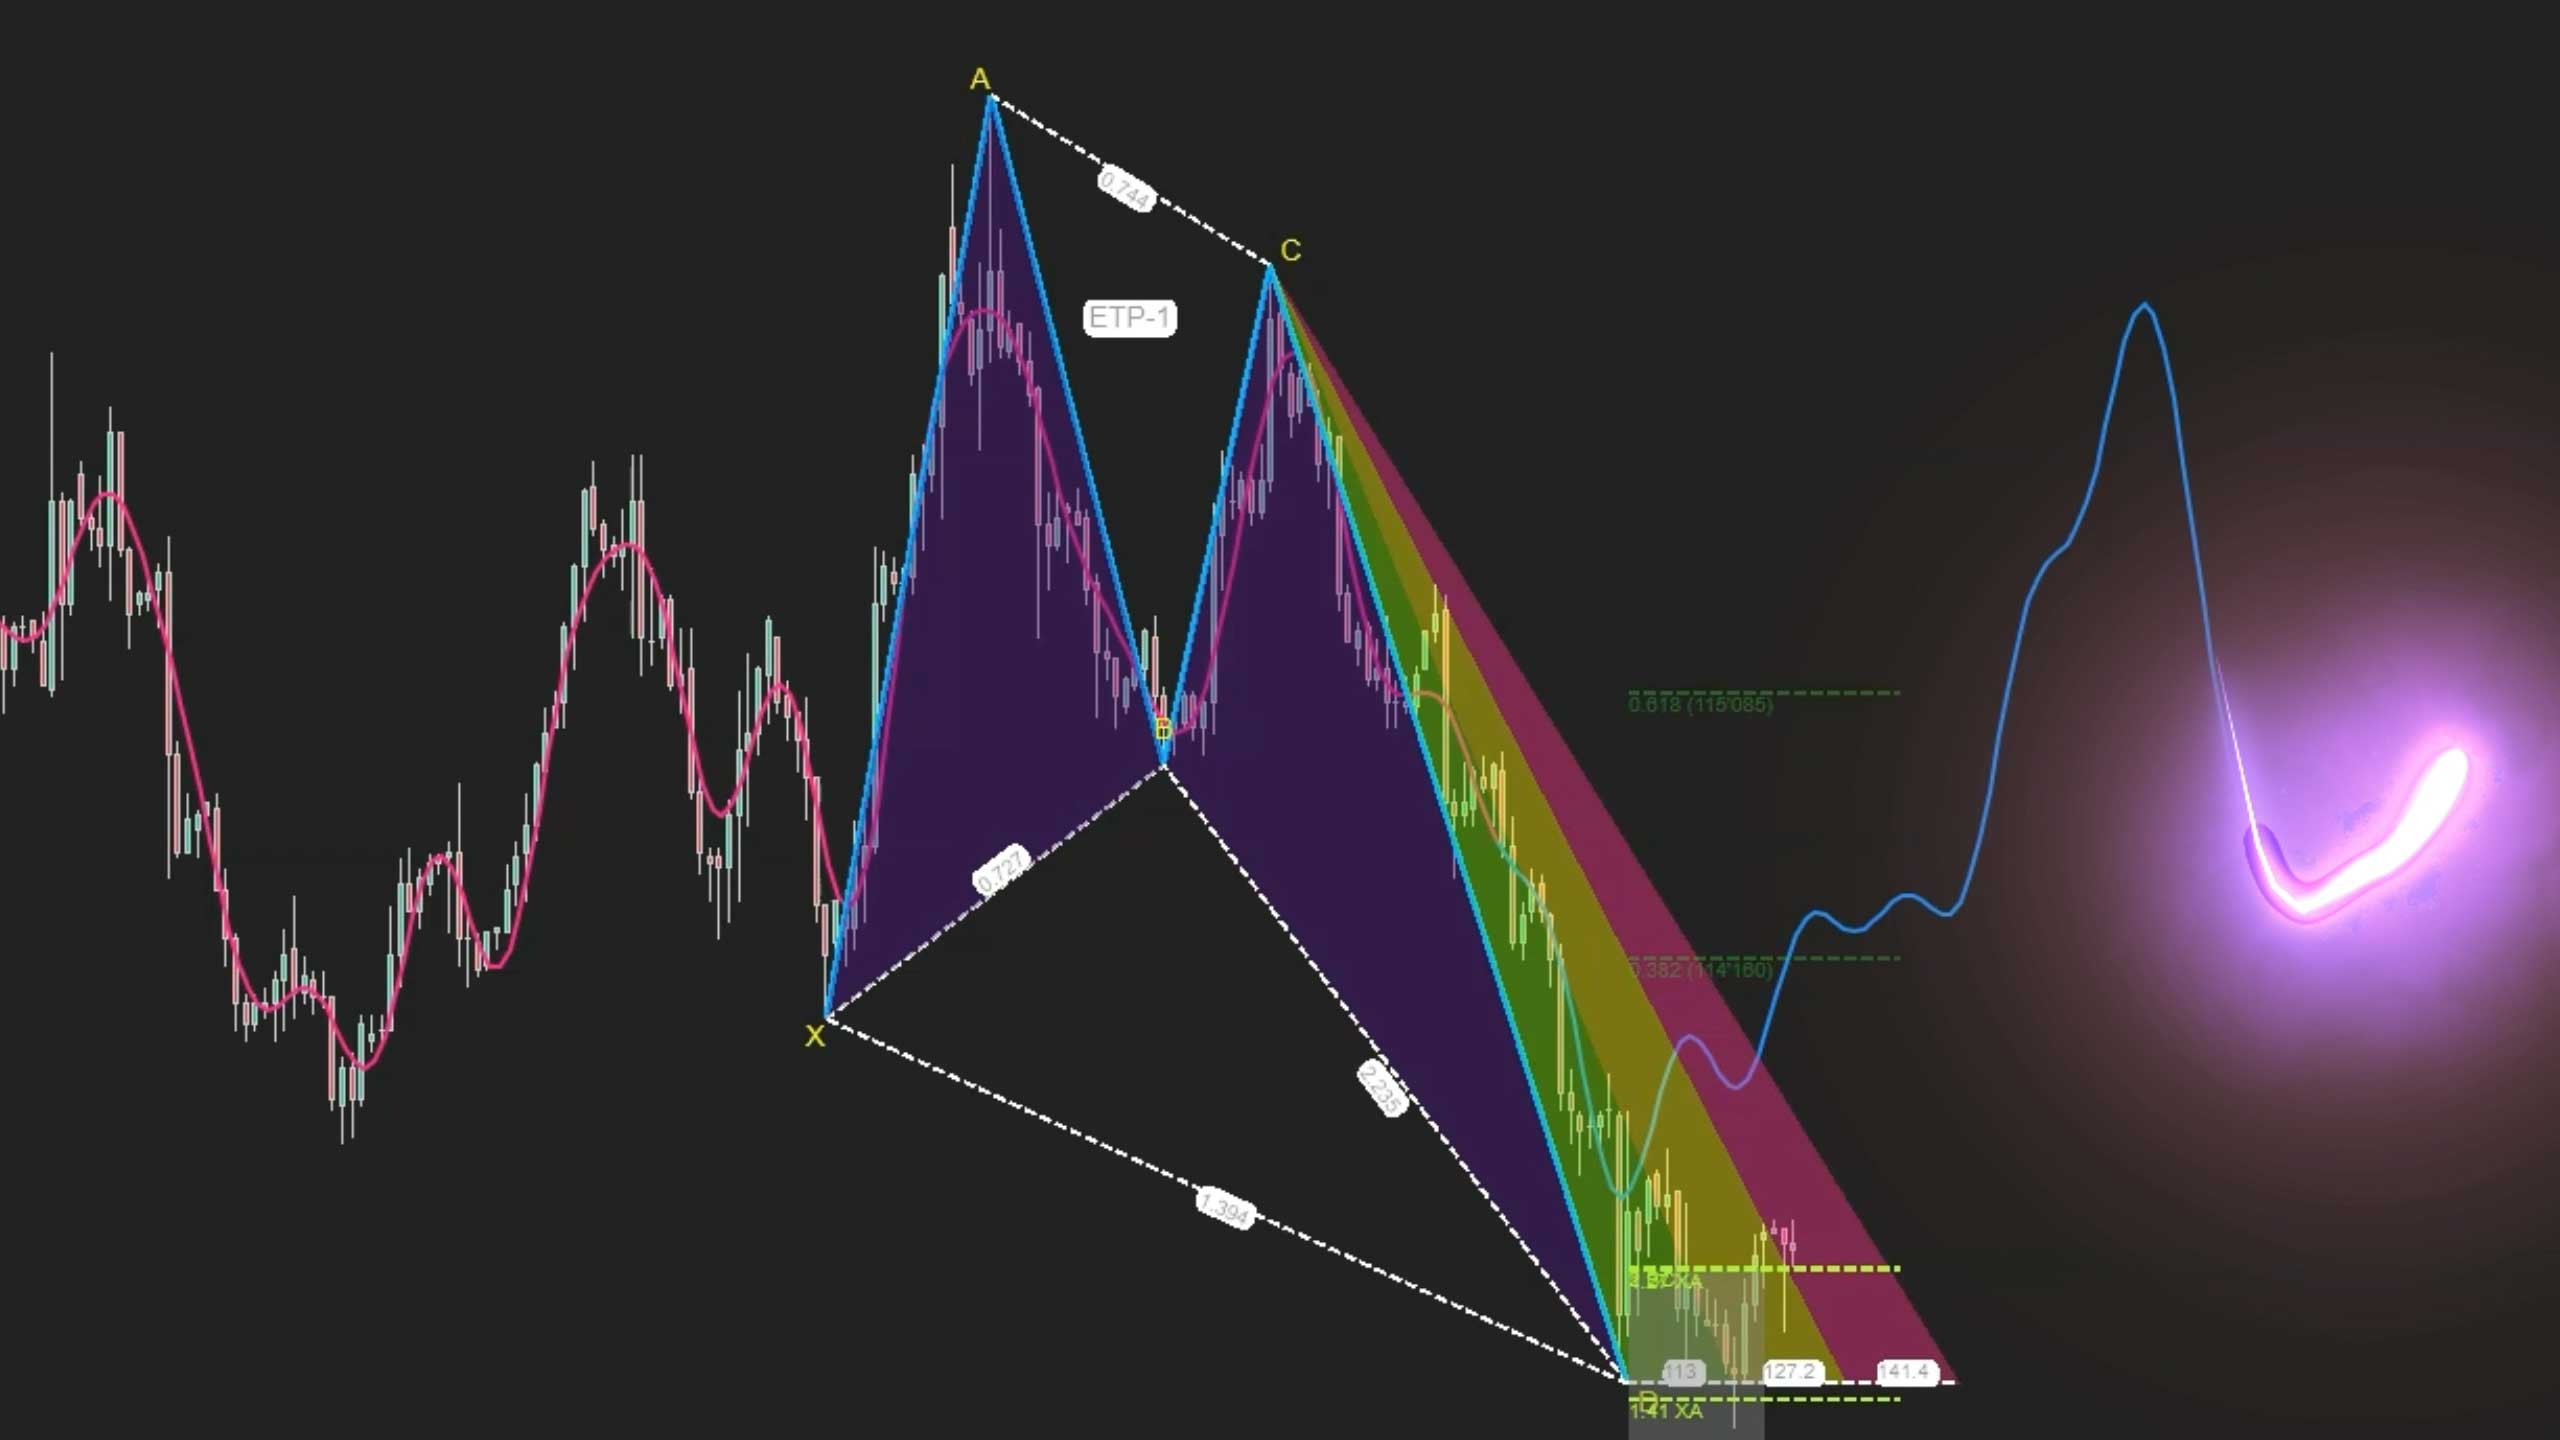
Extension Time Patterns (ETP Patterns)
ETP Pattern Rules
ETP-1 XABCD Patterns will have a D point that always goes beyond the X point. You will see we have different levels of ETP patterns (ETP-1, ETP-2, ETP-3 etc) and each level will define how much above the X point the pattern extends.
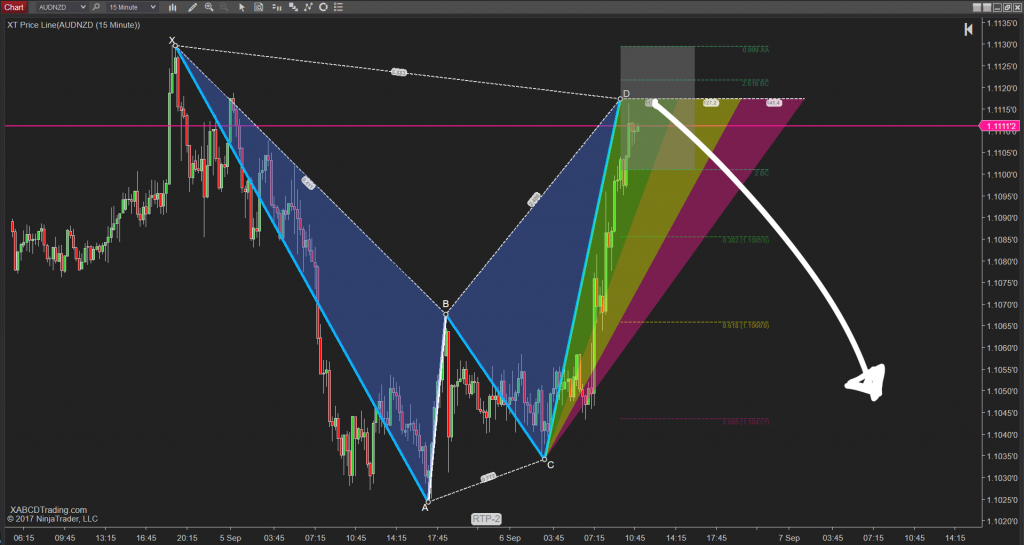
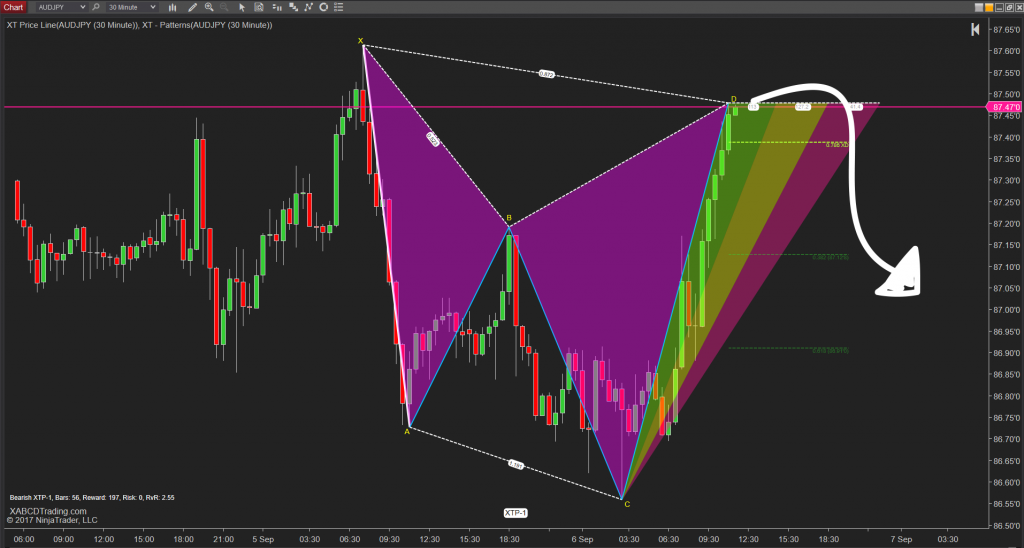
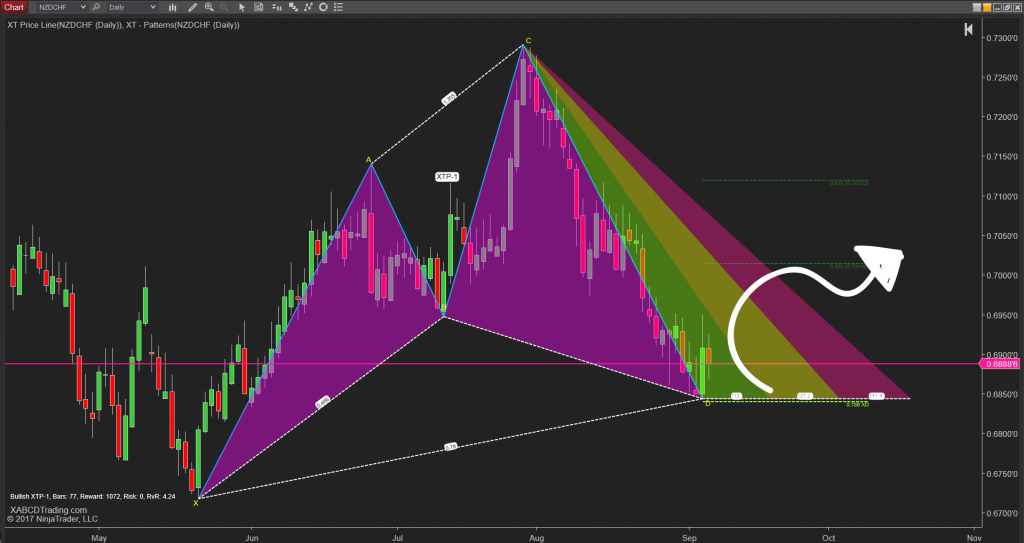
X-Point Time Patterns (XTP Patterns)
XTP Pattern Rules
X-Point patterns all have ratios that are based off the X-point of the XABCD pattern. These can also be used in our real time and confirmation mode scanners available to our members.
There are two main patterns we scan which are XTP-1 and XTP-2 patterns.
What Makes for Better XABCD Patterns?
While, the best XABCD Patterns will have certain characteristics about them as the pattern forms. Next, the first is going to be looking at the "X point" of the pattern. The "X" Point starts off the pattern. It's where the external bars (the bars before the pattern starts) converts to the internal bars (the bars that make up the pattern). You want to see a clear lead-in to this "X Point" with a very obvious reversal.
Next, the outside edges of the XABCD Pattern should also get your attention. If your using the XABCD Pattern Suite then the outside of the pattern will be blue or white. If it's white, there isn't enough time built into the pattern and it will lack some consistencies. So we want to look at the outside edges and make sure all the leg segments are blue.
Next, looking at the Sonar Waves would give us another idea if that pattern is forecasted to reverse. These sonar waves heading in the same direction of the pattern is a good sign. Therefore, a trader can use it when deciding how to weight trades.
Can't Afford Not To Know this Chart Pattern
I'm going to walk you through why this is a pattern I specifically look to find.
Next, I'm going to walk you through why this is a pattern I specifically look to find.
Core Reasons for Choosing This Pattern
First, the first reason this pattern is my favorite is that it isn’t one of the classical patterns like the head and shoulders or a three-bar reversal. Instead, it’s an XABCD-style pattern built on Fibonacci ratios. Ofcourse these ratios measure both price movement and the time it takes for the pattern to form, which adds consistency. Therefore, unlike older patterns that only focus on price, this approach leads to more reliable results.
Versatility and Simplicity
Secondly, this pattern is incredibly versatile. It works in trending markets, range-bound conditions, and even counter-trend setups. Whether the market is moving fast or slow, this pattern has applications across the board. Another big reason I love it is how easy it is to understand. Once you know what to look for, it’s straightforward to spot and apply.
Reliable Alerts and Flexibility
Third, another advantage is the pattern’s frequency. By using tools like scanners, you can find these patterns often enough to make them useful in everyday trading. It’s not so rare that you’re waiting forever for a signal, but it also isn’t too common to lose its value. Plus, the large reversal area gives traders more flexibility to combine it with other strategies, like support and resistance or trend channels.
Strong Risk-to-Reward Potential
This pattern also offers a favorable risk-to-reward ratio. Thanks to its low B-point structure, you can set up trades that provide a lot of potential reward with relatively little risk. Who doesn’t like more reward for less risk? This is another reason it stands out from more traditional patterns.
The Best Time Frames for Trading XABCD Patterns
These patterns are based off human emotions and there isn't one time frame that is better than another. That is probably because we are mapping out patterns of human emotions and the traders that are reacting to certain events react the same way if it's a shorter term move (a reaction to a news event), or a longer term move (trade wars etc).
One Difference in Time Frames: Spreads. If you're trading the market like the forex, your spreads can eat into (and change) your trades risk vs reward. This is something you want to watch. The risk vs reward is a critical metric when analyzing your trades for the month. The higher the reward, the greater the risk. It's like playing a lotto.
Additionally, we have traders using our software from tick charts to weekly charts. There are a few minor factors that come into play with the decision making process. Based off smaller vs larger time frames but this can be easily adaptable. However, you will have to know what to look for which you'll go over in our course.
We have done a lot of logging of patterns, and from the data we had collected there has been no difference in markets or time frames. Everything on a 5 minute and above going out to a weekly time frame. Obviously smaller time frames are more frequent than larger ones. Therefore, you will get more bars on a chart in a day one a 1 minute than you would a 60 minute. There were also no differences in markets. This all makes sense because patterns are created by humans and humans love repeating patterns.
More Consistency With Using Time and Price
One thing traders often look for is consistency within the patterns. How your going to identify that consistency is important. Fibonacci Time Measurements play an important role in XABCD Patterns.
How Time Effects Emotions
Imagine this - you're in an elevator and the breaks fail. Therefore, you go falling down 30 stories. What sort of emotional reaction would you have? Now imagine the same situation where you're in that elevator and the breaks' don't fail. The doors open in the lobby and you walk out.
In both cases you made it to the lobby of the building - but the emotions you had were very different. Since XABCD patterns map out human emotions then it would only make sense to take time into account in order to get a more consistent pattern.
We have to remember that when you put together an execution plan that if you want to make adjustments you need to make sure all the most consistent patterns possible. That way we can see more clearly the impacts that our changes have on the results pushing forward.
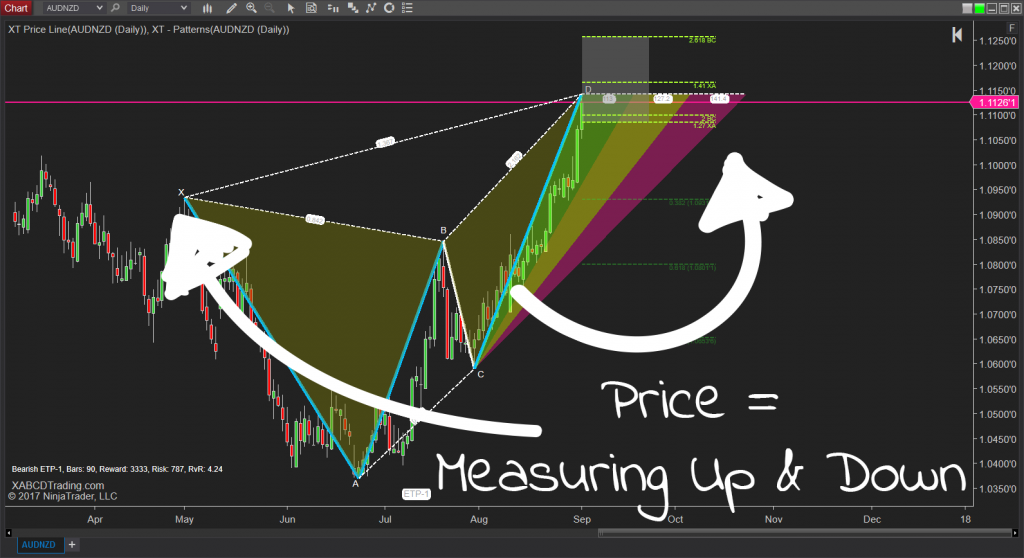
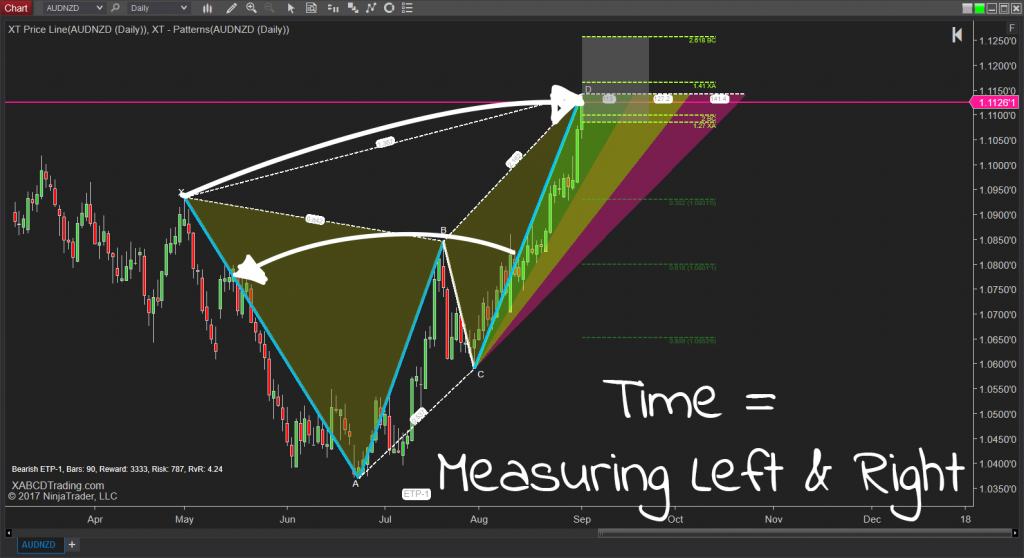
Constructing Patterns with Price and Time
Measuring time for each pattern can be very important when trying to find patterns that "look" the same. Without using software like ours to scan the patterns for both time and price it would be difficult to do this manually on your own. Traders that use patterns are looking for repeating emotions that happen over and over again in the market. That is basically the edge that pattern traders want to see, and get alerted too and trade. Using time would be one way to measure the patterns so the alerts are more consistently shaped patterns.
You'll notice the edges of our patterns will change colors when time measurements are met. This will insure that the patterns you are looking for are more consistently shaped. The way we see things, the bars that make up the patterns are like support columns in a high rise apartment building. Too few, and your building won't stand. If you have more support columns on one side of your building than the other, chances are it will fall over. With the patterns we want to see the same consistency which is why we look for time. This makes sure we have enough support columns and they are distributed the way it should happen.
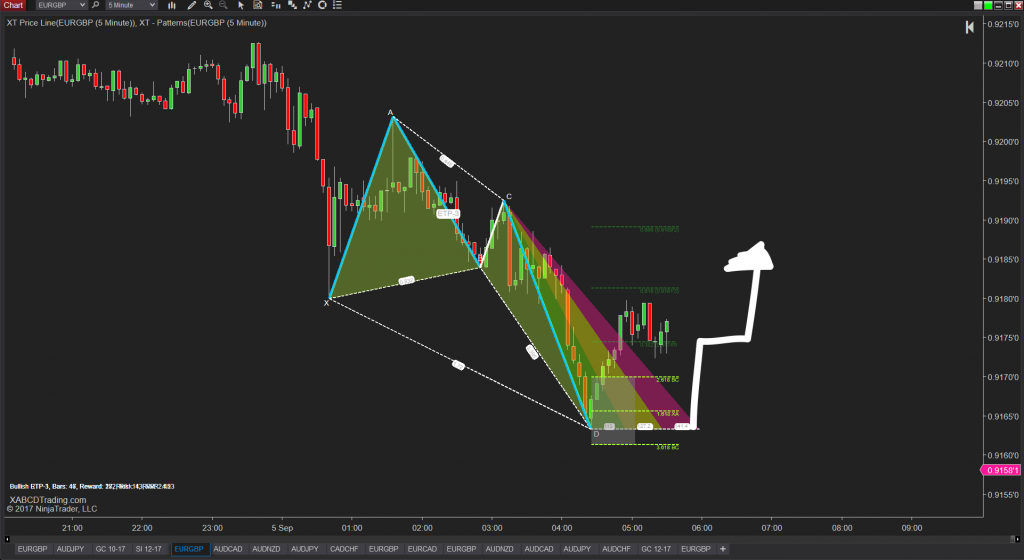
Using Time with Patterns and Diminishing Probability
In addition, time will help you solve problems. For example, when a pattern gets triggered, do you believe the probability of your trade working out remains constant forever? I highly doubt you would feel that way, and the reason is because as time goes on new information is added to the market. Since the market is ever changing, then we need to take into consideration that new information being added.
With this in mind, it would make sense that any point you try to forecast a future event, your probability diminishes over time. When a pattern gets triggered we use zones to represent how long a pattern is valid. These zones are based off Fibonacci time measurements are are represented by green, yellow and red colors. Once price ends up in the red - you're basically looking at your probability being a coin flip. For a deeper dive into this topic we published a video called The "Red Zone" with XABCD Patterns and highly recommend giving that a watch.
Mastering Risk Management with XABCD Patterns
XABCD patterns are the secret weapon for managing risk in trading. Let's break down why these patterns are a game-changer:
Clear Entry and Exit Points
XABCD patterns give traders a roadmap for entering and exiting trades. With well-defined levels, you know exactly when to jump in and when to step out. It's like having a treasure map in the market!
Risk vs Reward in Trading Patterns
Risk-Reward Rockstars: XABCD patterns are all about rocking the risk-reward ratio. You can have the scanner only alert you to patterns with better risk vs reward levels. This will save you tons of time since the patterns are prefiltered this way.
XABCD Patterns and Risk Busting
Moreover, XABCD pattern trading comes with a toolkit of risk-busting techniques. Position sizing, stop-loss orders, and trailing stops are your secret weapons. They shield your capital from potential losses and help lock in profits.
Nevertheless, XABCD patterns give you a leg up in managing risk. With clear entry and exit points, double-checked patterns, risk-reward rockstars, practice sessions, and risk-busting techniques. You'll be trading with confidence and keeping risk at bay. Get ready to unlock risk management like a pro!
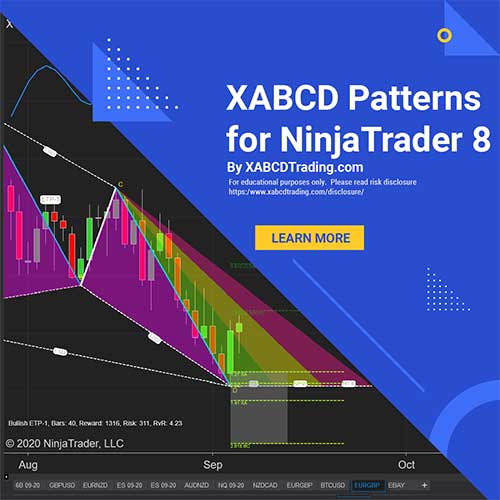
What Indicators are Recommended to Draw XABCD Patterns?
The XABCD Pattern Suite for NinjaTrader 8 is what we have created and built. It supplies traders with a huge advantage to save time in their trading day by allowing them to find and discover patterns automatically.
- Automatically draws on XABCD Patterns.
- Scans in real time any markets, time frames or charting styles.
- Full set of drawing tools.
- Workspaces, templates and audio alerts all included.
- Community, education, live streams, everything you could possibly need.
Want to Learn More About XABCD Patterns?
That is what our membership is for, to answer the "how" questions. This page is to show you "what" the patterns. The next step is learning how to use them. That is something you can explore or we can certainly help you shortcut the learning process with our educational resources. Our Education Center is a great place to start as well we encourage you to participate in our live streams.