XABCD TRADING
Candlestick Patterns and Their Biggest Problems
Subscribe
to get alerts to our next blog post!
Biggest Problems with Classic Candlestick Patterns
There are two types of candlestick patterns. The first type is your classic candlestick patterns, the second are our XABCD patterns. When we talk about candlestick patterns that have problems, we're talking about the classic patterns. These are your problem patterns:
- cup with handle
- double bottoms/tops
- saucers
- head and shoulders
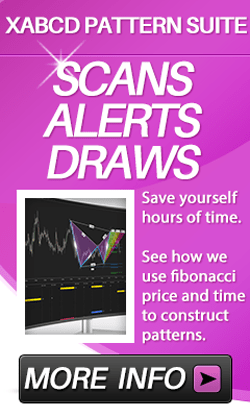
- triangles
- flags
The Problem With Classic Patterns
Very Little Consistency in Shape and Size
When you trade classical chart patterns like the head and shoulders or cup and handle, these patterns have shape but they are not very consistent when most traders find them. That is because there are no measurements that show you which shape is valid vs invalid.
Most charts that do measure patterns do so using price but they fail to use time as a measurement guideline.
The Way XABCD Patterns Fix The Inconsistencies
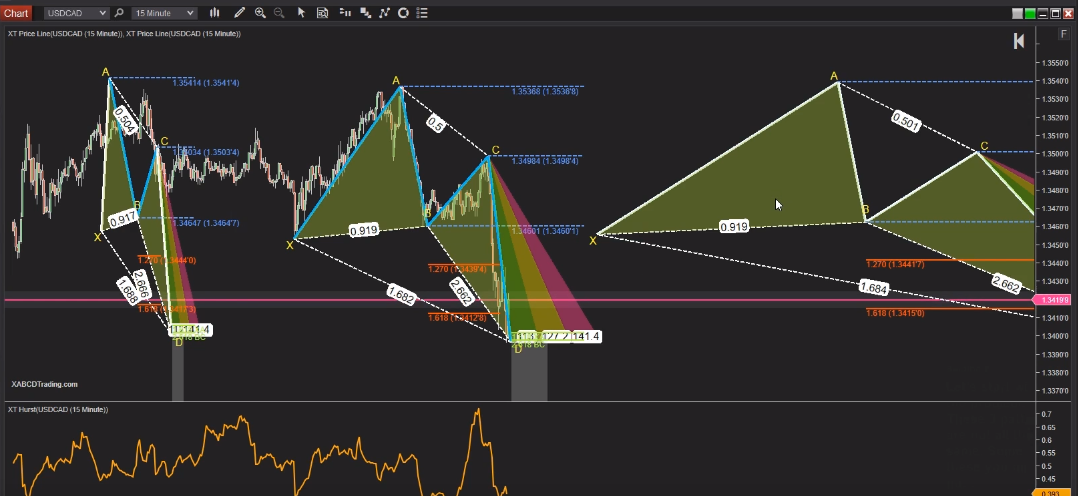
In this video you will see 3 patterns shown, all with the same price ratios - however they do not use "time" measurements.
Most charts that do measure patterns do so using price but they fail to use time as a measurement guideline.
The Classical Chart Problem Demonstrated
See More: XABCD Candlestick Patterns
How fast or slow price moves to complete pattern points or the pattern as a whole is critical. Think of an elevator that moves at different speeds and how your emotions would change if your in a controlled decent or free falling.
The faster the rise or fall, the stronger the emotions. Being able to measure this and the time it takes will be critical when looking to improve your consistency.
The Blue Edges (Outline) of A "XABCD" Pattern
If you look at the image above you'll notice in our XABCD Patterns the outline of the pattern is made of pure blue outlines or some mix of blue and white outlines. These are the time measurements and you would want the outline of the pattern to be all blue.
When you meet your time ratios and every pattern has all blue outlines you'll benefit from knowing that your patterns are more consistently shaped. This makes it at lot easier to make your adjustments and changes to monitor what sort of effect it has on your trading while keeping your trades as consistent as possible.
The Future of Chart Patterns In The Markets
As the popularity of chart patterns rise, the inconsistencies of classical patterns are recognized and more traders are looking for solutions. XABCD Patterns are positioned to solve this problem by measuring these patterns using both Fibonacci time and price. This has been validated by the breakout growth we've seen in our XABCD Pattern Suite users.
New NinjaTrader Articles Delivered First

Easy Order Tool
The Strategy


Scanning & Alerting

NinjaTrader Release
XABCD News (Free Version)
XABCD News (Community Edition) is the best free Indicator for NinjaTrader 8. Don't let news sneak up on you again. Puts economic news events on your charts so you can stay informed and move around positions/stops before the news is released. Works in any market.
XABCD Priceline (Free)
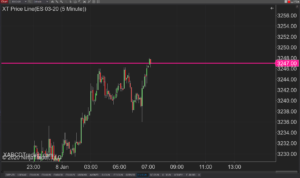
XABCD Price Line tool for NinjaTrader 8 will draw a line at current price and move every time the market changes price. This is useful because it will allow you to easily identify where price is at all times and the exact quoted price.
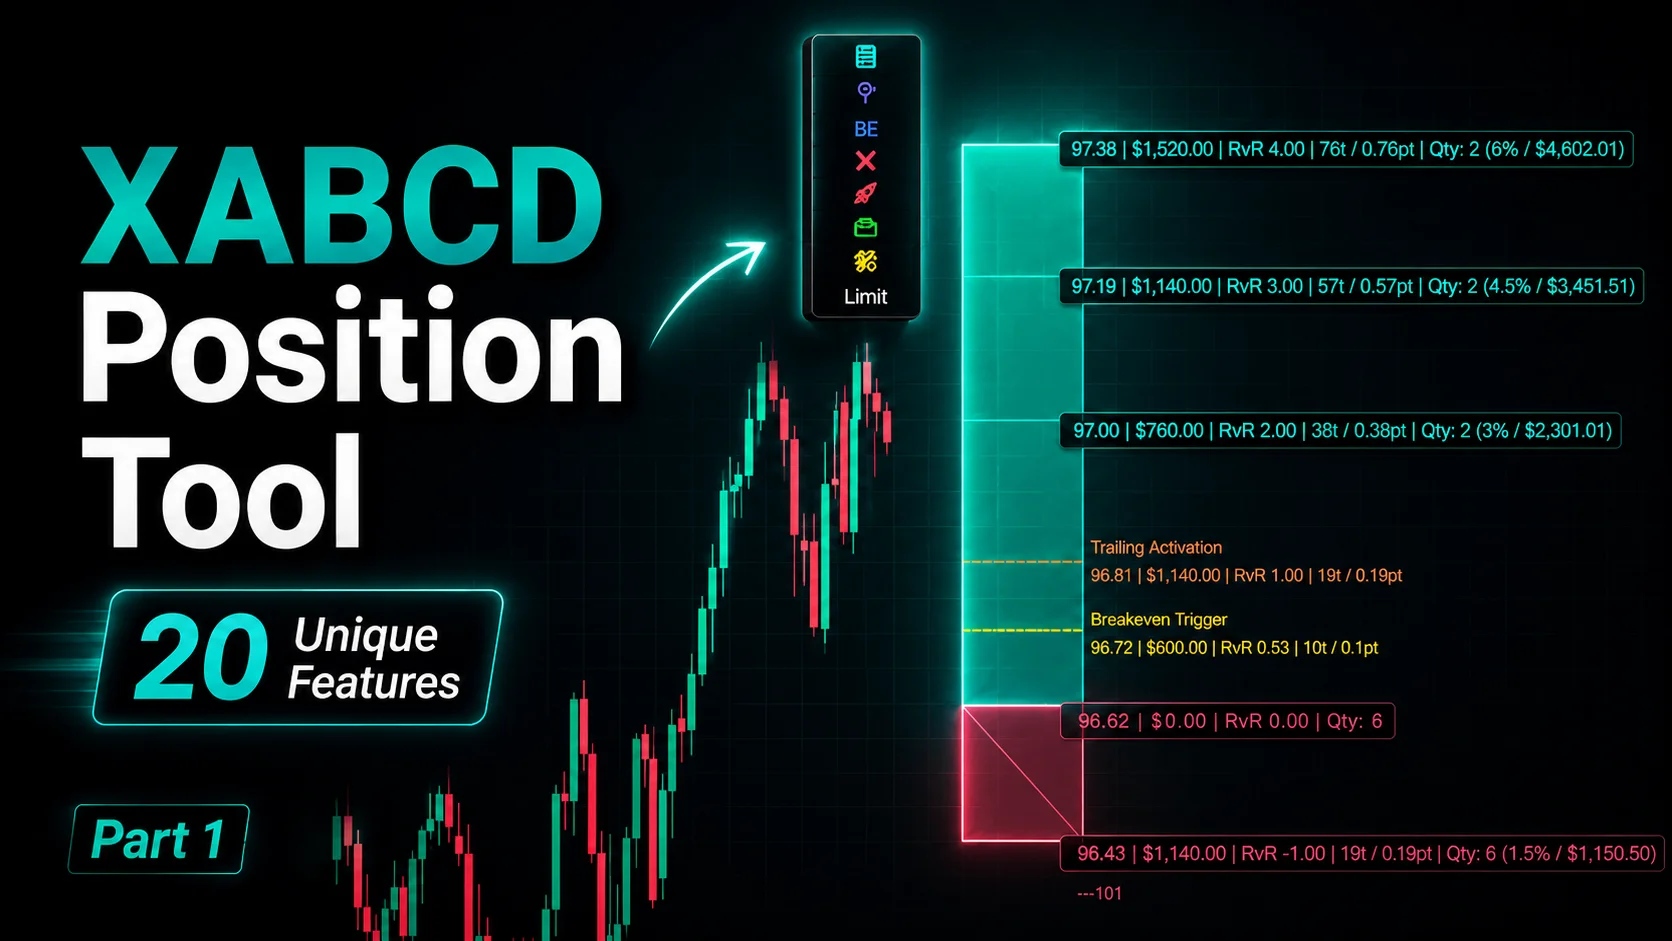
NinjaTrader Position Sizing Tool: 64 Features Stock NT8 Does Not Include
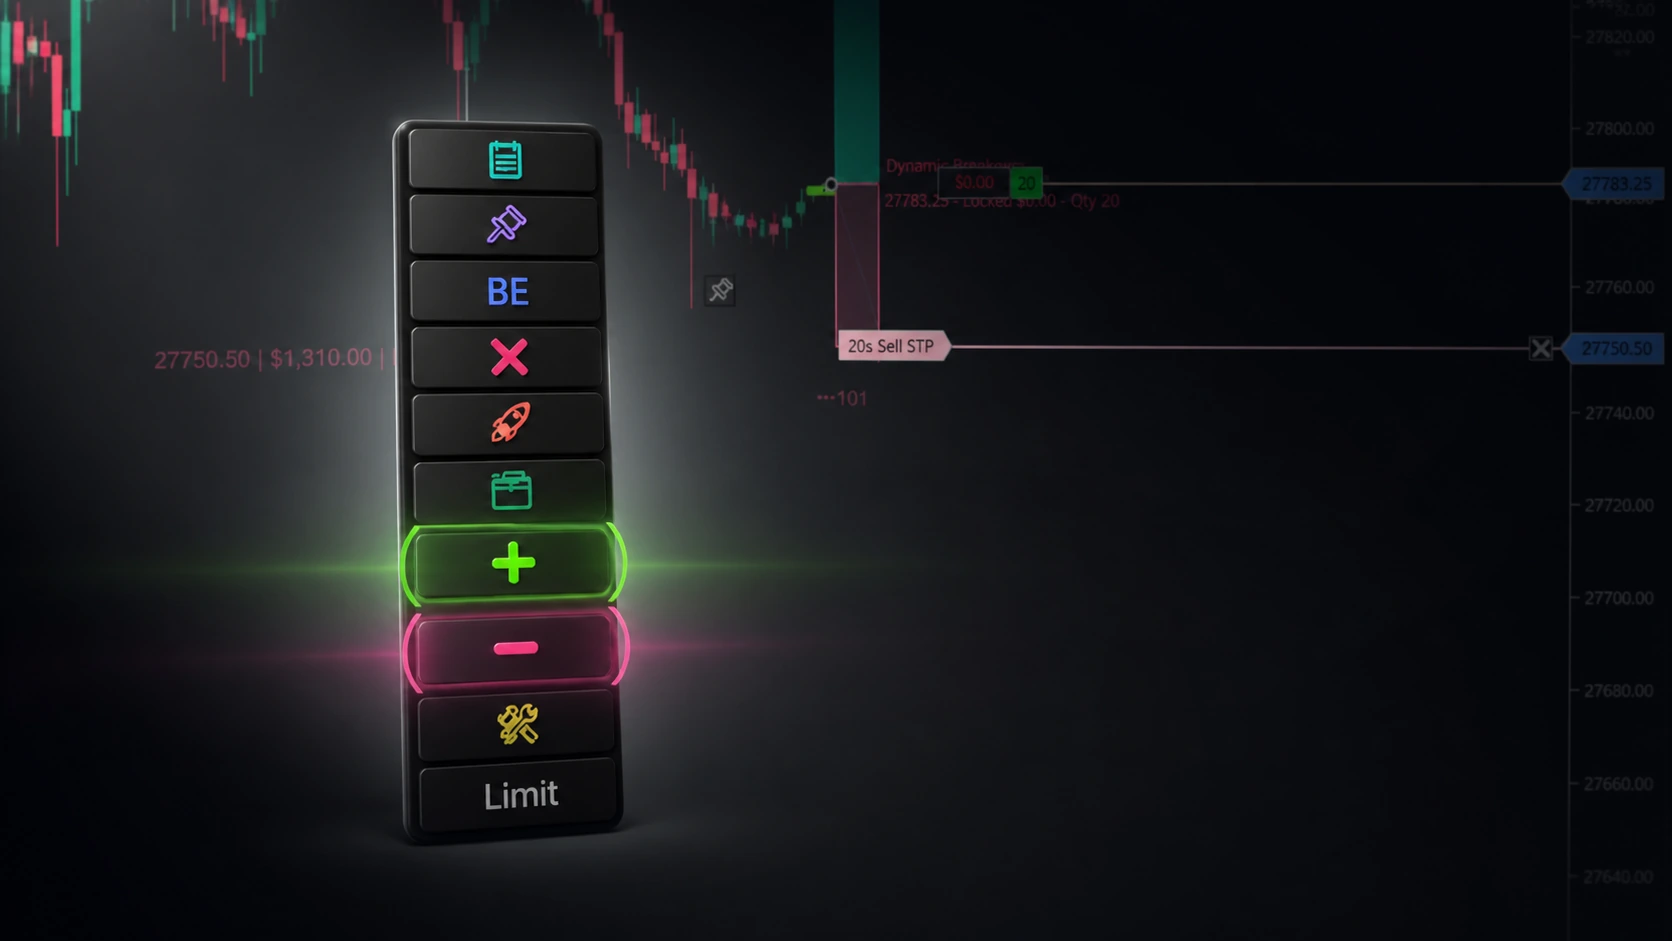
NinjaTrader – Adding to Position: A Field Guide for Active Traders
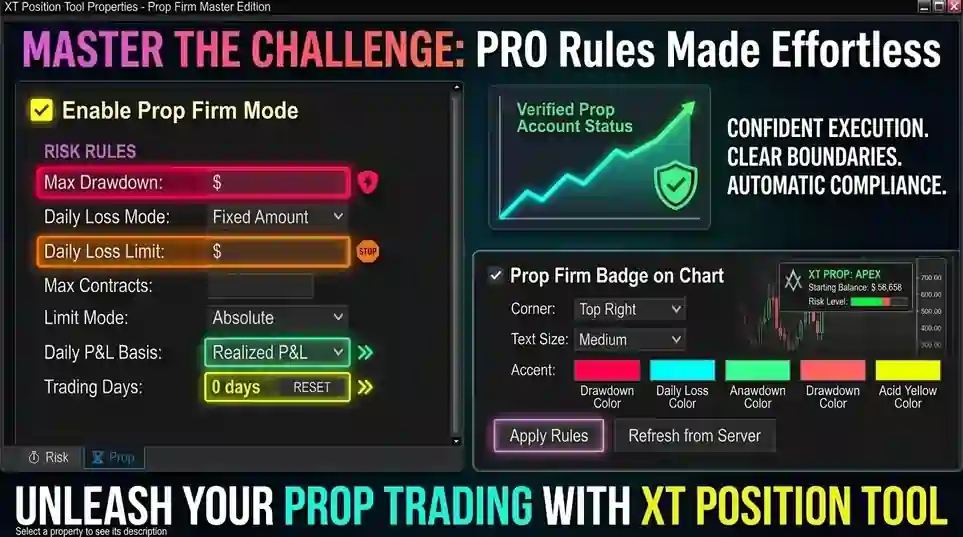
NinjaTrader Prop: The Ultimate Guide to Prop Firm Trading
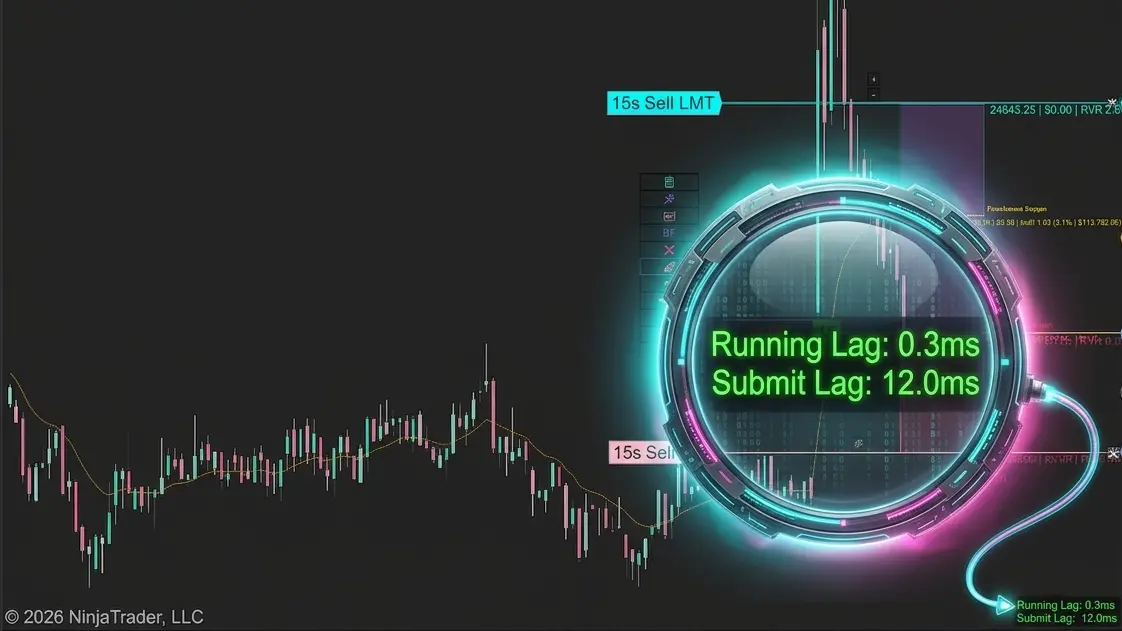
Does the XABCD Position Tool Lag?
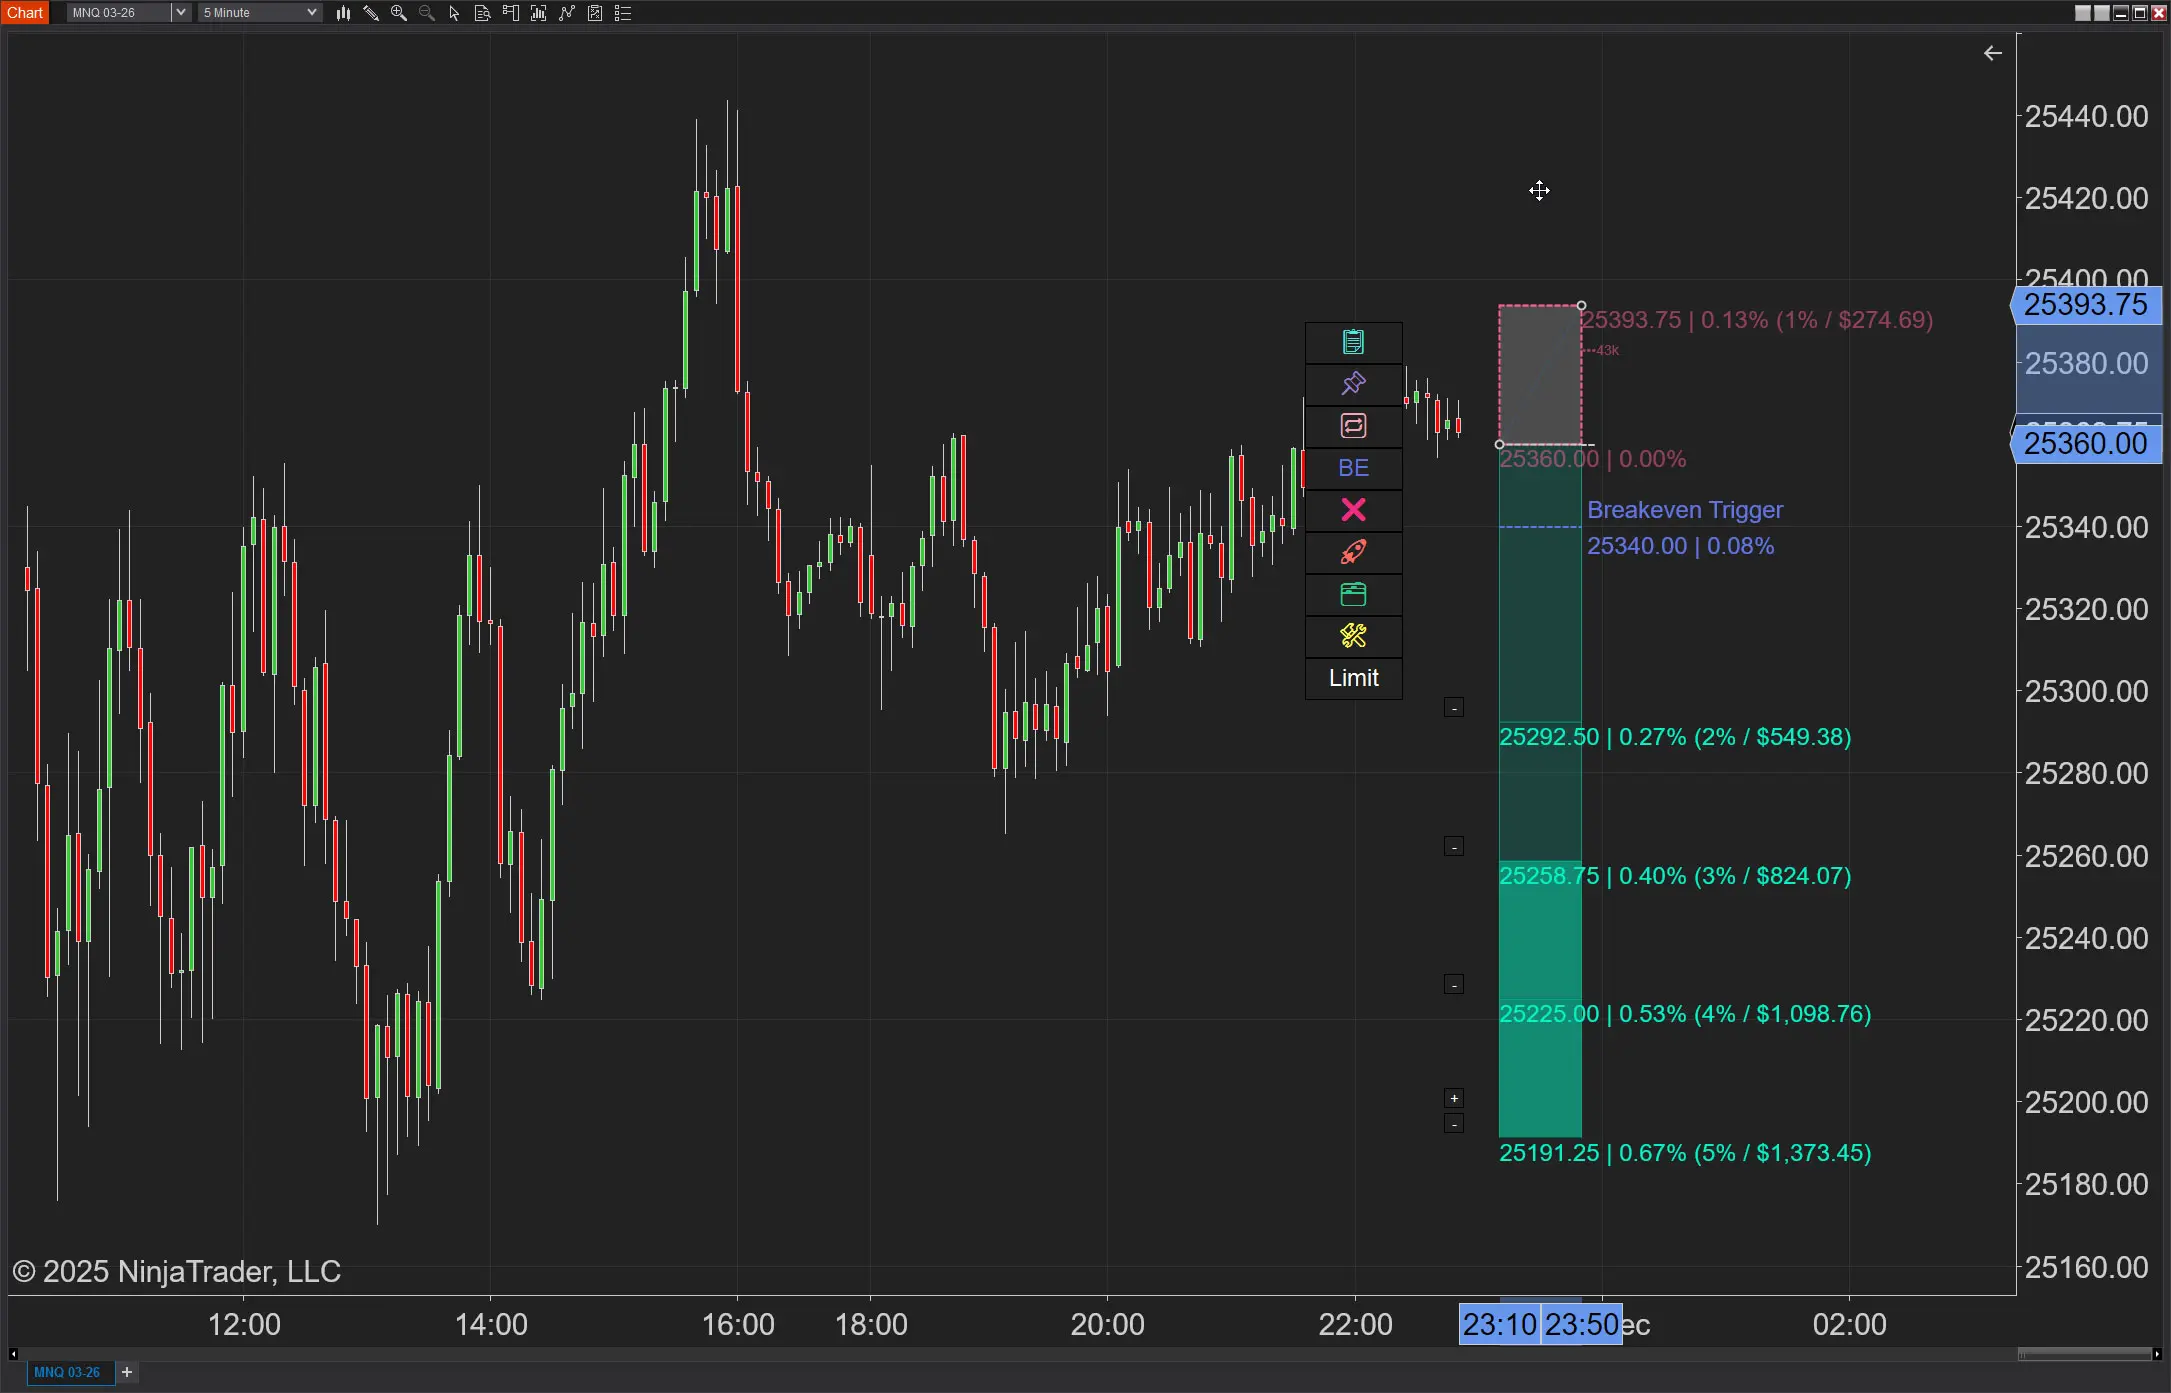
NinjaTrader Position Sizing: What the XABCD Position Tool Can Do That ATM’s Can’t
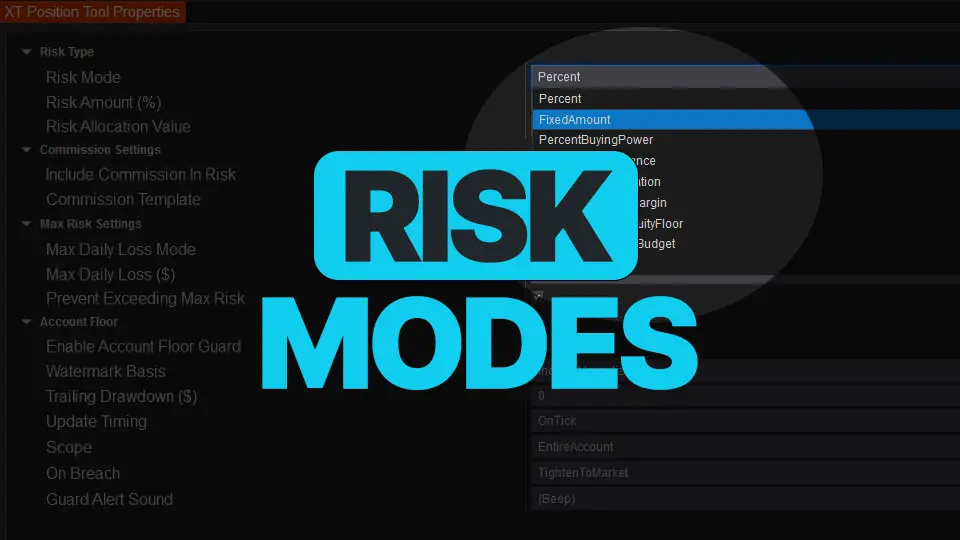
NinjaTrader Risk Management That Actually Moves the Needle
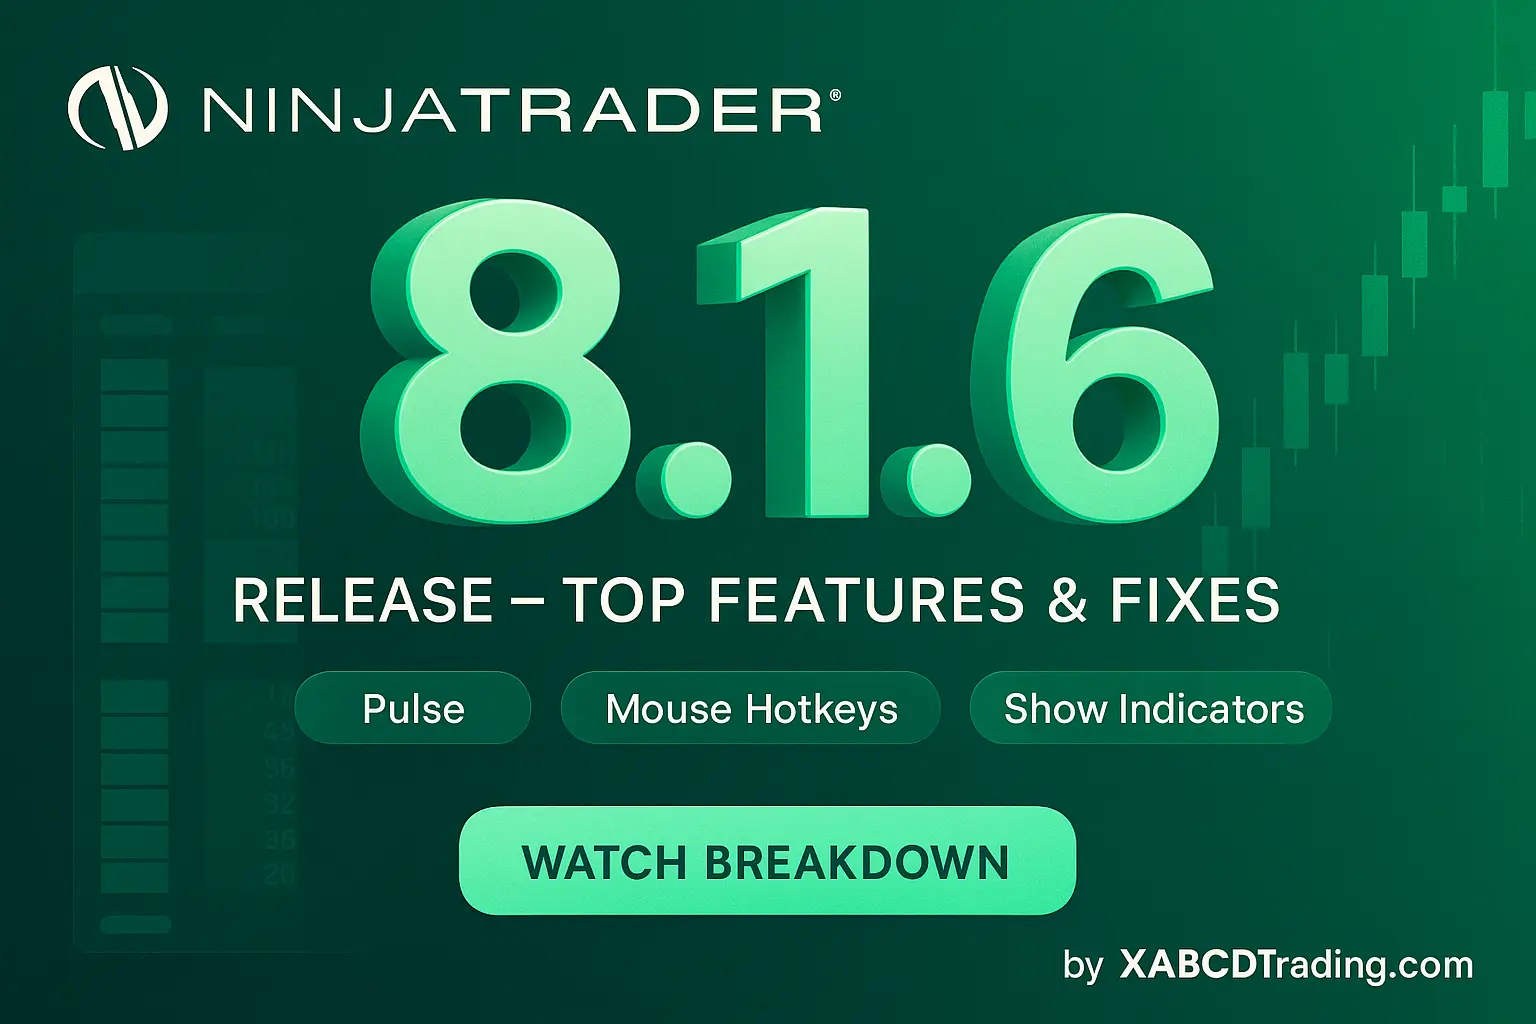
NinjaTrader 8.1.6 — The “No Fluff” Tour (Speed, Clarity, Fewer Clicks)
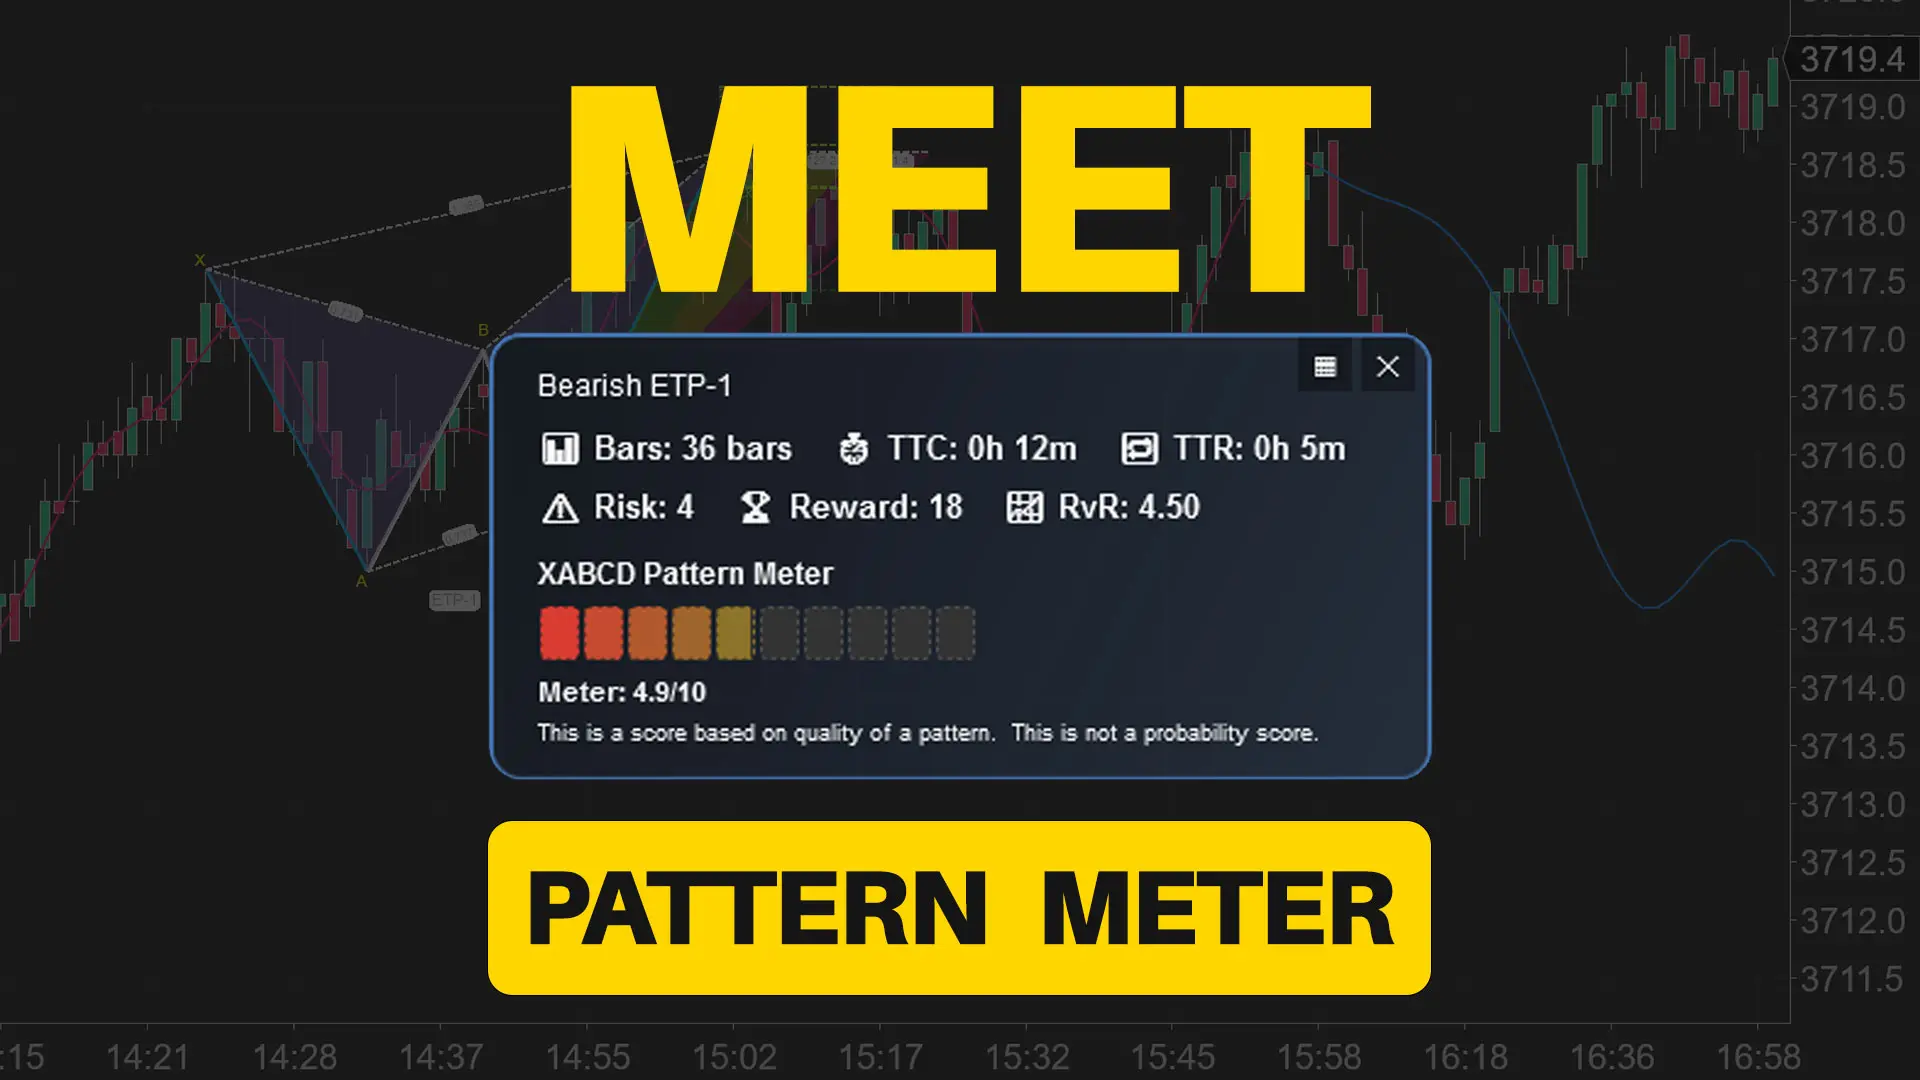
Meet the XABCD Pattern Meter (Real-Time Clarity)
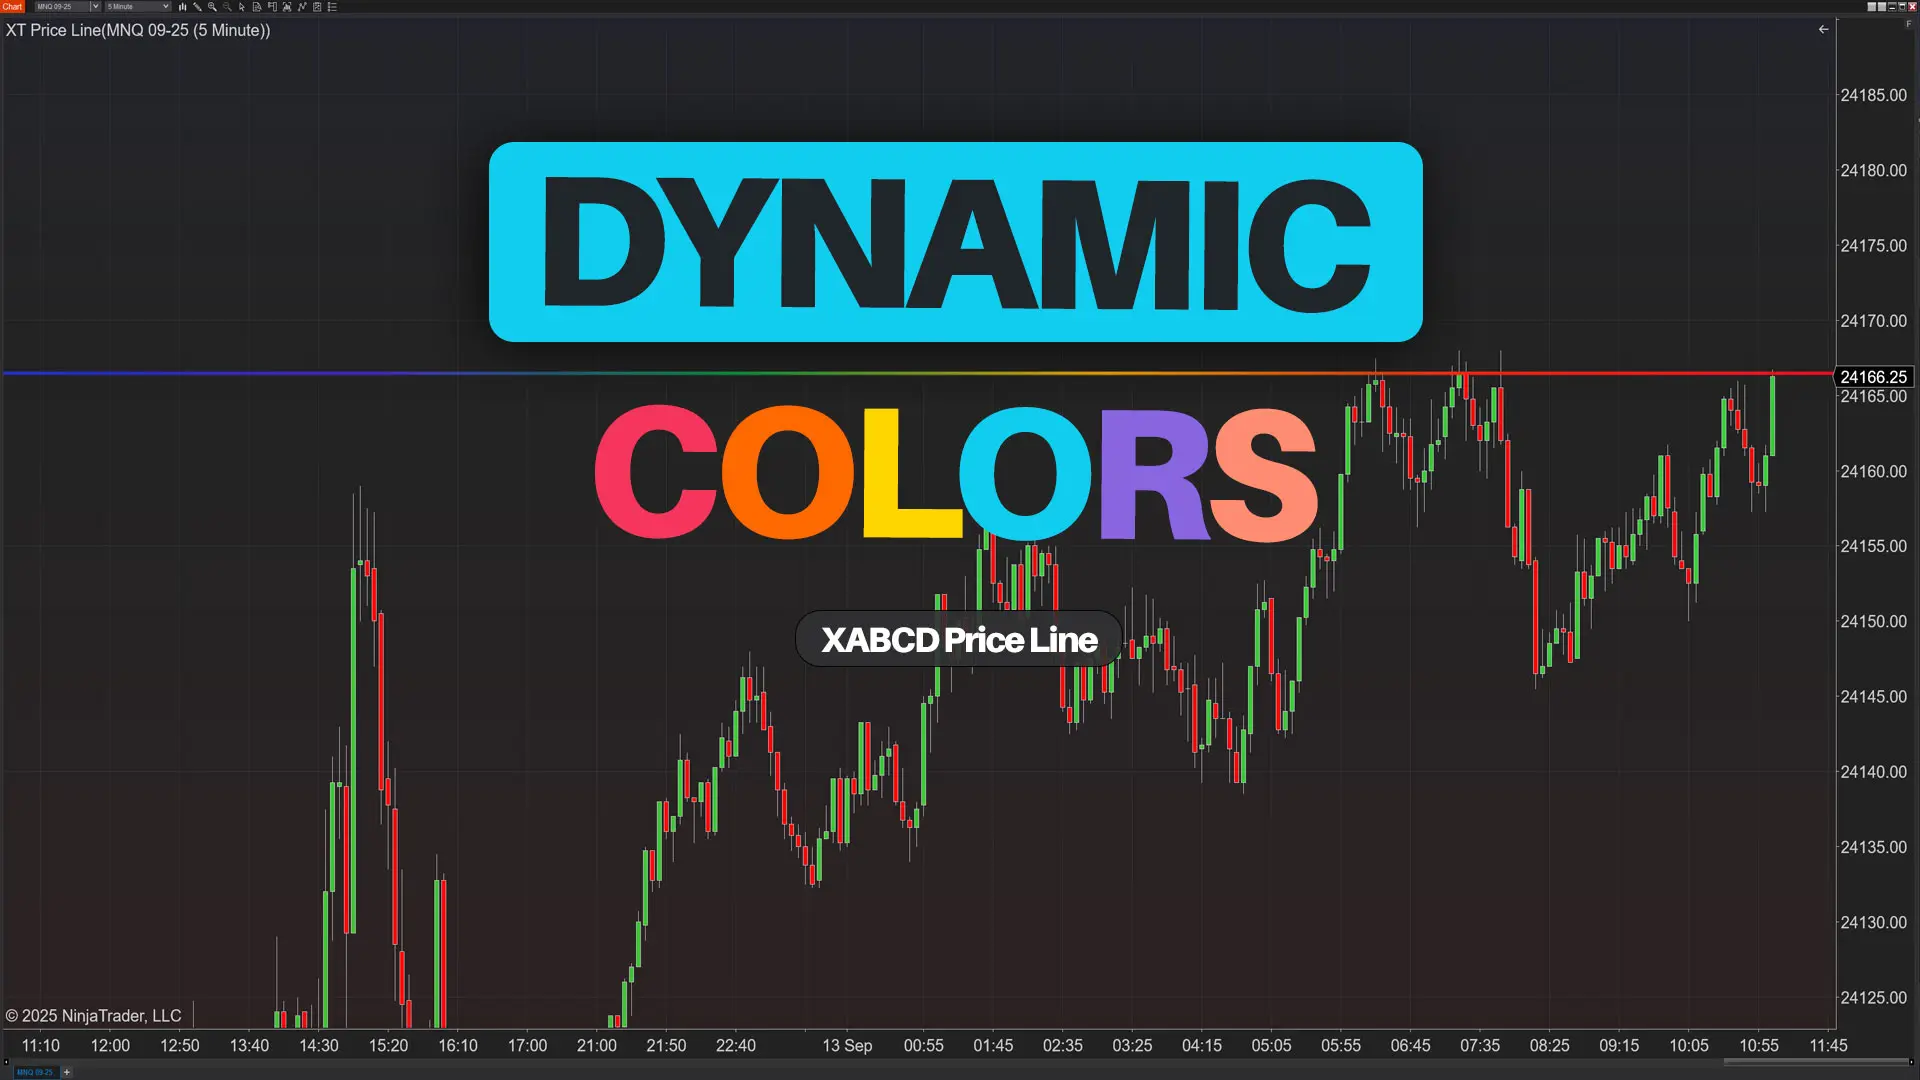
XT PriceLine: Dynamic Colors That Let You See Every Tick