XABCD TRADING
Drawing XABCD Patterns Automatically or Manually?
Subscribe
to get alerts to our next blog post!
Scanning Automatically vs Drawing XABCD Patterns Manually
Scanning patterns automatically vs manually is going to be a choice for each trader. The good news is the software we produce for NinjaTrader 8 will give you the flexibility to do it how you chose.
Let's look at the pro's and con's of each.
Advantages of Automatic XABCD Pattern Detection
Detect Large Quantities of Patterns
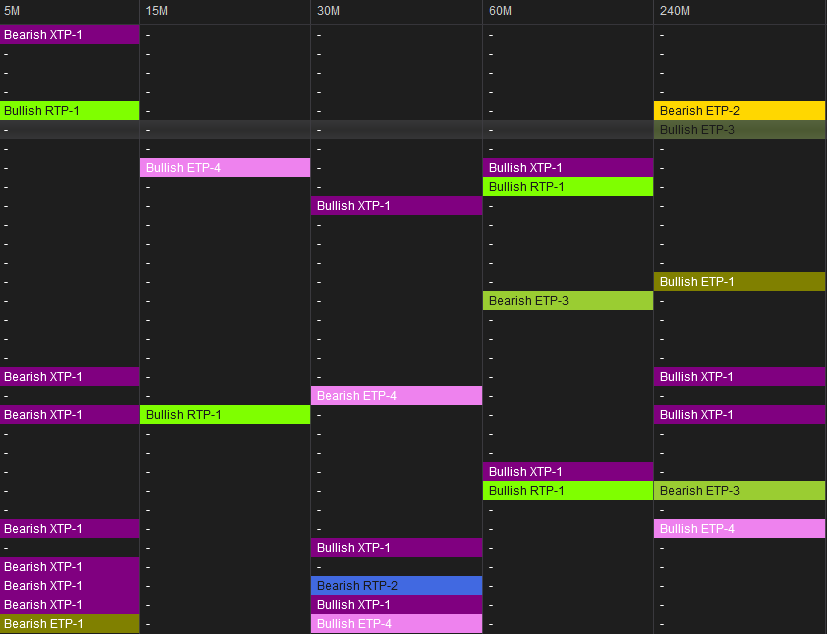
With over 1200 patterns a day being detected by our software makes it very easy to draw XABCD patterns automatically. If your time is worth anything to you (which we imagine it is) this would be the only way to set yourself free from your desk and alert yourself through email or some loud audio alerts when your attention is needed. Below you will find a video on how a scanner like this would work in detecting patterns.
Find Patterns Easily - Ones Your Eyes Might Miss!
When you scan patterns automatically, anything that fits the rules gets listed and alerted. This means even patterns your eyes never would have found before on their own.
A lot of times it's also not possible to watch as many instruments as you are scanning. Lots of providers will allow you to scan up to 200 instruments which is a lot of work for your eyes. Doing it automatically makes it so much easier.
Requires Less of Your Attention
If you have a busy life, scanning patterns automatically will help you with saving you so much time. You can do this through the NinjaTrader Market Analyzer - or through our web based scanner for XABCD Patterns. You'll probably also want to use longer time frames rather than short ones and trying to fit them in between times where your occupied.
Advantages of Drawing XABCD Patterns Manually
Qualified Patterns Only Are Visible
When you scan patterns manually, you'll pick the high's and low's your eye first sees. These are usually the most obvious reversals which is great pattern points to see for your XABCD Patterns. This subset of patterns will leave you with more qualified patterns and you'll dismiss less of them as they will be more favorable.
Ability To Find Patterns That Are Close in Ratios
As you're drawing the patterns using our Responsive Drawing Tools, you'll see the color change from "Grey" to a color that represents the pattern. It's really neat because you don't need to validate each pattern by their ratio numbers but instead just wait for the color to change so you know the pattern is valid.
This is important because as you draw the patterns you'll notice as you move your mouse a little higher/lower you can see patterns that would be valid that might be a pip or two off that the software didn't pick up. So using the drawing tools, sometimes you'll find patterns that validate with these little small changes.
So Where Does This Leave Us?
The automatic way, and the manual way of finding and drawing XABCD patterns both have their unique purposes. If you can use them both at once, that is going to be the best way. You'll be able to see what is being scanned as well as draw what your eyes might see.
Frequently Asked Questions
How do you start drawing XABCD patterns on a chart?
To start drawing XABCD patterns, first identify a significant swing point labeled X, then locate the next opposing swing point labeled A. From there, plot the B, C, and D legs by measuring Fibonacci retracement and extension levels between each successive swing. Most charting platforms offer built-in XABCD pattern tools that snap to price pivots and automatically display the relevant Fibonacci ratios.
What Fibonacci ratios are used in XABCD patterns?
XABCD patterns rely on specific Fibonacci retracement and extension ratios between each leg, such as 0.382, 0.500, 0.618, 0.786, 1.272, and 1.618. The exact ratios required depend on the specific pattern type, such as a Gartley, Butterfly, Bat, or Crab. Correct ratio alignment is what distinguishes one harmonic pattern from another and validates the trade setup.
What is the difference between a Gartley and a Butterfly XABCD pattern?
The main difference is in the Fibonacci ratios and where the D point completes relative to X. In a Gartley pattern, the D point completes at the 0.786 retracement of the XA leg, staying within the XA range. In a Butterfly pattern, the D point extends beyond X, typically reaching the 1.272 or 1.618 extension of the XA leg.
Can software automatically help with drawing XABCD patterns?
Yes, many trading platforms and third-party indicators can automatically detect and draw XABCD patterns by scanning for the required Fibonacci relationships between swing points. Tools like those available in TradingView, MetaTrader, and specialized harmonic pattern scanners can save time and reduce human error. However, traders should still manually verify that the ratios and structure align with valid harmonic pattern rules.
What are common mistakes when identifying XABCD harmonic patterns?
Common mistakes include forcing a pattern onto the chart when Fibonacci ratios do not closely match the required values, mislabeling swing points, and ignoring the overall market context or trend. Another frequent error is not waiting for the D point to fully complete before entering a trade. Precision in ratio measurement is critical because even small deviations can invalidate the pattern.
Frequently Asked Questions
How do you start drawing XABCD patterns on a chart?
To start drawing XABCD patterns, first identify a significant swing point labeled X, then locate the next opposing swing point labeled A. From there, plot the B, C, and D legs by measuring Fibonacci retracement and extension levels between each successive swing. Most charting platforms offer built-in XABCD pattern tools that snap to price pivots and automatically display the relevant Fibonacci ratios.
What Fibonacci ratios are used in XABCD patterns?
XABCD patterns rely on specific Fibonacci retracement and extension ratios between each leg, such as 0.382, 0.500, 0.618, 0.786, 1.272, and 1.618. The exact ratios required depend on the specific pattern type, such as a Gartley, Butterfly, Bat, or Crab. Correct ratio alignment is what distinguishes one harmonic pattern from another and validates the trade setup.
What is the difference between a Gartley and a Butterfly XABCD pattern?
The main difference is in the Fibonacci ratios and where the D point completes relative to X. In a Gartley pattern, the D point completes at the 0.786 retracement of the XA leg, staying within the XA range. In a Butterfly pattern, the D point extends beyond X, typically reaching the 1.272 or 1.618 extension of the XA leg.
Can software automatically help with drawing XABCD patterns?
Yes, many trading platforms and third-party indicators can automatically detect and draw XABCD patterns by scanning for the required Fibonacci relationships between swing points. Tools like those available in TradingView, MetaTrader, and specialized harmonic pattern scanners can save time and reduce human error. However, traders should still manually verify that the ratios and structure align with valid harmonic pattern rules.
What are common mistakes when identifying XABCD harmonic patterns?
Common mistakes include forcing a pattern onto the chart when Fibonacci ratios do not closely match the required values, mislabeling swing points, and ignoring the overall market context or trend. Another frequent error is not waiting for the D point to fully complete before entering a trade. Precision in ratio measurement is critical because even small deviations can invalidate the pattern.
Still have a question about this?Ask the XABCD team in Live Chat and get help with your setup.Ask in Live Chat →
Be the First to Read New Articles
Free tutorials, fixes and setup guides by email.
Free tutorials, fixes and setup guides by email.
Recommended Tool
XABCD Pattern Suite
Spot XABCD patterns on your NinjaTrader 8 charts.
See the Pattern Suite →
Recommended Video

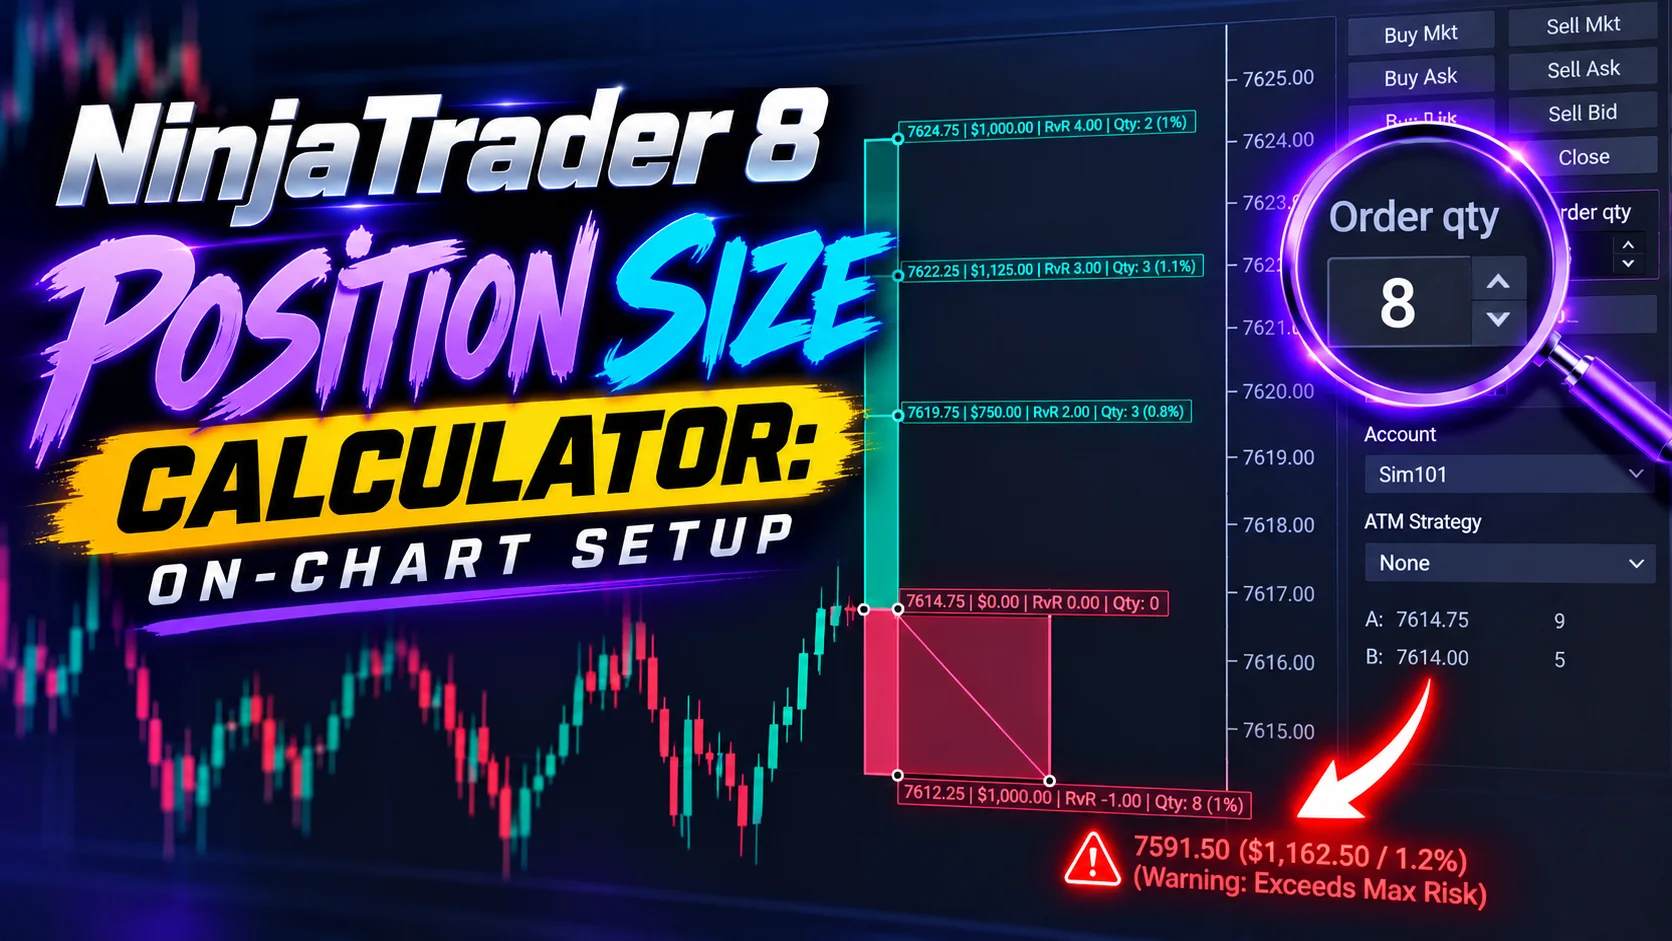
Ditch NinjaTrader ATMs: This Is More Powerful
See how to set your risk and calculate contracts directly on the chart.
Watch Now
Subscribe on YouTube
Related Tool
XABCD Pattern Suite
Spot XABCD patterns on your NinjaTrader 8 charts.
See the Pattern Suite
Why XABCD Trading
- Built for NinjaTrader 8 since 2009
- Trusted by 2,000+ traders
- On-chart tools, no ATM templates needed
- Free tools to get started

Get Project Updates
Twice-monthly maximum, we will give you updates on all the projects going here.
Quick Links