XABCD TRADING
Pattern Trading Unveiled: Exploring M and W Pattern Trading
What Are M and W Patterns in Trading, and How Do They Form?
M and W pattern trading is done when price action has created a shape on your chart that looks like the letter "M" or the opposite, the letter "W". They should be pretty obvious looking too with clear price movements and changes in direction as shown in the example below.
Some people will also see these and think of a double-top and double bottom which can also be a sign as the peaks in the letter M or W would look like a test (and re-test) of an area of support or resistance.
Before trading was all done electronically, people used to map out these patterns using a ruler. Times have changed, now some of the most advanced pattern indicators that look at both time and price in m and w patterns can do this for you, and even alert you when new patterns have been found.
M Shaped Pattern - Bullish, showing a long potential setup.
W Shaped Pattern - Bearish, showing a short potential setup.
How are M/W Patterns different than XABCD Patterns?
- M and W Patterns look for chart patterns that have price action that looks like an M/W shape to them.
- XABCD Patterns look like the same W and M type structure but there are specific rules and ratios each pattern has to meet. These rules happen both using time and price together to form a pattern.
Give Me A Full M and W Pattern Trading Strategy!
This video goes over all of that in less than 2 minutes! We cover the entry, stops and targets while using the patterns to determine a strategy that you can consistently execute the same way.
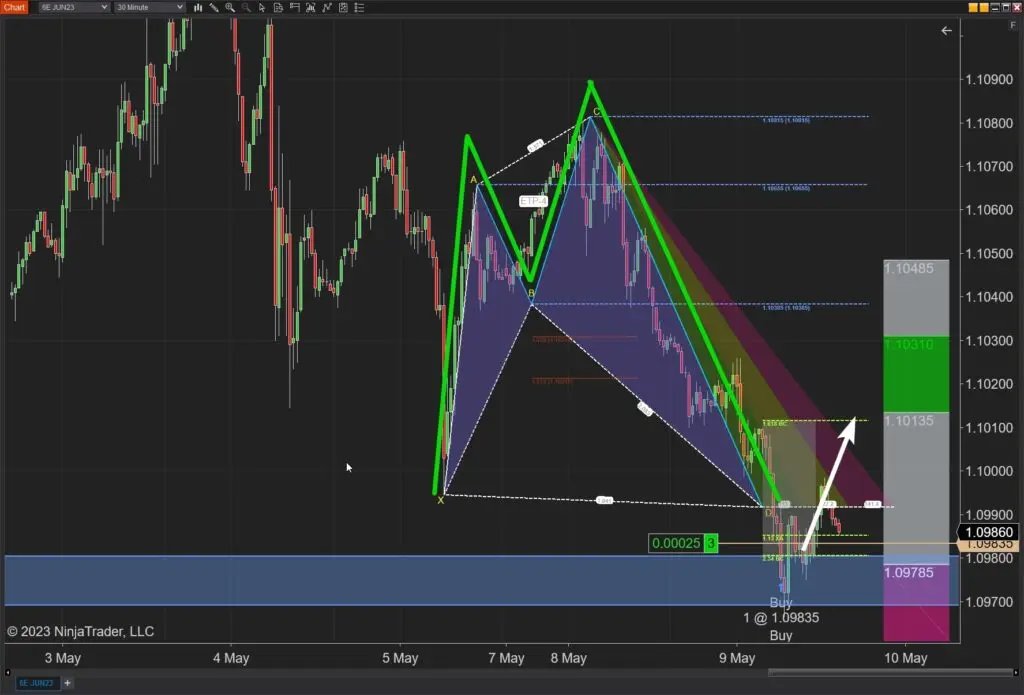
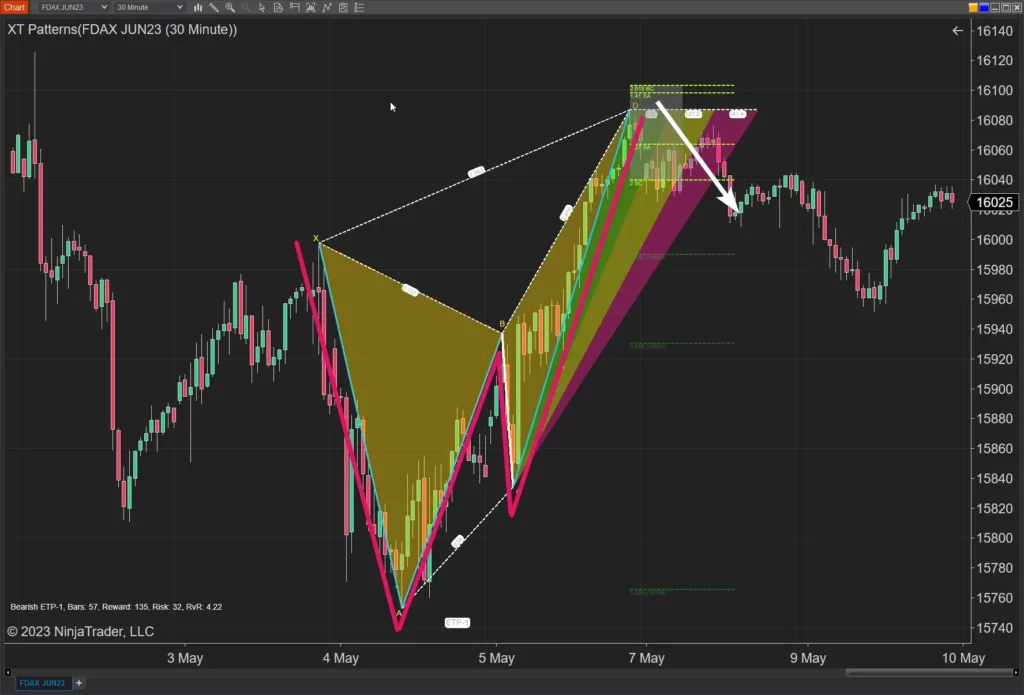
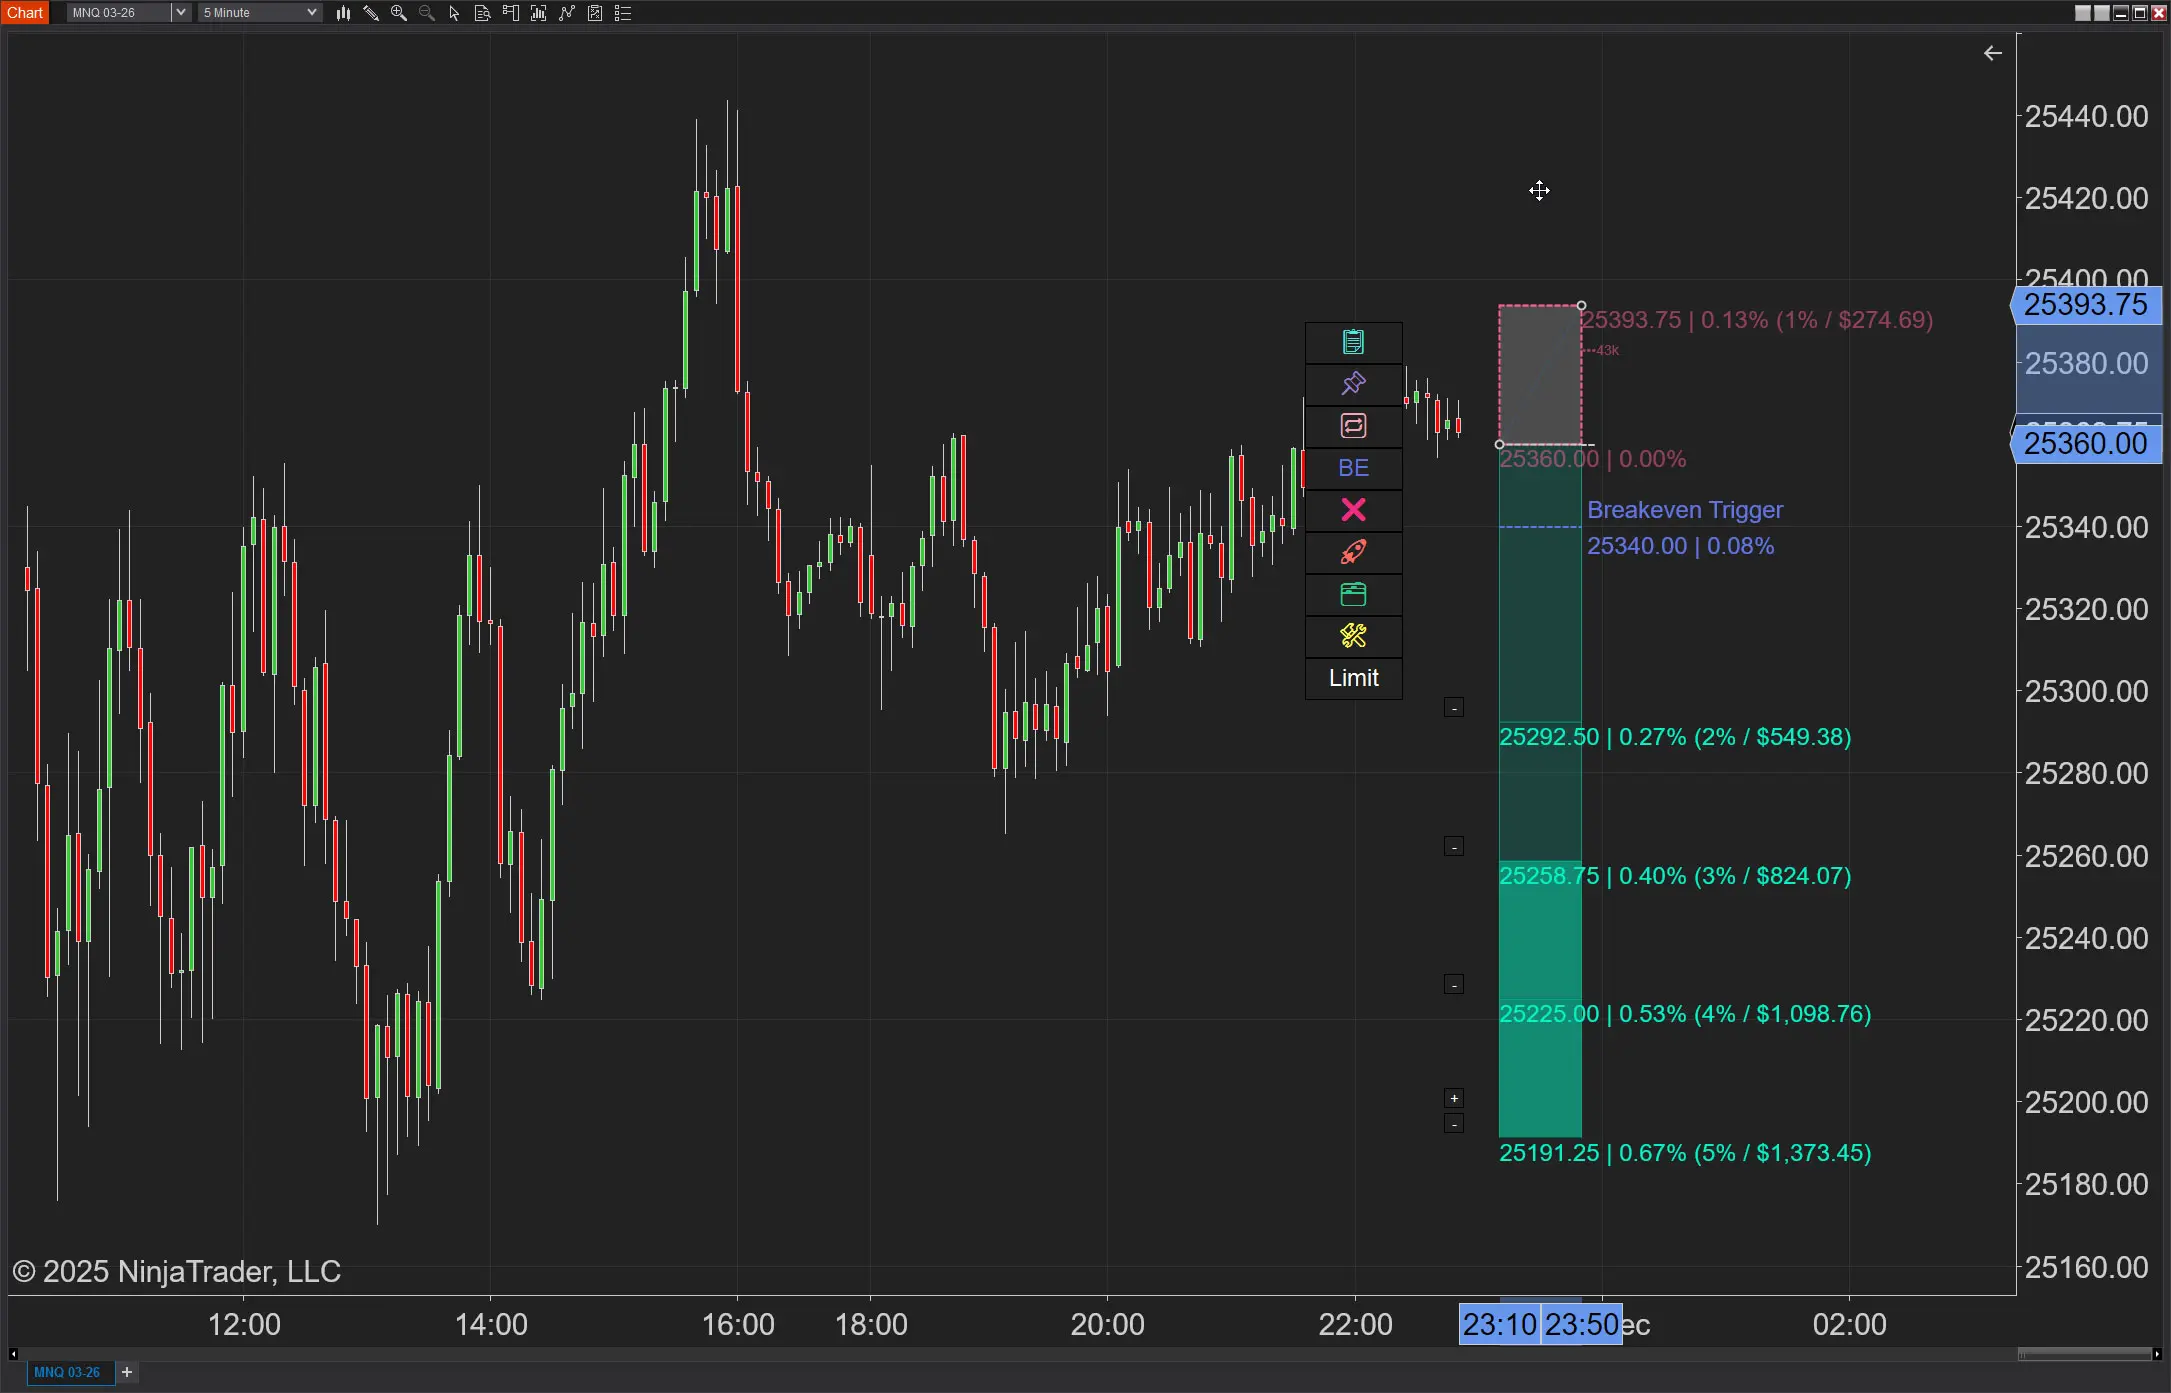
Each pattern is made up of 4 leg segments. WIthin those leg segements, each M or W shaped pattern is identified by 5 points which are labeled as X-A-B-C-D. The D point which is the furthest to the right will identify the direction you will trade. If the D point is down low (m pattern), you would be looking for a long position. If the D point is up high (w pattern), you will be looking to short the market.
The grey area will show you the height of where you can get in at any point, and the green, yellow and red zones show you how much time you have before your ability to forecast goes down the drain. So anywhere inside is valid for the entry.
As for a stop, a stop outside of the grey box would be valid which means your pattern has failed, and your pattern points (B, C and A) could also be used for targets.
This is a very general way of trading these patterns as our educational resources will show you alternative methods that will let you hone in on more specific areas.
Positives and Negatives M and W Pattern Trading
Pro's of Trading M & W Shaped Patterns
- Clear Reversal Signals: M and W pattern trading can provide clear signals for potential trend reversals on any time frame or market type.
- Defined Entry and Exit Points: Traders can use the reversal area as a guide for placing their trades, setting stop-loss levels, and determining profit targets.
- Favorable Risk-Reward Ratio: By identifying these m and w trading patterns, traders can define their risk by placing stop-loss orders near the pattern's high or low point, while targeting potential profits that exceed the risk taken.
- Versatility of Different Markets and Time Frames: M and W patterns can be applied across different markets and timeframes. Whether trading stocks, forex, commodities, or utilizing various chart intervals, these patterns can be adapted to different trading scenarios.
- Combination with Other Indicators: M and W patterns can be combined with other technical non-linear indicators and analysis techniques to strengthen trading strategies. Traders often use XABCD Sonar or XABCD Hurst to guide trendlines to validate the structures provided by by these patterns.
Cons of Trading M & W Shaped Patterns
- Human Error in Pattern Identification - However, Fixed by using the XABCD Pattern Suite and including time within the patterns: Identifying M and W patterns can be difficult to do manually since it does require a lot of precise rules all coming together at the same point in time. It's pretty common to see new traders to the patterns draw them in correctly and yet not even realize they are doing exactly that in their own trading.
- A Pattern Doesn't Mean A Trade: I think this is probably true to any strategy. Like any technical analysis tool, M and W patterns can generate false signals. Not every pattern will result in a successful reversal, and traders need to be cautious of the potential for pattern failures and market noise. An easy resolution to this would be to have an execution plan to follow.
How To Identify M and W Patterns on a Price Chart?
Using Indicators to Identify Chart Patterns
The easiest way to identify these patterns correctly would be to use the XABCD Pattern Suite software that can identify, alert and draw these right on the chart for you. Embracing technology, and using the XABCD Pattern Suite will enhances traders' ability to stay ahead of the game by leveraging cutting-edge tools to gain a competitive edge in identifying M and W patterns promptly and accurately.
Manually Identifying M and W Patterns
The easiest way to identify these patterns manually is to look for an M or W shape on the chart that would be made up of price bars. It should stand out and be very obvious to your eyes where you basically see it without any issues. To know what classification of XABCD Pattern you might have found, you would then need to go through each of the ratio rules for both price and time to see if you have found a valid pattern.
For most people, doing this manual validation can be too time consuming. When you do finally find one that fits the rules, you will really want to trade it regardless because of all the time you found looking for it. This is why most people very quickly decide to use software for accuracy of the drawing, but also for the time saving abilities.
If you want to break it down into steps, here is how I would suggest you do that in a few simple rules.
How To Trade: W Pattern Trading Rules
- Identify a downtrend which will be the top left point of the "W" pattern: Look for a prevailing downtrend in the price chart. This can be characterized by lower swing highs and lower swing lows.
- Locate a significant swing low: Identify a low point in the price chart that stands out and acts as a support level. This low should be followed by a price bounce.
- Observe the retracement: After the bounce, the price should retreat or retrace back towards the previous swing low but not breach it. This retracement is a crucial element of the W pattern.
- Confirm the reversal: Once the retracement is complete, observe the subsequent rally. The price should surpass the previous swing high, forming the middle peak of the W pattern.
- Identify the second retracement: After the middle peak, the price may decline again, forming the second retracement. This retracement should not break below the initial swing low.
- Confirm the pattern completion: Finally, look for the price to rally again, surpassing the previous swing high formed by the middle peak. This breakout above the previous high confirms the completion of the W pattern.
- Follow the ratios: Determine if your seeing an Retracement Time Pattern (RTP) or Extension Time Patter (ETP) pattern.
Remember that successfully doing W pattern trading requires practice, experience, and a comprehensive understanding of technical analysis. It's crucial to combine pattern recognition with risk management and trade management techniques, and consideration of broader market conditions for effective trading decisions.
How To Trade: M Pattern Trading Rules
- Identify an uptrend: Look for a prevailing uptrend in the price chart. This can be characterized by higher swing lows and higher swing highs.
- Locate a significant swing high: Identify a high point in the price chart that stands out and acts as a resistance level. This high should be followed by a price decline.
- Observe the retracement: After the decline, the price should rally back towards the previous swing high but not exceed it. This retracement is a crucial element of the M pattern.
- Confirm the reversal: Once the retracement is complete, observe the subsequent decline. The price should break below the previous swing low, forming the middle trough of the M pattern.
- Identify the second retracement: After the middle trough, the price may rally again, forming the second retracement. This retracement should not surpass the initial swing high.
- Confirm the pattern completion: Finally, look for the price to decline once more, breaking below the previous swing low formed by the middle trough. This breakdown below the previous low confirms the completion of the M pattern.
What Timeframes Are Best Suited for Trading M or W Patterns?
This is the best part of pattern trading. The time frame will only decrease or increase the length of time your in the trade. Each and every time-frame can be used to trade chart patterns, just like it can be used in any market. That is because what we are trading is human emotions and not an underlying instrument. This is also why the rules on a swing trade are the same on an intra day trade.
The time frame that will be best for you is another question. This will probably have a lot to do with your own lifestyle. Are you super busy where you can't watch the market and intra-day trading is not possible? or do you have a lot of screen time available where the shorter term trades are something you can handle?
The other thing to consider here is if your new to pattern trading. XABCD Patterns look like the M or W shape structure, but there can be a bit of learning to do with any strategy. Knowing how to execute your trade plan quickly might take some time so perhaps a higher timeframe while you learn might be a good thing to take into consideration.
What Are the Key Characteristics That Distinguish a Valid M or W Pattern from Noise?
There are many that we discuss as part of our training and education, but the most important characteristic that I'll tell you for beginners is going to be the start of the "M" or "W" shaped pattern that we identify as XACBD patterns as these are the 5 points of each turn in the shape.
Big Tip The "X" point is the start of the "W" or "M" shaped pattern and should have a clean and clear leadup into the X point (start of the pattern), with a pretty obvious pullback. You need to make sure that the lead up into the start of the pattern is obvious and not just "casual". Our XABCD Pattern Indicator for NT8 has this built in, as it will only find patterns that have an obvious enough "X" point to start off the pattern.
Do W Patterns Fail? What Happens?
There are many reasons why a m or w pattern can fail. Some of these can be avoided, others will just happen as part of the natural rhythm of the market. But we can learn a lot from failed patterns. Let's first discuss what could cause these patterns to fail?
What Causes Patterns To Fail?
News Releases - These can certainly cause patterns to fail. You can avoid some of these by making sure you're not entering a trade when a news event is released.
Insufficient Buying Pressure - Sometimes, the buying pressure following the second low point in the W pattern may not be strong enough to sustain a reversal.
Market Conditions - There can be times during low volume where the market can create sudden spikes. Patterns might not stick as easily if there are less market participants.
What To Do When A Pattern Fails?
First of all, understand its normal for patterns to fail. You're trading a system and not one particular pattern. If you can't afford to take a loss on any particular trade, then you should not be trading period. Always accept the fact that every pattern you trade could potentially lose.
The one thing we should all walk away with when a pattern fails, is that price is probably going to head in the direction that it failed for quite some time. This is a reason for us to stay out of the market until we get to the next trading opprotunity. This might mean waiting for the next area of support or resistance where the pattern lines up.
NinjaTrader Prop: The Ultimate Guide to Prop Firm Trading
If you’ve been exploring the world of futures trading, you’ve almost certainly stumbled across the concept of a NinjaTrader prop…
Chris
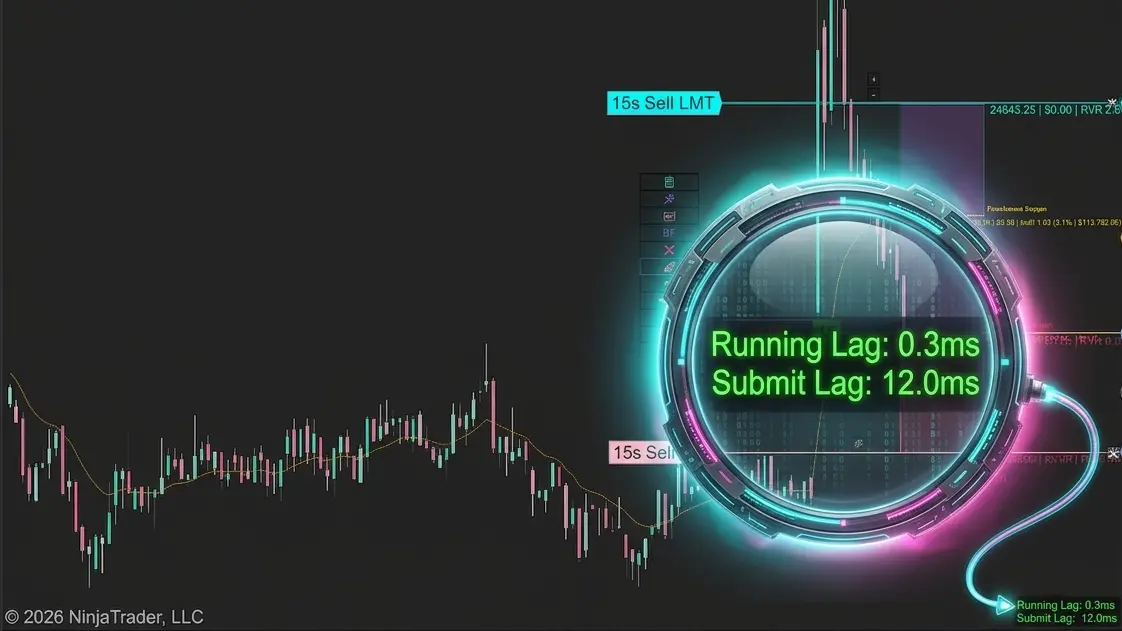
Does the XABCD Position Tool Lag?
Built You a Way to See It for YourselfWill the XABCD position tool lag used on fast-moving instruments or lower…
Chris
NinjaTrader Position Sizing: What the XABCD Position Tool Can Do That ATM’s Can’t
NinjaTrader position sizing is possible, but not through ATMs. Furthermore, no longer will you need to build NinjaTrader bracket orders…
Chris
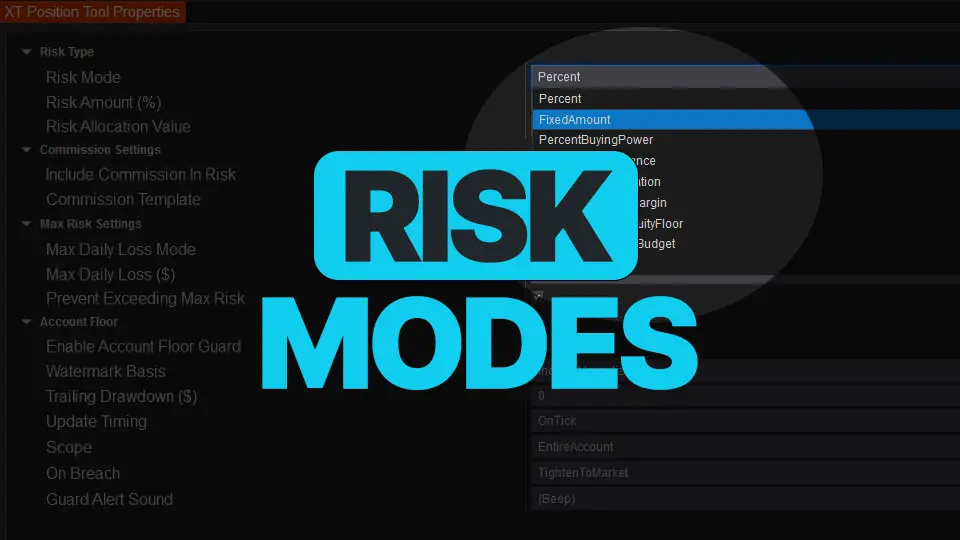
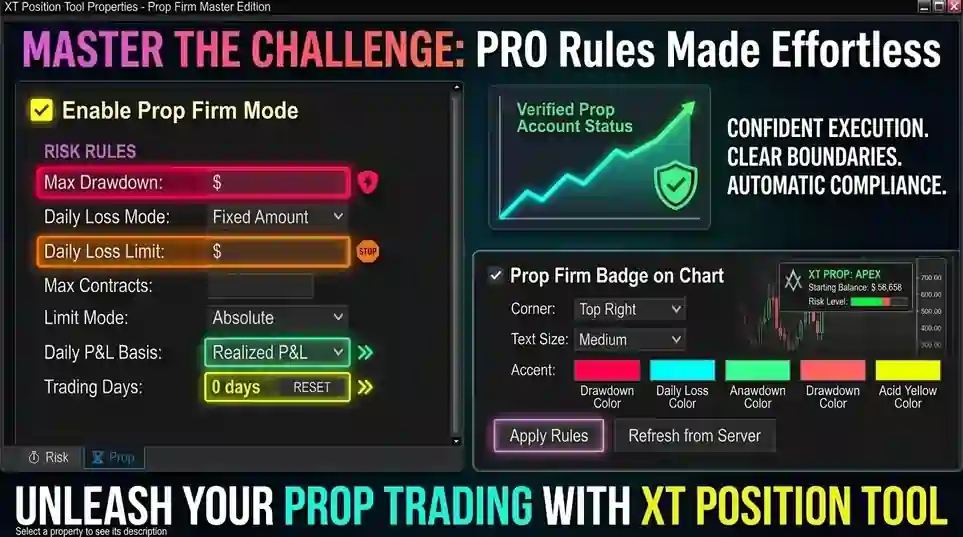
NinjaTrader Risk Management That Actually Moves the Needle
Smart position sizing isn’t “set it and forget it.” Markets move, balances change, and your constraints (margin, daily loss, prop-style…
Carl
NinjaTrader 8.1.6 — The “No Fluff” Tour (Speed, Clarity, Fewer Clicks)
If you only have five minutes to figure out what changed in NinjaTrader, make it this update. NinjaTrader 8.1.6 quietly…
Chris
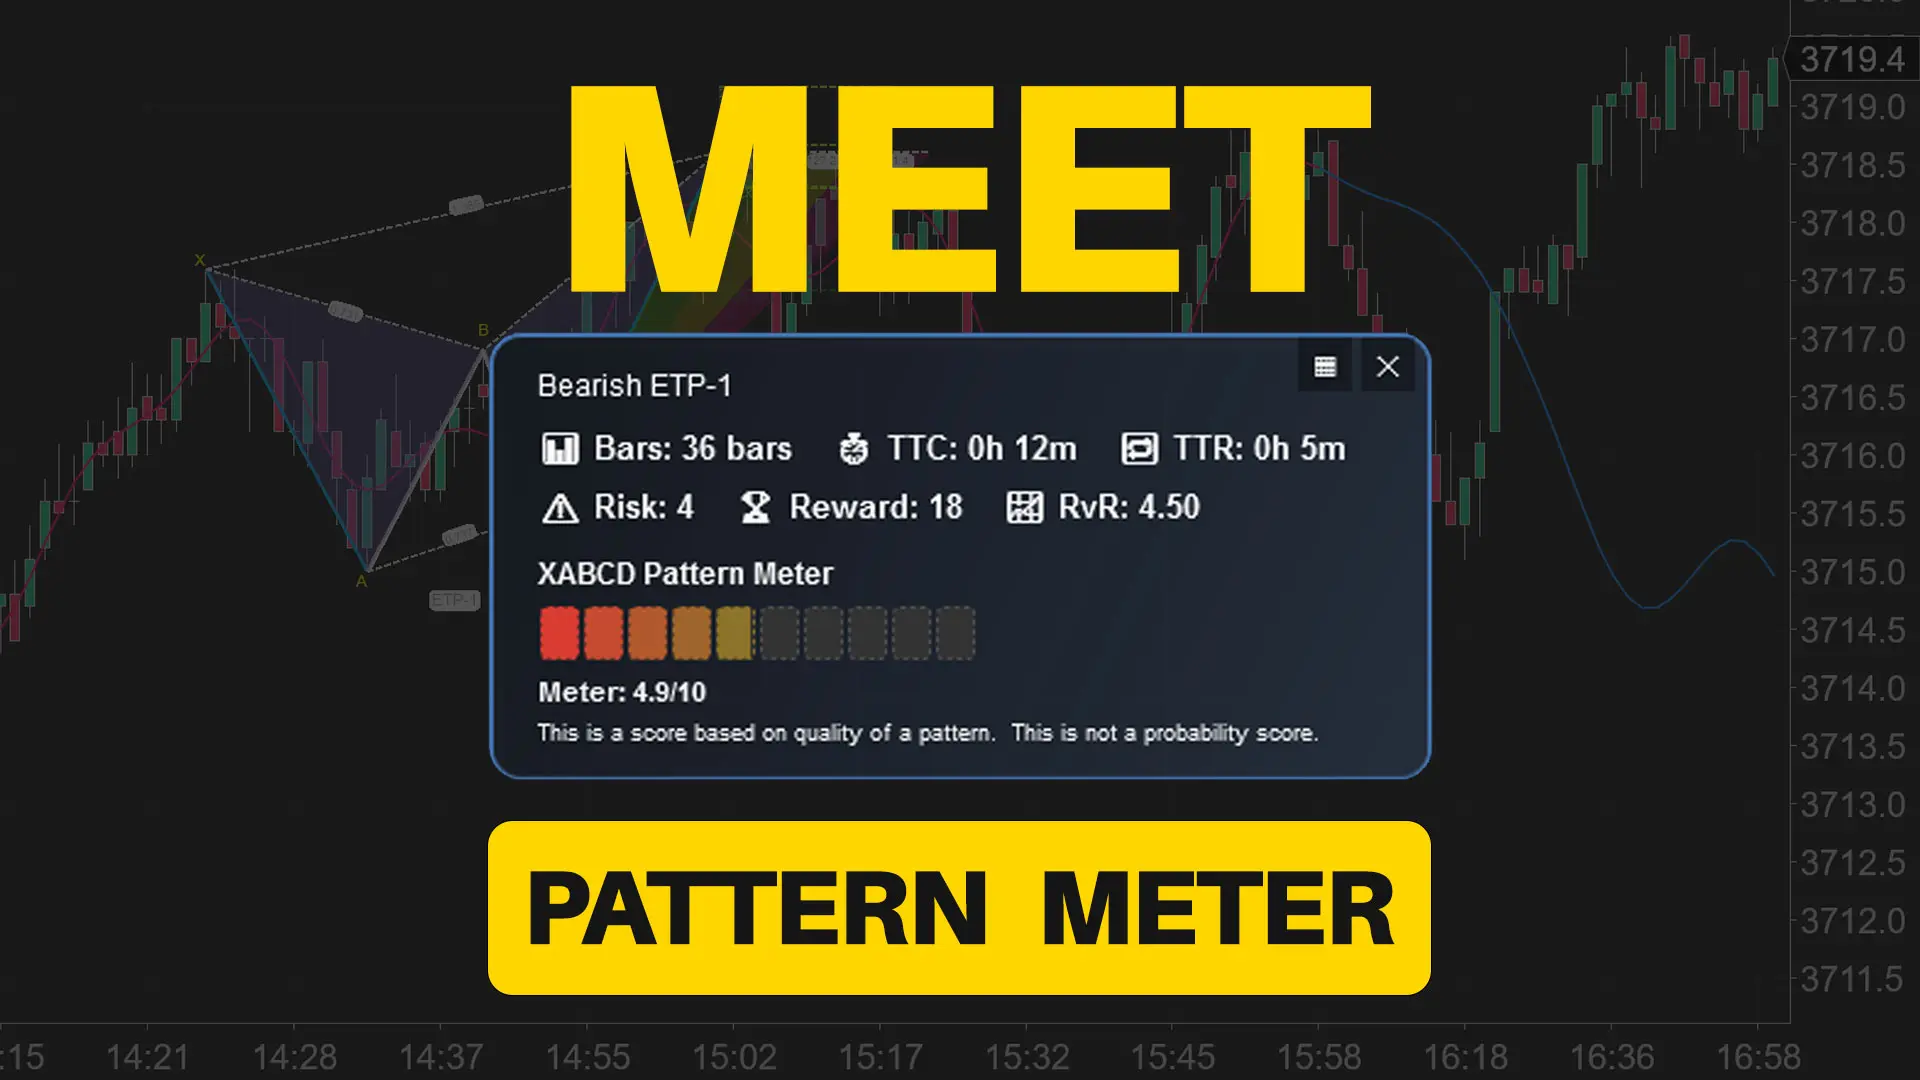
Meet the XABCD Pattern Meter (Real-Time Clarity)
The XABCD Pattern Meter packs the objective checks you would normally do by hand into one weighted score for quick…
Carl

Easy Order Tool

The Strategy


Scanning & Alerting

NinjaTrader Release

XABCD News (Free Version)
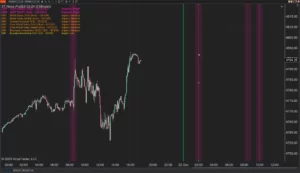
XABCD News (Community Edition) is the best free Indicator for NinjaTrader 8. Don't let news sneak up on you again. Puts economic news events on your charts so you can stay informed and move around positions/stops before the news is released. Works in any market.
XABCD Priceline (Free)
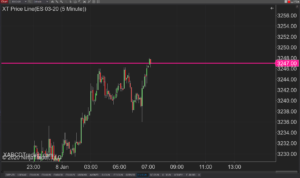
XABCD Price Line tool for NinjaTrader 8 will draw a line at current price and move every time the market changes price. This is useful because it will allow you to easily identify where price is at all times and the exact quoted price.