XABCD TRADING
What is XABCD Trading and Why It’s Important?
Subscribe
to get alerts to our next blog post!
What is XABCD Trading?
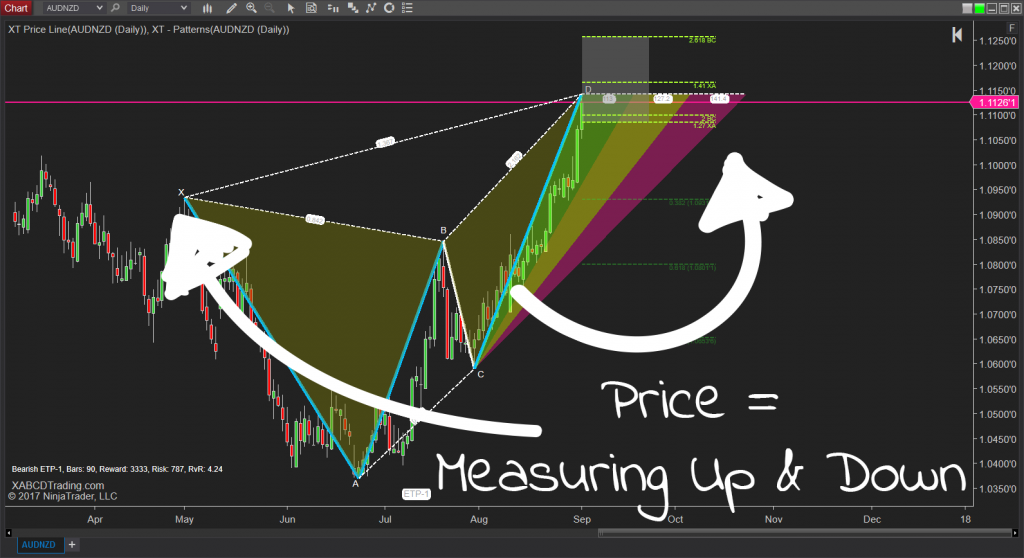
XABCD Trading is a way of using Time, Price and Frequency Waves to look for patterns for technical analysis traders. It can be used in any market, on any chart and on any time frame. The patterns are mapping out human emotions using both time and price analysis.
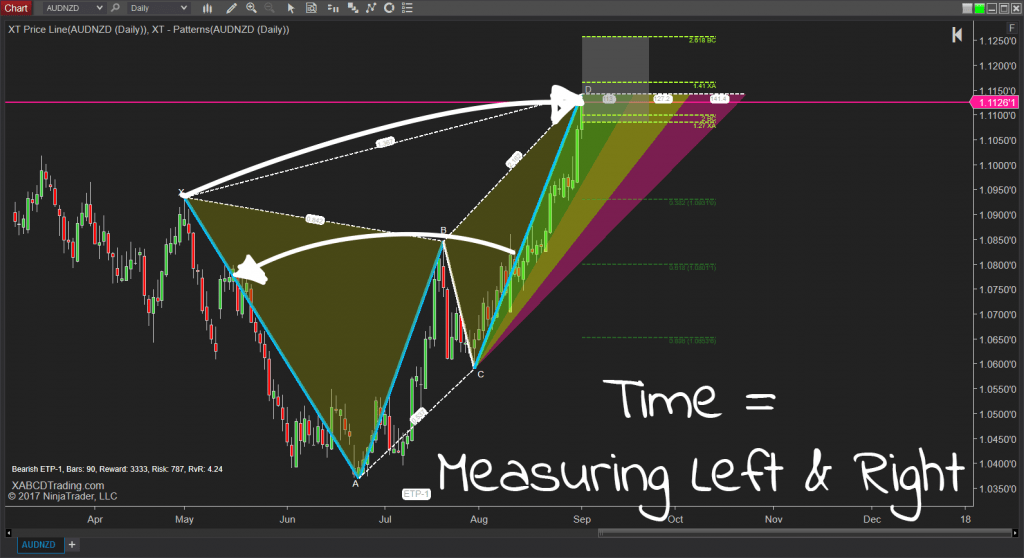
Time is a very important concept to measure because how long it takes for price to rise or climb has an important impact. Eg. Think of a real world example, a plane going slower than a car won't take off where if it goes fast enough has the ability to fly. On the other hand, driving through a school zone at the same speed as on the highway will lead probably lead to a very dangerious situation even though you're still going from point A to point B. Using price and time inside of your patterns will be extreamly important for consistency.
A full comprehensive guide to XABCD patterns can be read on the patterns for more details on how to use these patterns.
How Is Fibonacci Time Is Used In The Construction of XABCD Patterns?
What is XABCD trading when it comes to time? Time is extremely important when looking at patterns as they can tell us so many things and help us with our trade management - we teach you this in our educational course. If you're looking for more information on the importance of time, our Complete Guide to XABCD Patterns has a lot of good information surrounding this topic.
Eg. Once a pattern is triggered, you will only have so long before your ability to forecast patterns diminishes and will lose probability. Similar to the weather and trying to forecast 7 days out. Understanding how long a pattern will take to work out and all the measurements between the start and completion of the pattern makes you far more successful as a technical trader.
What Can Time Measurements Help You Answer?
How long will it take for a pattern to play out?
Knowing this information can be important in order to try and forecast if you will be out of a trade before a new event happens. It can also be used to know if a trade will be completed by the weekend.
How long should a pattern take to form before we gain probability?
We collect patterns daily, and last time we checked that was around 1200 patterns a day. We then look at all these patterns and determine their reversal rate success and then look at the patterns total bar count. So given this information we can make sure the software only shows us patterns that have patterns that meet those minimums.
How much time should it take to create each pattern leg segment?
Each pattern can be broken down further and looked at by leg segment. We consider a leg segment to be from one pattern point to another. Eg, X point to the A point and then look at how much time it took to create the pattern points. This allows us to get a more consistently shaped pattern.
Will I have enough time for a pattern to materialize before a news event?
The smaller the time frame the less time you will have to react to any pattern. If you require more time, then you should be trading a higher time frame. With that being said, a 15 minute candlestick chart will usually give you an hour to enter a trade on average.

How Fibonacci Price Is Used?
What is XABCD trading when it comes to price? Measuring price will help us know how strong a move is during the pattern. This is an important part of the puzzle because it starts to answer questions on how much force is present. Where time will tell us when the market is looking to form a possible reversal, price will help us indicate a level we would want to hone in and focus on.
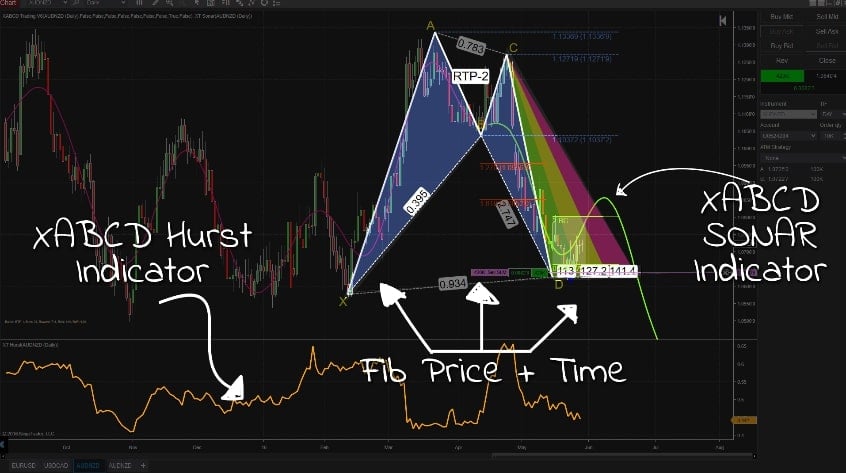
How Frequency Waves Are Used In XABCD Pattern Trading?
Our frequency wave analysis will help us determine two things regarding our patterns:
Is the data that makes up the pattern showing more anti-persistence or persistence?
What are the frequency waves telling us regarding price and time in combination for the future?
We have two indicators that do this, the first being the XABCD Hurst indicator. This will tell us if the non-linear data we're looking at is persistent (meaning price might not reverse in the expected area) or anti-persistent (meaning we'll see a greater chance of a reversal).
The second is the SONAR indicator that will analyze the frequency waves (using price + time) to determine the probability of future price waves and what we might be able to expect for both direction and strength.
New NinjaTrader Articles Delivered First

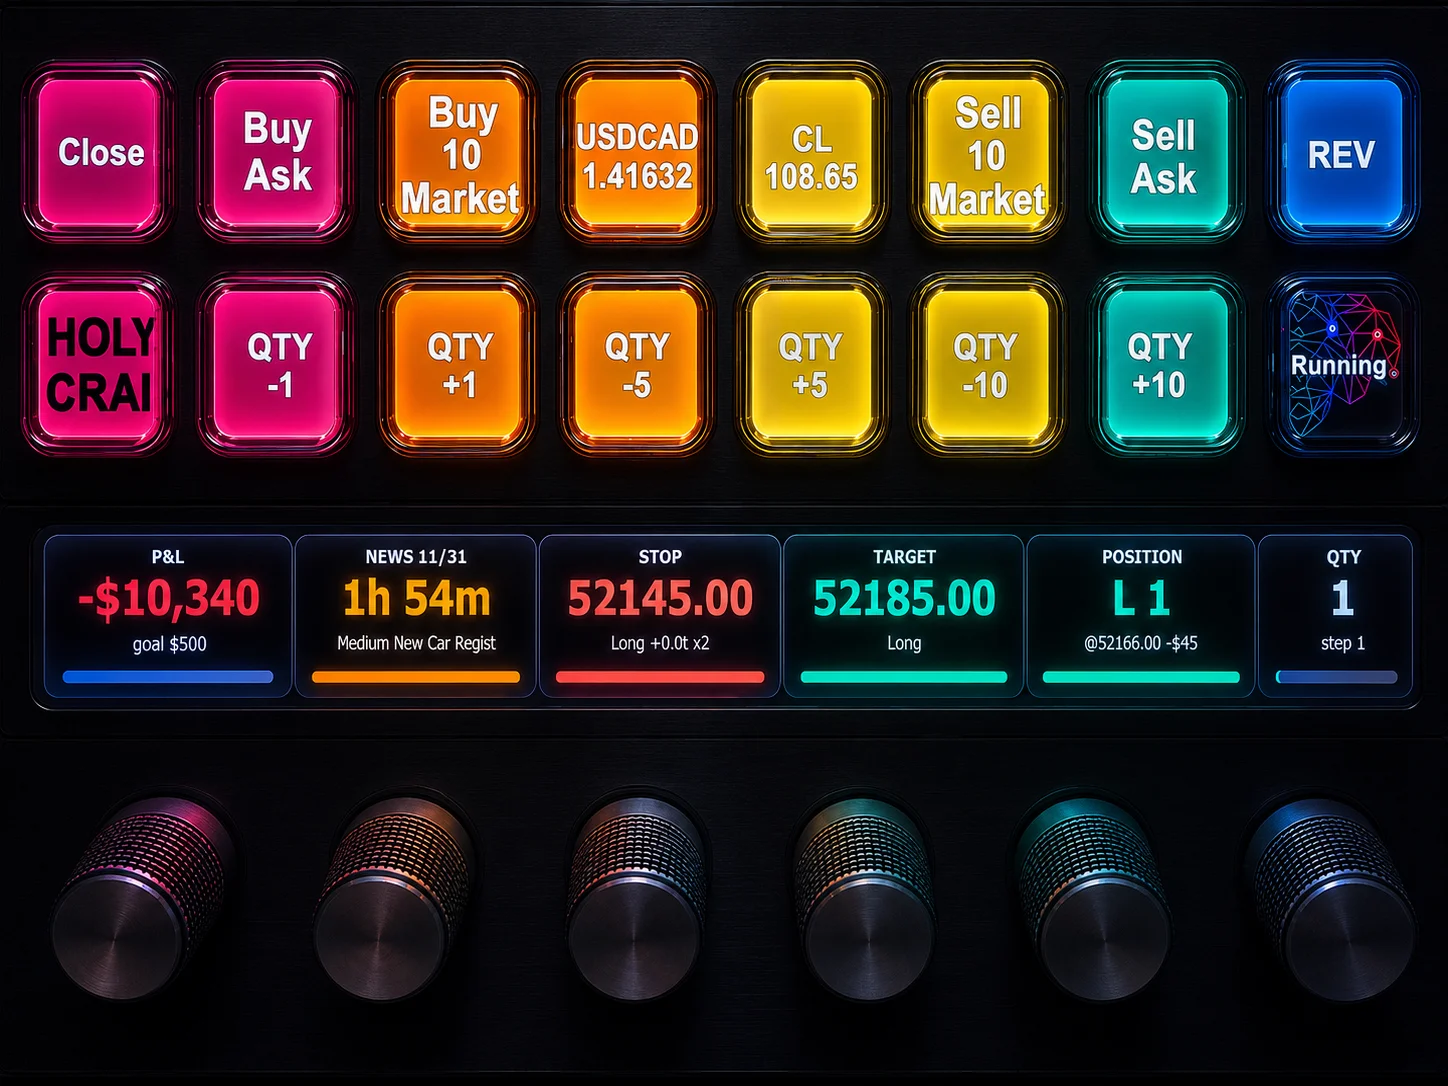
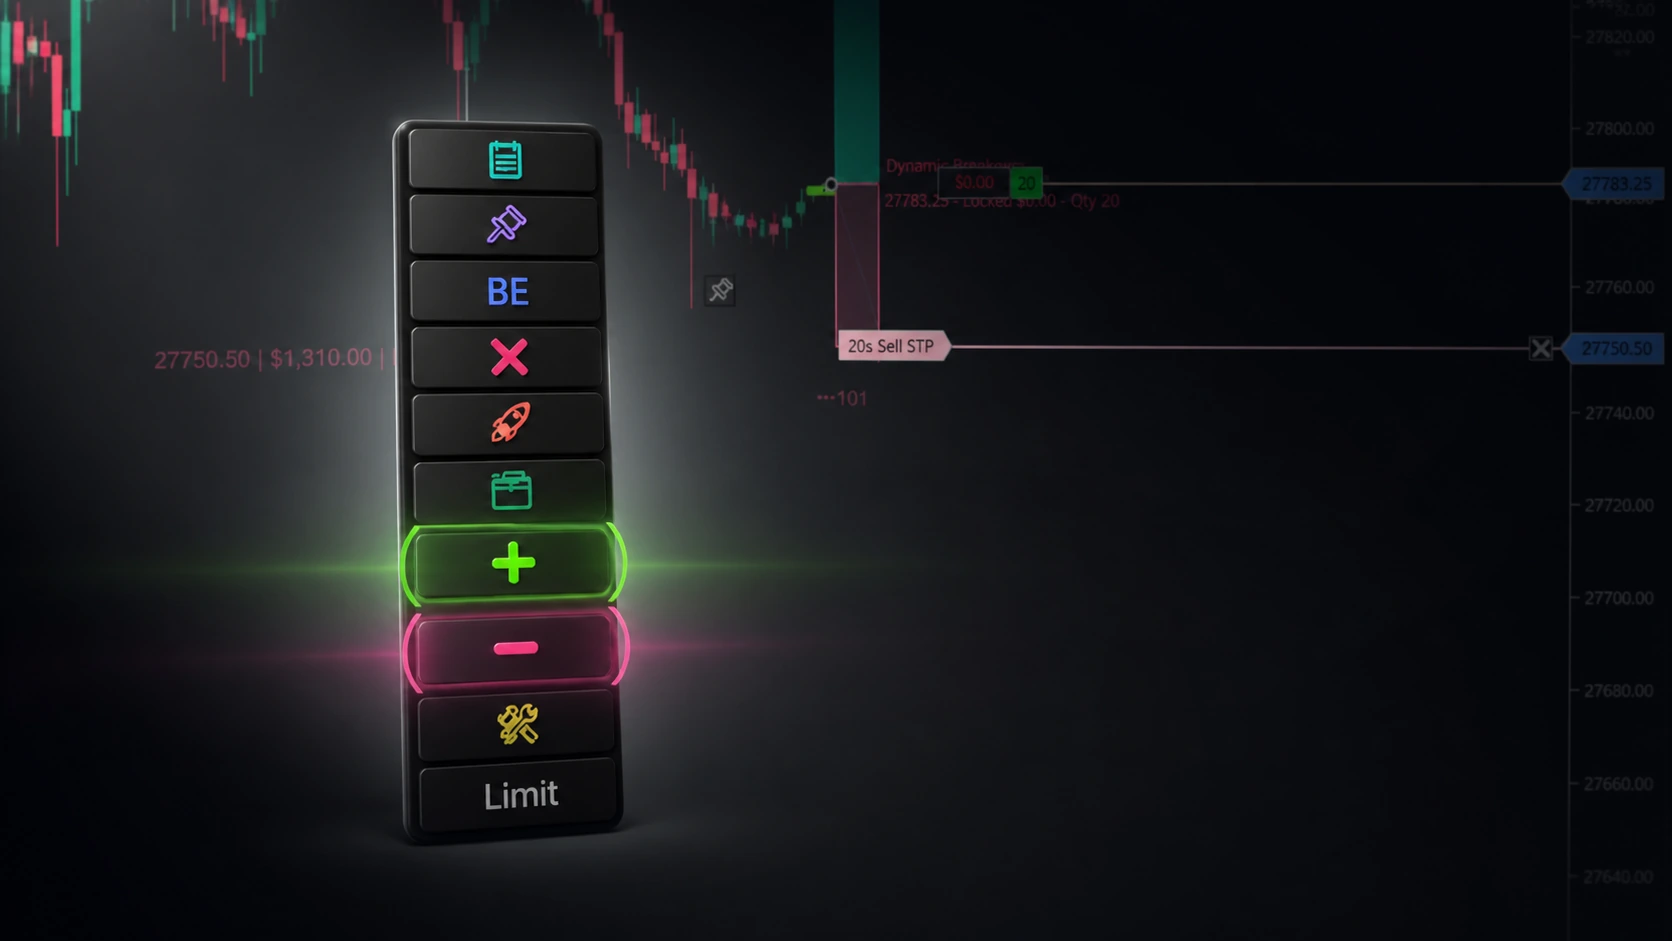
Easy Order Tool
The Strategy

Scanning & Alerting

NinjaTrader Release
XABCD News (Free Version)
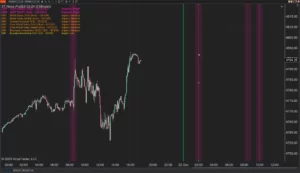
XABCD News (Community Edition) is the best free Indicator for NinjaTrader 8. Don't let news sneak up on you again. Puts economic news events on your charts so you can stay informed and move around positions/stops before the news is released. Works in any market.
XABCD Priceline (Free)
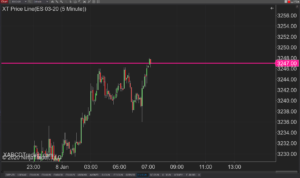
XABCD Price Line tool for NinjaTrader 8 will draw a line at current price and move every time the market changes price. This is useful because it will allow you to easily identify where price is at all times and the exact quoted price.
NinjaTrader 8 Hotkeys: Best Shortcuts for Faster Trading
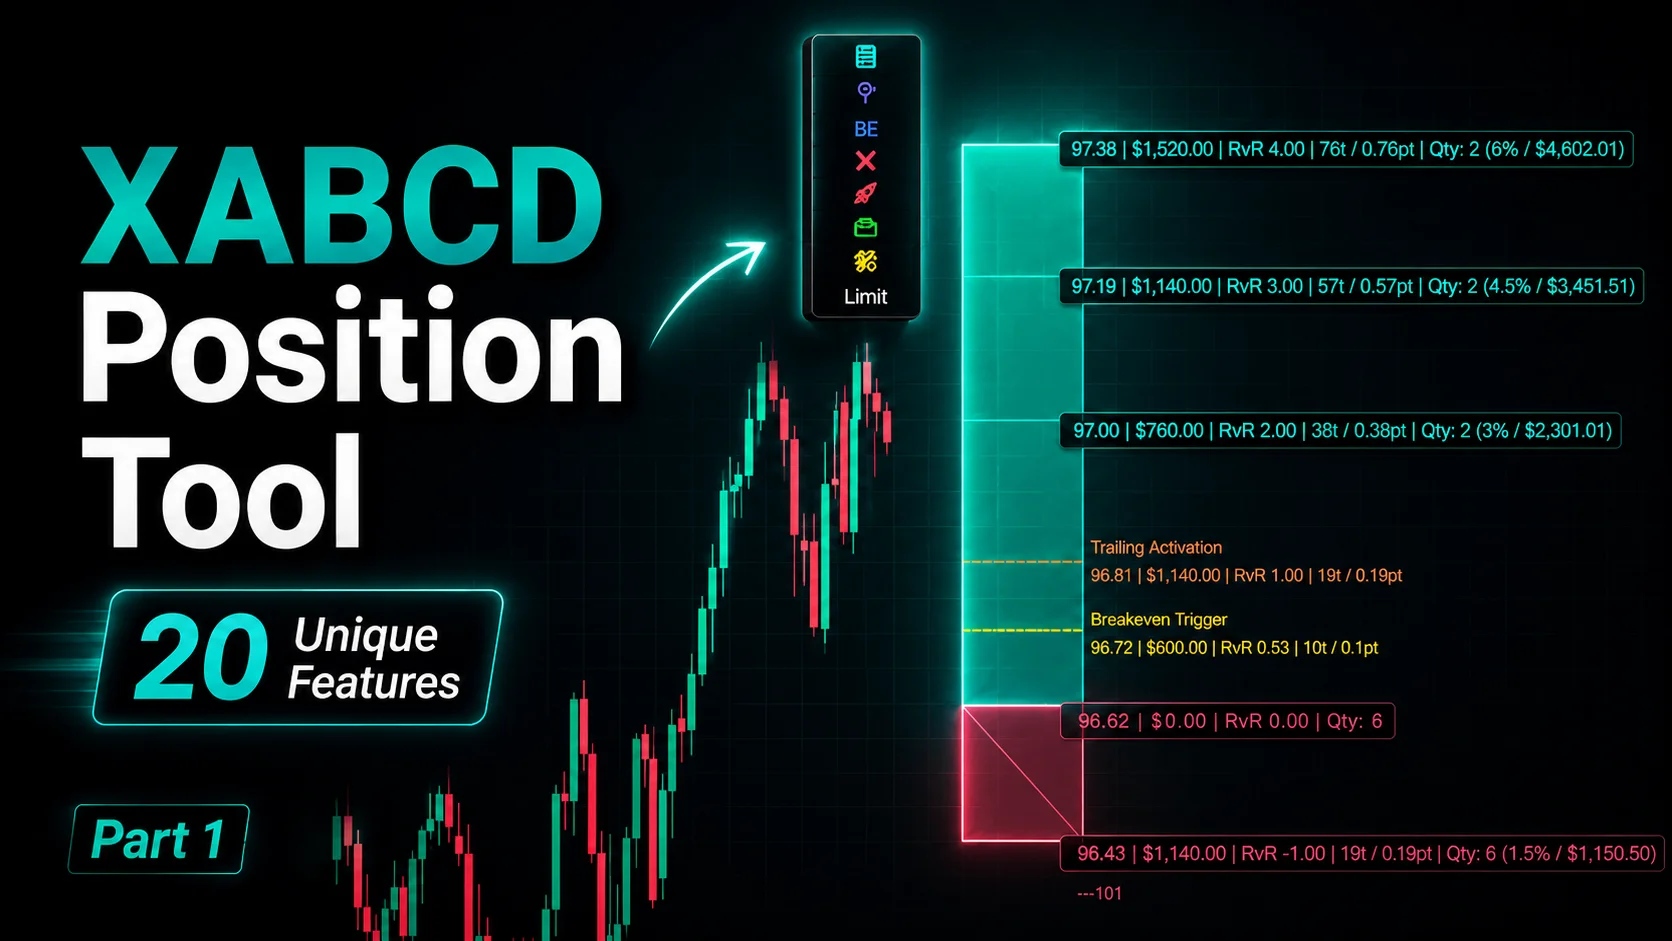
NinjaTrader Position Sizing Tool: 64 Features Stock NT8 Does Not Include
NinjaTrader – Adding to Position: A Field Guide for Active Traders
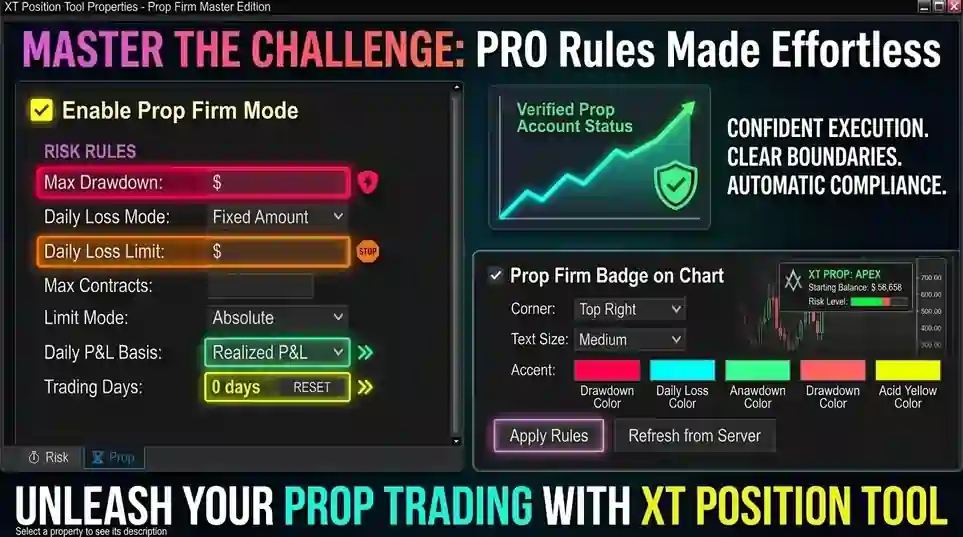
NinjaTrader Prop: The Ultimate Guide to Prop Firm Trading
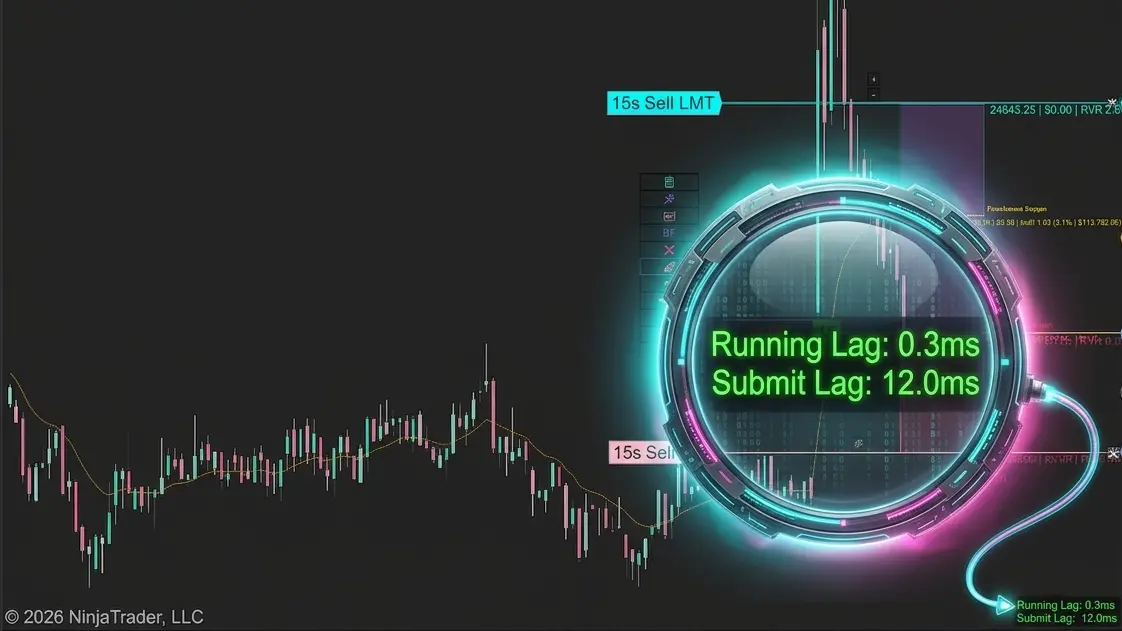
Does the XABCD Position Tool Lag?
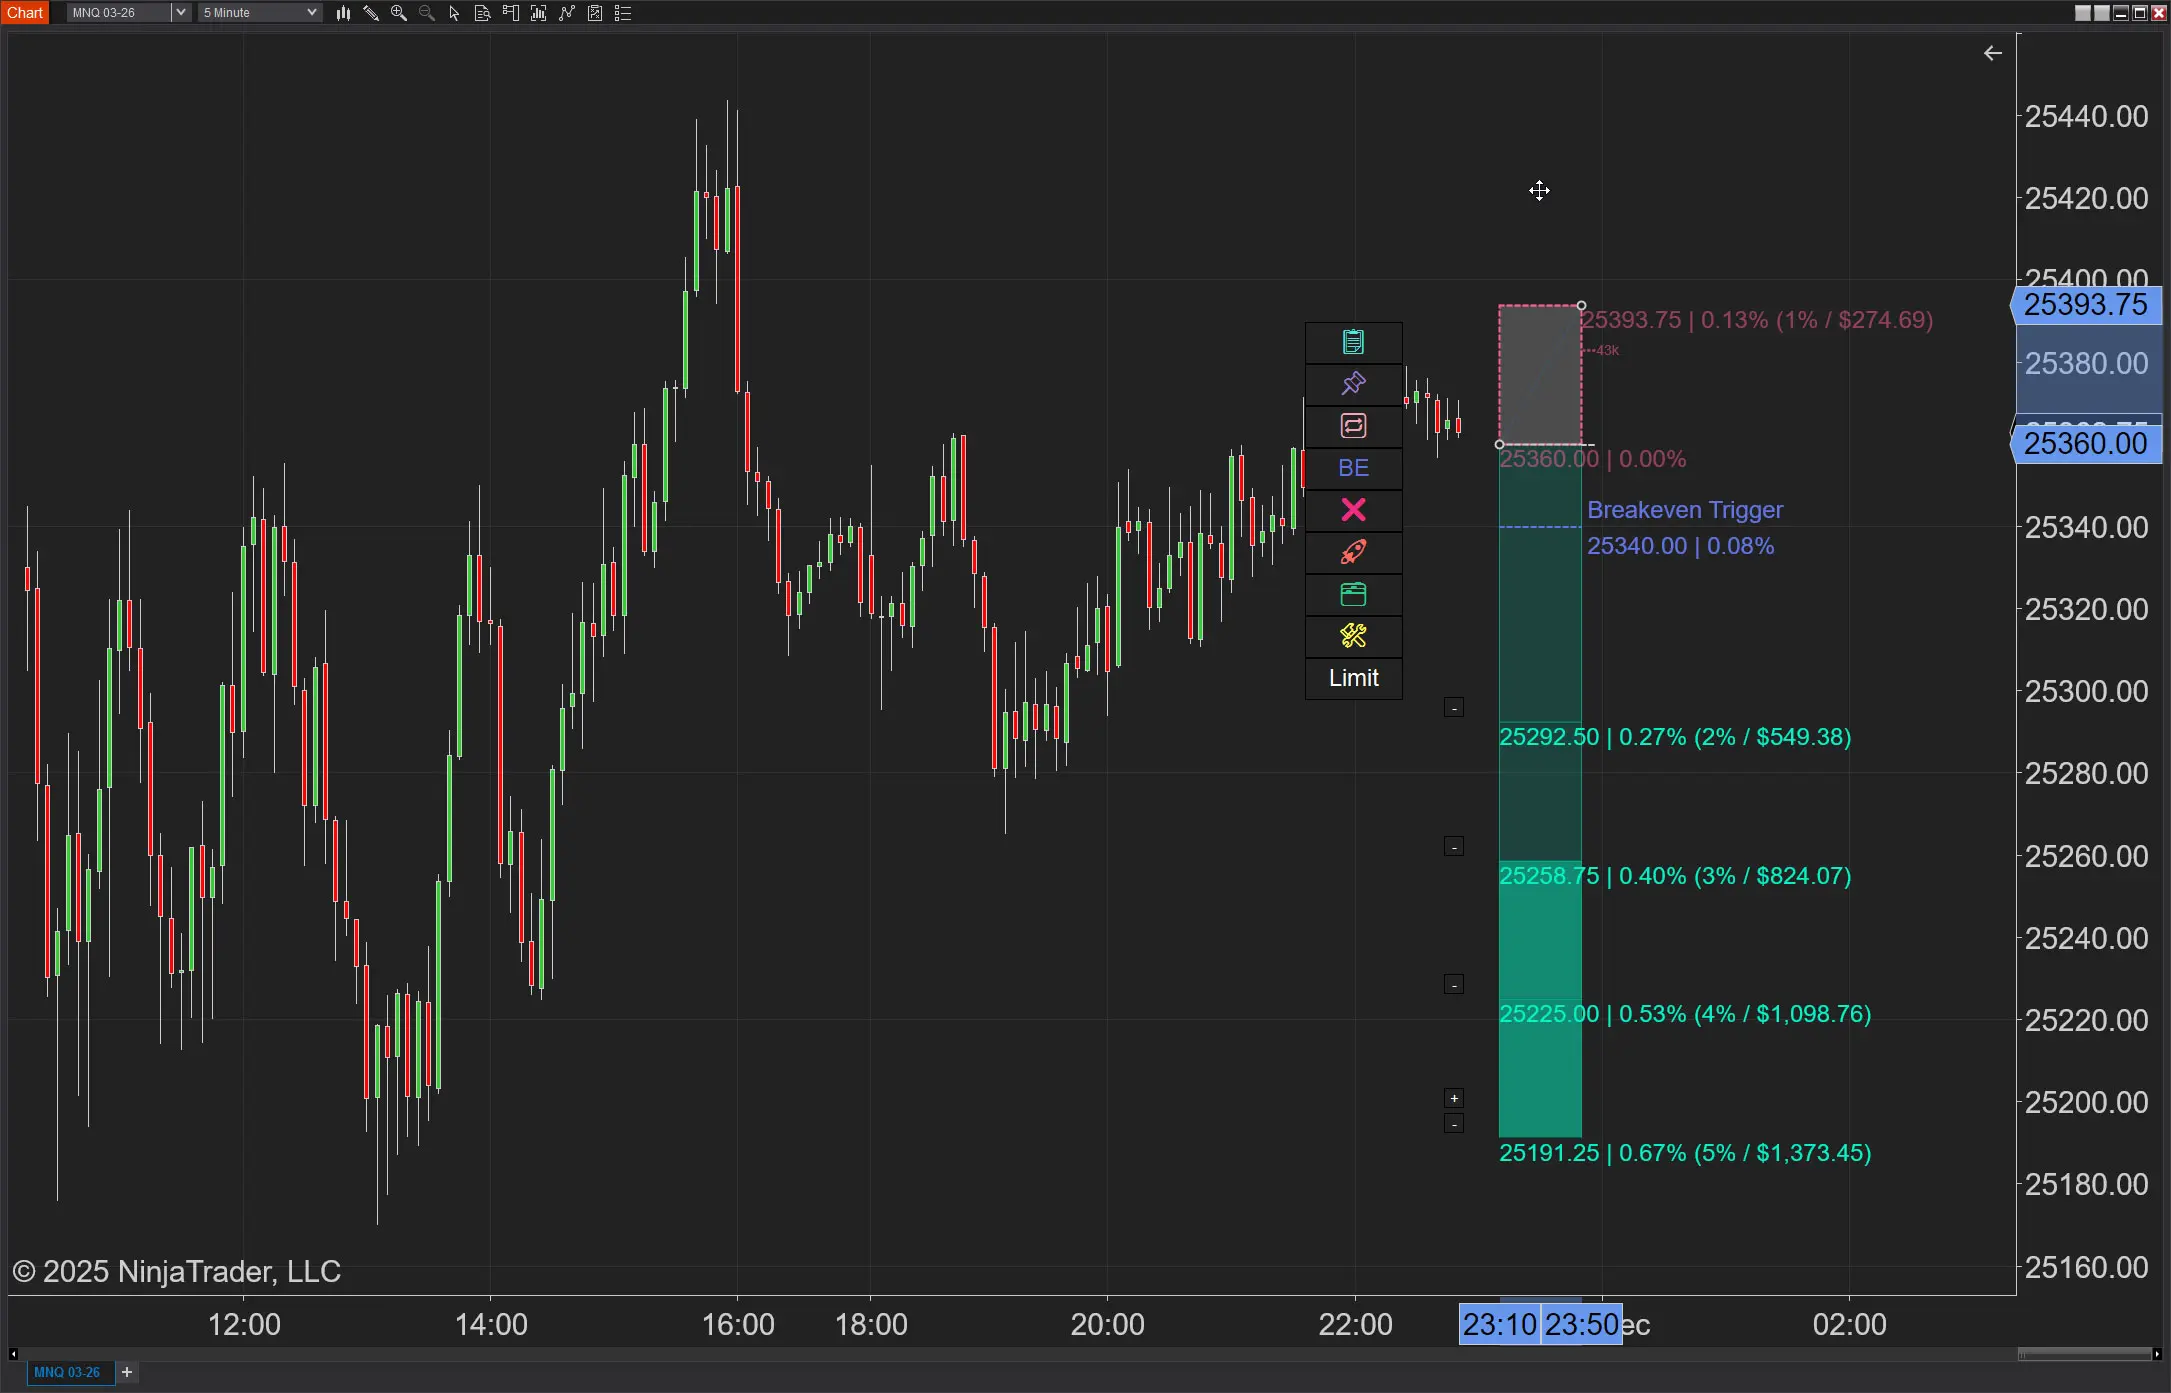
NinjaTrader Position Sizing: What the XABCD Position Tool Can Do That ATM’s Can’t
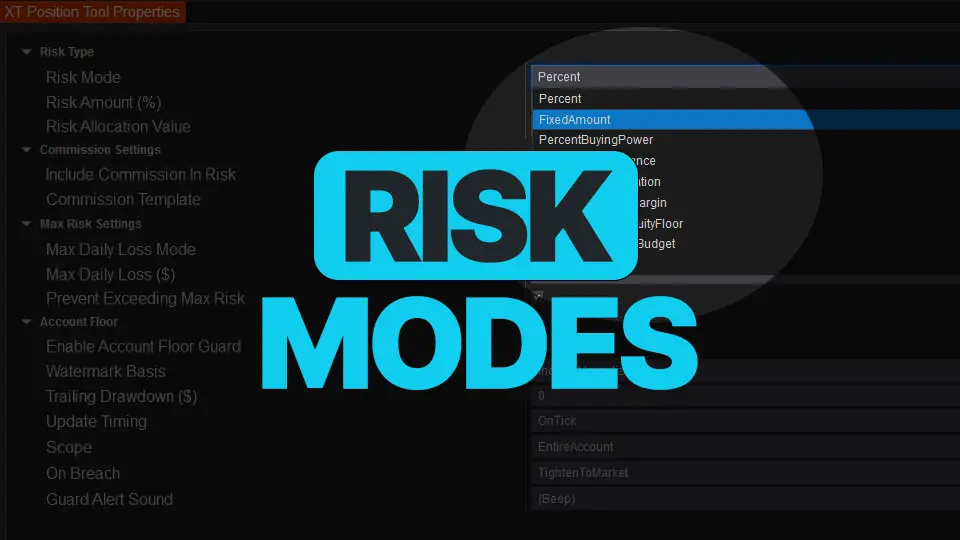
NinjaTrader Risk Management That Actually Moves the Needle
NinjaTrader 8.1.6 — The “No Fluff” Tour (Speed, Clarity, Fewer Clicks)
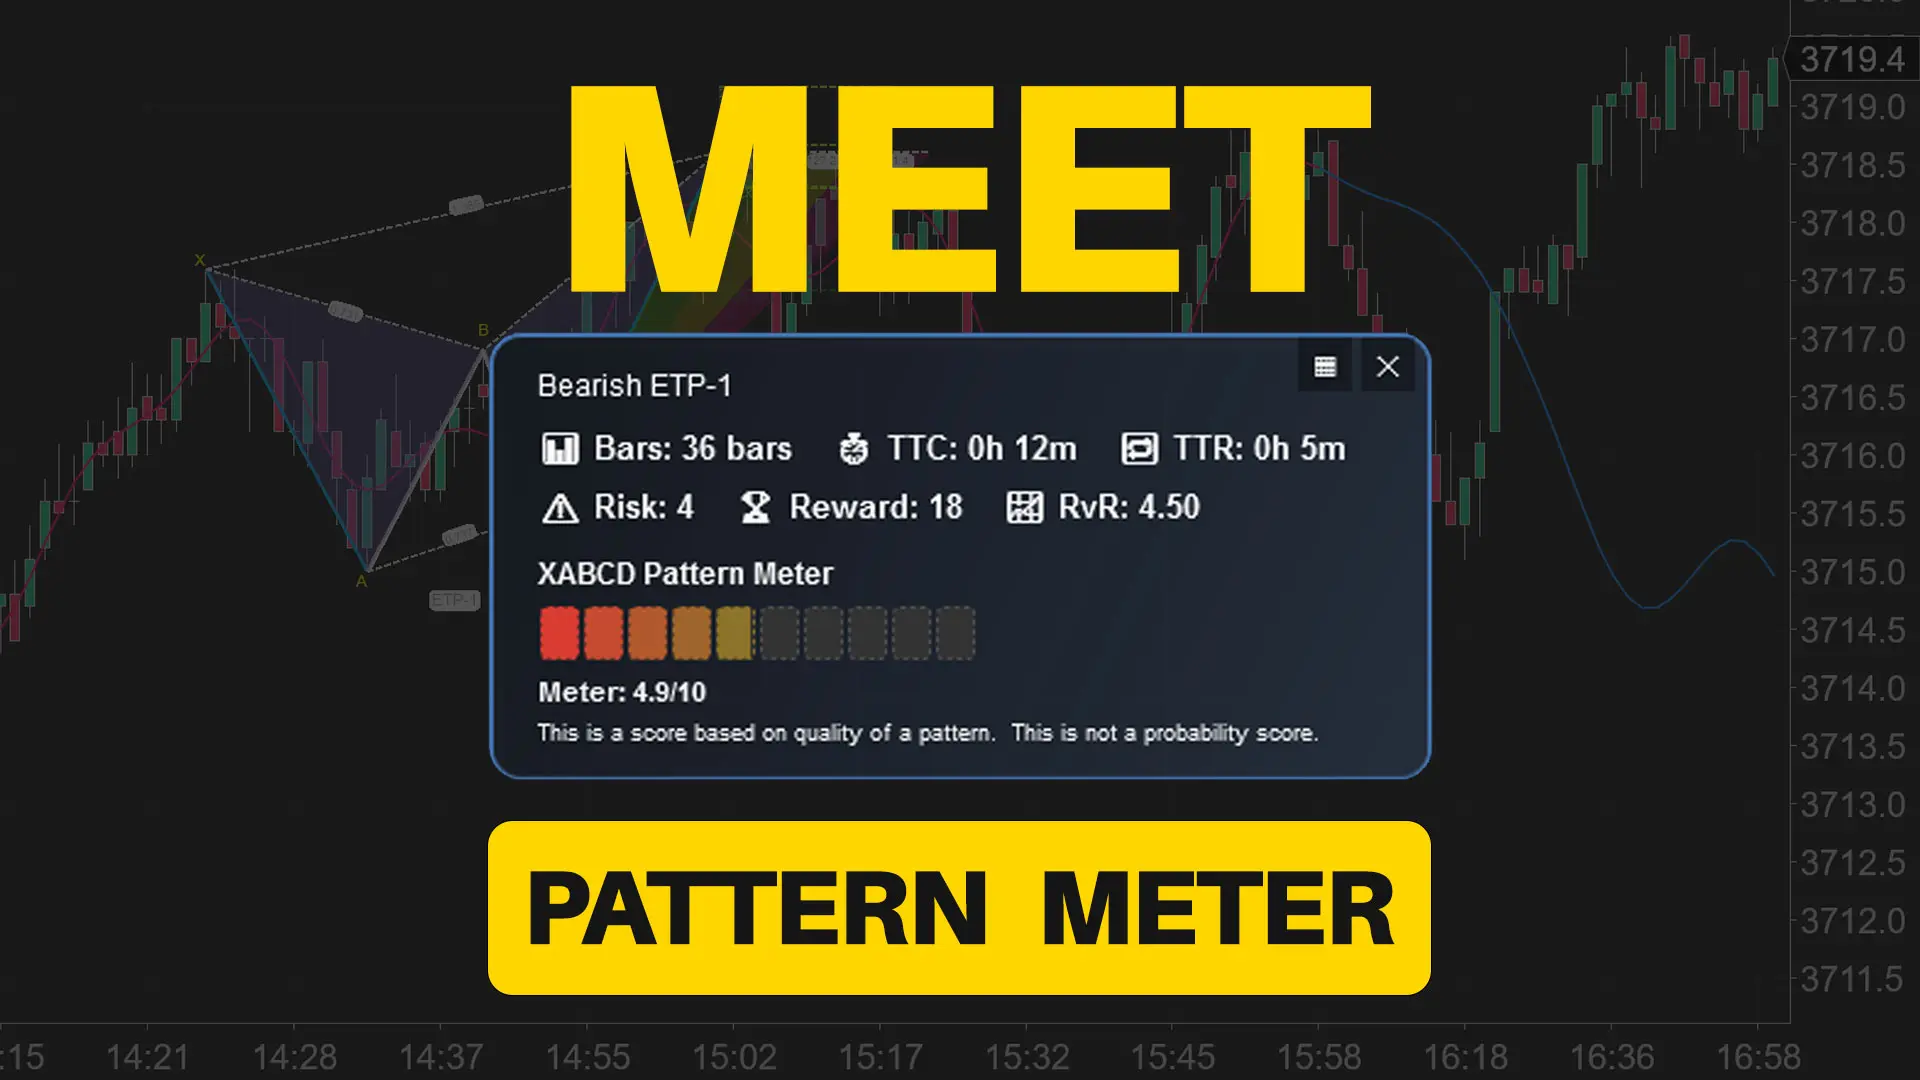
Meet the XABCD Pattern Meter (Real-Time Clarity)