XABCD TRADING
How To Setup Alerts For XABCD Potential Patterns?

Subscribe
to get alerts to our next blog post!
The Basics of Scanning and Alerting to Potential Patterns
Can our NinjaTrader and MetaTrader XABCD software look for Potential Patterns? And you can do this quite easily... want to see how? We'll show you a step by step example below on how to setup potential patterns so you can get alerted sooner to them using the market analyzer and our templates.
Step 1) Pick A Pattern Type
You should now bring up your XABCD Properties window and look for your ETP-1 pattern ratios. We're only going to focus on the price points for these settings to create our potential patterns.
We have drawn in the pattern using our manual drawing tools in order to show you the potential pattern. When the pattern turns color from grey to red (telling us the ratios are valid) we know where the potential pattern will complete.
The ratios for this specific pattern has an XA that begins at a 1.27XA. This is when the pattern becomes valid and we can look at possibly entering into the trade using all the lessons and details you have learned in our education center. Since all our ratios are customization all we need to do is change these ratios so they fire off earlier than the 1.27.
Step 2) Setting The New Ratios
Select a type of pattern. Let's take a Extension Time Pattern (ETP-2). This specific pattern uses both time and price in order to validate it's ratios as many of you know if your using our XABCD patterns.

Since the XA was the beginning of the pattern with the 1.27 level starting it off, we can change this to something earlier. A value of 1.13 might notify you of the potential pattern sooner with out creating too many false alerts (pattern alerts that never happen) but if you want even more patterns change it to something like 1.00.
This way once price breaks through the X point in the XABCD pattern we can go ahead and use that as our notification point.
Warning About Potential Setups: Be careful when using potential patterns. You will get a lot more pattern alerts but a lot fewer alerts will actually turn into patterns.
Step 3) The Outcome of the New Ratios (Our Potential Patterns)
Changing the XA to a 1.13XA and alerting yourself early to this pattern you can see how you can be alerted much earlier to the pattern actually completing. In this example your looking at you would be alerted 60 pips before the XA 1.27 would actually be hit allowing yourself to be notified early.

So in conclusion, you can adjust the ratios for each pattern depending on how much earlier you want to be alerted too it. I do want to point out one important thing about trading potential patterns. Understand that the pattern should never be traded right when it completes (for many reasons which we go over in our education center) and some of the worst times to get into a pattern is going to be the first tick inside of the reversal area.
If you are only wanting to use the potential patterns because you suffer from FOMO (fear of missing out) then you should check out our on-demand trading center for our registered members as a way of getting past that feeling and configuring the software so you can remove the missing out feeling. Your not going to capitalize on ever trade and we need to make sure were not forcing trades.
Frequently Asked Questions
What are potential patterns in data analysis?
Potential patterns in data analysis are recurring trends, correlations, or structures within a dataset that may indicate meaningful relationships or predictable behaviors. Identifying these patterns helps analysts make informed decisions, forecast outcomes, and uncover hidden insights that might otherwise go unnoticed.
How do you identify potential patterns in a dataset?
You can identify potential patterns in a dataset by using techniques such as data visualization, statistical analysis, clustering, and machine learning algorithms. Exploratory data analysis (EDA) is often the first step, where charts, graphs, and summary statistics help reveal trends, outliers, and correlations within the data.
Why is recognizing patterns important in decision-making?
Recognizing patterns is important in decision-making because it allows individuals and organizations to anticipate future outcomes based on historical data. By detecting recurring trends early, decision-makers can allocate resources more effectively, mitigate risks, and capitalize on emerging opportunities.
What tools are commonly used to detect potential patterns?
Common tools for detecting potential patterns include Python libraries like Pandas and Scikit-learn, R for statistical computing, Tableau for data visualization, and Excel for basic trend analysis. Machine learning platforms and AI-driven analytics tools are also widely used to uncover complex patterns in large datasets.
What is the difference between a pattern and a coincidence in data?
A pattern is a consistent, repeatable trend supported by sufficient data points and statistical significance, while a coincidence is a random occurrence without a reliable underlying cause. To distinguish between the two, analysts use hypothesis testing, correlation analysis, and larger sample sizes to confirm whether observed trends are genuinely meaningful.
Frequently Asked Questions
What are potential patterns in data analysis?
Potential patterns in data analysis are recurring trends, correlations, or structures within a dataset that may indicate meaningful relationships or predictable behaviors. Identifying these patterns helps analysts make informed decisions, forecast outcomes, and uncover hidden insights that might otherwise go unnoticed.
How do you identify potential patterns in a dataset?
You can identify potential patterns in a dataset by using techniques such as data visualization, statistical analysis, clustering, and machine learning algorithms. Exploratory data analysis (EDA) is often the first step, where charts, graphs, and summary statistics help reveal trends, outliers, and correlations within the data.
Why is recognizing patterns important in decision-making?
Recognizing patterns is important in decision-making because it allows individuals and organizations to anticipate future outcomes based on historical data. By detecting recurring trends early, decision-makers can allocate resources more effectively, mitigate risks, and capitalize on emerging opportunities.
What tools are commonly used to detect potential patterns?
Common tools for detecting potential patterns include Python libraries like Pandas and Scikit-learn, R for statistical computing, Tableau for data visualization, and Excel for basic trend analysis. Machine learning platforms and AI-driven analytics tools are also widely used to uncover complex patterns in large datasets.
What is the difference between a pattern and a coincidence in data?
A pattern is a consistent, repeatable trend supported by sufficient data points and statistical significance, while a coincidence is a random occurrence without a reliable underlying cause. To distinguish between the two, analysts use hypothesis testing, correlation analysis, and larger sample sizes to confirm whether observed trends are genuinely meaningful.
Still have a question about this?Ask the XABCD team in Live Chat and get help with your setup.Ask in Live Chat →
New NinjaTrader Articles Delivered First
Free tutorials, fixes and setup guides by email. Two emails a month at most.
Free tutorials, fixes and setup guides by email. Two emails a month at most.
Recommended Tool
XABCD ATM Pack
23 free ATM strategy templates for NinjaTrader 8. Import them and start with your stops and targets already set up.
Get the Free ATM Pack →
Recommended Video
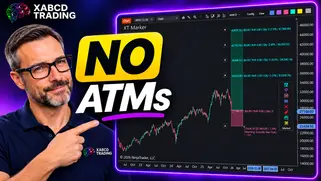
Ditch NinjaTrader ATMs: This Is More Powerful
See how to set your risk and calculate contracts directly on the chart.
Watch Now
Subscribe on YouTube
Related Tool

XABCD ATM Pack
23 free ATM strategy templates for NinjaTrader 8. Import them and start with your stops and targets already set up.
Get the Free ATM Pack
Why XABCD Trading
- Built for NinjaTrader 8 since 2009
- Trusted by 2,000+ traders
- On-chart tools, no ATM templates needed
- Free tools to get started

Get Project Updates
Twice-monthly maximum, we will give you updates on all the projects going here.
Quick Links