XABCD TRADING

XABCD Pattern Suite
Table of Contents
- Introduction
- Getting Started
- Detection Engines
- Pattern Types
- Pattern Info Panel
- Reversal Area
- Targets & Fibonacci Levels
- Potential Patterns
- Bar Count Rules
- Quality & Confirmation Filters
- Style Settings
- Detection & Chart Display Settings
- Templates
- Market Analyzer (Scanner & Alerts)
- AI Pattern Analysis & Pattern Database
- Practical Examples
- Troubleshooting
Introduction
The XT Patterns indicator is XABCD Trading's core XABCD pattern recognition engine for NinjaTrader 8. It automatically scans price action to identify and draw XABCD Patterns on your chart, measuring the Fibonacci ratio relationships between each leg of a pattern and validating them against your configured criteria.
When a pattern is detected, the indicator draws the full pattern geometry on the chart and displays a floating info panel showing key trading metrics: risk, reward, risk-to-reward ratio, and a pattern-quality score that rates the overall structure of the setup.
Key capabilities include:
- Automatic detection of multiple proprietary pattern classifications across all timeframes
- Floating info panel with live risk, reward, and ratio metrics
- Reversal area showing where the D-point is expected to form
- Fibonacci extension and retracement target levels drawn automatically
- Potential pattern mode, so you can see incomplete patterns before the D-point forms
- Leg Quality and Confirmation filters that drop choppy patterns and score each setup against optional checks at the D-point (volume, RSI divergence, moving average, MACD, ADX, RSI level, and close-in-reversal-area)
- Two detection engines: Real-Time or Confirmation
- Extensive visual customization including opacity, gradient, color, line, and font controls
- Template system for saving and reusing configurations across charts
- A multi-instrument, multi-timeframe scanner built on NinjaTrader's Market Analyzer, feeding the XABCD Alerts board
- Optional AI pattern analysis, plus a shared Pattern Database that shows how similar historical patterns actually resolved
Getting Started
Adding to Your Chart
- Open a chart in NinjaTrader 8
- Open the Indicators panel and locate XT Patterns under the XABCD Trading category
- Double-click or drag it onto your chart
- The indicator immediately begins scanning historical bars and displays any detected patterns
XT Patterns draws directly on top of the price chart (overlay mode). No separate sub-panel is created.
Opening the Settings Window
Most of XT Patterns' detailed configuration (colors, opacities, lines, fonts, detection, bar-count rules, targets, and the reversal area) is not located in NinjaTrader's standard indicator Properties dialog. Instead it lives in the dedicated XABCD Properties window.
To open it:
- Go to the NinjaTrader Control Center
- Click New > XABCD Suite > XABCD Patterns
The window has these tabs across the top:
- Patterns — pattern definitions and ratios
- General Settings — everything else, organised into three sub-tabs (below)
- Scanner & Alerts — the Market Analyzer Template Builder (see Market Analyzer)
- Advanced — advanced and diagnostic options
The General Settings tab is split into three sub-tabs, shown as a strip along the bottom of the page. Each sub-tab scrolls on its own, so you never scroll past settings that belong to a different job:
| Detection | What gets found. Sections: Pattern Search, Reversal Area & Gaps, Bar Count Rules, Leg Quality Rules, and Confirmation Filters (at D) |
| Chart Display | What gets drawn. Sections: Pattern Elements (with a nested XT Pattern Options group) and Time Extensions |
| Style | How it looks. An Appearance preset picker, then Colors, Fonts, Labels & Text, Lines, and Opacities |
Use Save at the bottom of the window to apply your changes, or right-click and choose Restore Defaults to reset everything. The standard NinjaTrader indicator Properties dialog only exposes the Template selector and a set of read-only exposed values (the X/A/B/C/D prices and pattern metrics, available for tools such as Bloodhound).
Finding a Setting
There are roughly 200 controls across the tabs, so the window has several tools for getting to the one you want.
- Search — the search box in the toolbar filters the page down to matching settings as you type, across every tab. When matches sit on other tabs, a small chip appears for each one showing the tab name and how many matches it holds; click a chip to jump there.
- Changed only — narrows the page to settings whose value differs from the default. It is the quickest answer to "what did I change?"
- Changed-from-default dot — any setting that differs from its shipped default is marked with a dot. Right-click that setting to reset just it, leaving everything else alone. A legend explaining the dot appears above the sections whenever one is on screen.
- Zoom — scales the whole window's text and controls, for high-resolution monitors.
- Color theme — applies a coordinated color scheme to the pattern drawings in one step.
- Template — the template selector, so you can switch or save a whole configuration from the same toolbar.
Every control on the General Settings tabs carries a tooltip describing what it does, and numeric fields validate what you type, so an out-of-range value is rejected rather than silently clamped later.
Understanding What You See
Once added, a complete detected pattern displays several elements simultaneously:
- Pattern Body — a shaded polygon connecting the pattern's anchor points, filled with a configurable gradient
- Anchor Labels — the letters X, A, B, C, D placed at each pattern vertex
- Reversal Area — a colored box showing the price zone where the D-point is expected to form
- Target Levels — tick labels and lines at calculated price targets around the D-point
- Fibonacci Levels — extension and retracement lines derived from the pattern's legs
- Pattern Info Panel — a floating panel showing the pattern name, metrics, and a quality score
All of these elements can be individually shown or hidden, and their appearance is fully customizable in the XABCD Properties window.
Detection Engines
XT Patterns offers two detection methodologies, selectable in Detection > Pattern Search via the Engine Type drop-down:
Real-Time Engine (Default)
Updates pattern swings as price moves through the bar, so patterns appear and adjust intrabar. This gives the most responsive feedback and is the recommended setting for active trading on live markets.
Confirmation Engine
Builds its pattern swings from completed swing pivots rather than the still-forming bar. Patterns are confirmed from settled price structure, which produces fewer in-progress changes — preferred by traders who want to reduce intrabar noise.
Use Current Bar (Pattern Search, on by default) — applies to the Real-Time Engine. When enabled, the currently forming (incomplete) bar is included in the swing and ratio calculations. When disabled, only completed bars are used as swing points. This setting has no effect when the Confirmation Engine is selected.
Example: With the Confirmation Engine, a pattern's structure is based on confirmed swing pivots, so a freshly forming D-point will not lock in until the swing settles. With the Real-Time Engine and Use Current Bar enabled, the same developing pattern updates tick by tick as price moves.
Pattern Types
XT Patterns uses XABCD Trading's proprietary classification system to identify XABCD pattern structures. Each pattern type can be individually enabled or disabled on the Patterns tab.
| Variation 1 | Enabled by default |
| Variation 2 | Enabled by default |
| Variation 3 | Enabled by default |
| Variation 4 | Enabled by default |
| Variation 5 | Enabled by default |
| Variation 6 | Enabled by default |
| Variation 7 | Enabled by default |
| 4 Point | Disabled by default — detects four-point XABCD structures |
| 6 Point | Disabled by default — detects six-point XABCD structures |
| STP-1 | Disabled by default — a built-in three-point pattern (formerly labeled "3 Point") |
| XTP 1 | Disabled by default — advanced proprietary classification |
| XTP 2 | Disabled by default — advanced proprietary classification |
Note on pattern names: The toggles above use the labels "Variation 1" through "Variation 7". The name printed on the chart and in the info panel is a separate, configurable display name that defaults to an internal code (for example, Variation 1 shows as ETP-0 and XTP 1 shows as XTP-1), always prefixed with Bullish or Bearish for the pattern direction. You can rename these display names on the Patterns tab.
There is no longer a single "Custom" row in this list. Custom patterns are created as Additional Custom Patterns in the Pattern Builder instead, and you can add as many as you need. Each one has its own on-chart bullish and bearish colors and its own exposed value, so a custom pattern is identifiable in the Market Analyzer as well as on the chart.
Tip: If you are seeing too many patterns on a busy chart, start with only Variations 1 to 3 enabled to focus on the most common setups, then add additional types once you are familiar with how they appear.
Copy to a Custom Pattern
You can turn any pattern into a starting point for your own. On the Patterns tab, a one-click Copy action copies any built-in pattern (or an existing custom one) into a new Additional Custom Pattern, carrying over its rules and type so you can adjust them to taste. Built-in patterns show their ratios in a read-only View, while your own custom patterns keep full Edit access. A copied built-in matches the same candidates the original does, so a copy is a working pattern from the moment you make it.
Building a Custom Pattern (Pattern Builder)
Custom patterns are defined in the Pattern Builder, opened when you add or edit an Additional Custom Pattern on the Patterns tab. Rather than a fixed set of four ratio boxes, a custom pattern is a list of plain-language rules you add and remove freely, so you can describe exactly the shape you want and nothing you do not.
Point count
The Points drop-down chooses how many anchor points the pattern has: 3, 4, 5, or 6. Five points is the classic X-A-B-C-D shape; three- and four-point patterns describe shorter structures, and six-point patterns describe longer ones. The list only enables the point counts the detection engine can actually score, with a tooltip explaining any that are unavailable on your current engine.
Rules
Each row is one rule, laid out as columns: Point, Low, High, Of leg, and Measured from. In plain terms, a rule places one point within a Fibonacci range of one leg (for example, "D between 1.272 and 1.618 of the BC leg"). Add rules with + Add rule and remove any rule with its x button.
- Hover or click a rule to see it drawn on the live preview to the right: the points the rule uses are picked out solid, with a dashed line to the point being placed, so you can see what each rule controls.
- An exact ratio is allowed. A rule can state a single value rather than a range, and the builder refuses a rule that could never match — an impossible range is rejected as you write it rather than producing a pattern that silently finds nothing.
- Start from the classic ratios seeds the list with the standard ratios for the chosen point count, giving you a working pattern to adjust rather than a blank slate. (Opening an existing pattern that has no rules yet also seeds from its old ratio definition automatically.)
- + Add advanced rule creates a raw leg-against-leg rule for the rare case where two legs share no point (such as an AB = CD confluence). These rows are marked "advanced".
- Flip mirrors the pattern between bullish and bearish orientation.
The reversal area of a custom pattern
A custom pattern's reversal area is worked out from every rule that places its final point, and the rules are intersected — so a pattern written with four rules produces a tighter area than the same pattern written with three, and a rule that places the last point against any leg counts, not just one particular shape. The same area is used everywhere: on the chart, on the manual drawing tools, in the info panel's Risk figure, in the Market Analyzer, and on the Alerts board. Confirmed patterns, forming patterns, and the unvalidated one-arrow state all draw it.
Colors and the on-chart ratio pills
Each custom pattern has its own Bull Color and Bear Color. On the chart, a rule-based custom pattern shows one ratio pill per rule, placed on the leg that rule measures and carrying the exact number that decided the match — so the pills describe your pattern rather than a fixed set of legs.
Export and import
You can export a custom pattern to a file and import it on another machine (or share it with other traders) from the custom-pattern controls on the Patterns tab.
Custom Pattern Drawing Tools
Alongside automatic detection, the suite ships manual drawing tools — XT Custom 3 Point, XT Custom 4 Point, XT Custom 5 Point, and XT Custom 6 Point — for drawing a custom-pattern shape by hand from the NinjaTrader drawing-tools menu. Each tool can optionally show a small numbered badge on the chart (Tool Number / Show Tool Number) so several tools on one chart are easy to tell apart, and can highlight on hover so pointing at a tool (or at its entry in a menu) makes it stand out.
Pattern Info Panel
The Pattern Info Panel is a floating display that appears on the chart when a pattern is detected, showing live trading metrics for the current pattern. It is toggled by the Show Details checkbox in Chart Display > Pattern Elements.
Metrics Explained
| Pattern Name | The direction and pattern display name, for example "Bullish ETP-0" or "Bearish XTP-2". The display name is configurable on the Patterns tab |
| Bars | The total number of bars that make up the pattern, measured from the first pattern point to the most recent swing point. A small number means a compact pattern; a large number means the pattern spans a long stretch of the chart |
| TTC | "Time To Complete" — a time estimate derived from the pattern's bar count (one third of the total bar span). It is a rough guideline, not a precise countdown |
| TTR | "Time To Reverse" — a time estimate equal to half of TTC (one sixth of the total bar span). Also a rough guideline based on pattern geometry |
| Risk | The distance across the reversal area (midpoint to the far edge), expressed in ticks. This represents the stop distance for the anticipated reversal |
| Reward | The distance from the reversal-area midpoint to the pattern's primary target (the B-point level), expressed in ticks |
| RvR | Reward vs Risk — the ratio of Reward to Risk. A value of 2.0 means the reward distance is twice the risk distance |
Pattern Meter
The Pattern Meter is a pattern-quality score displayed as a segmented color bar and a numeric value out of 10 (for example, 7.5/10). It rates the overall structural quality of the detected pattern.
The score is a weighted blend of four structural factors:
- Total bars in the pattern
- Reversal-area size (how tight or wide the projected D zone is)
- Bars before X (how much prior context the pattern has)
- Leg cleanliness (how clean the swing structure is, graded on the pattern's worst leg)
A higher score indicates a stronger, cleaner structure; a lower score indicates a weaker one. Importantly, the meter is a quality heuristic, not a probability or win-rate — it does not predict whether a trade will be profitable, and it is not a measure of how precisely the Fibonacci ratios match ideal values. Use it as one input alongside your own analysis.
- Higher score — strong, clean pattern structure
- Lower score — weaker structure; treat with extra caution
The bar fills from the Meter Low color at the low end to the Meter High color at the high end (both configurable in Style > Colors). The panel layout is controlled by Info Meter Layout. Enabled Confirmation Filters are scored into this meter as well — see Confirmation Filters.
Panel Controls
- Close button — hides the panel, leaving a small score badge on the chart
- Reopen badge — click the badge to bring the full panel back
- Layout toggle button — switches the panel between Block and Line layouts
- Drag — click and drag the panel (or the badge) to any position on the chart
- Open Info Panel On Load — when enabled, the panel starts expanded each time the indicator loads
Info Meter Layout (Chart Display > Pattern Elements) offers four options:
- Block — the full panel with the pattern name, two stacked rows of metrics, and the meter bar below (tall layout)
- Line — the full panel laid out in a single compact horizontal row
- Mini — only the score badge is shown
- Off — the panel is hidden entirely
The in-panel layout toggle button switches between Block and Line; Mini and Off are selected from the Info Meter Layout drop-down. Pattern Location sets which corner of the chart the panel starts in: BottomLeft, BottomRight, Center, TopLeft, or TopRight.
Reversal Area
The Reversal Area is a colored zone drawn on the chart showing the price range where the D-point is expected to form. For a built-in pattern its price bounds come from the pattern's projected D-point minimum and maximum: for most patterns this is the BC-leg projection (the pattern's BD minimum and maximum Fibonacci ratios applied from the C point). A few retrace-style patterns take one edge from the BC projection and the other from the XA-leg retracement. For a custom pattern, the bounds come from intersecting every rule that places the pattern's final point (see Pattern Builder).
When price enters this zone, the pattern is approaching completion. A bounce or rejection from within this zone is the signal the pattern is designed to identify.
Display toggle: Display Reversal Box (Chart Display > Pattern Elements)
Opacity: the Reversal Box slider in Style > Opacities (default 45)
Fill color: Reversal Area Box in Style > Colors
Reversal Area Mode
The Reversal Area Mode drop-down (Detection > Reversal Area & Gaps) controls the shape of the area:
- Time Based (default) — the area is drawn with a time-limited width and can render an angled (sloped) right edge that follows the pattern's projection
- Price Based — the area is drawn as a full-width, straight horizontal rectangle
Both modes use the same price bounds (the top and bottom of the zone are identical); the mode only changes the horizontal extent and whether the right edge is straight or angled. The setting is honoured everywhere a reversal area is drawn, including the replicas drawn from an Alerts board tile.
Example: On a bullish pattern, the reversal area sits below the current price, marking a zone where buyers are expected to step in. A bullish candle forming within the area, especially near the lower boundary, is the typical entry trigger.
Targets & Fibonacci Levels
XT Patterns draws several categories of forward-looking price levels once a pattern completes at the D-point. Each category can be independently shown or hidden in Chart Display > Pattern Elements.
Pattern Targets
Price-tick labels placed just to the right of the D-point at the pattern's prior swing prices (the A, B, and C levels). These act as natural targets drawn from the pattern's own structure.
Toggle: Show Pattern Targets
Fibonacci Extensions
Fibonacci levels measured across the C-to-D leg of the pattern. The set of levels is configurable in XT Pattern Options; the default levels are 38.2, 61.8, and 127.0.
Toggle: Show Fib Targets | Opacity: the Fib Target slider (default 40)
Retracement Targets
Horizontal lines projected from the D-point at the pattern's retracement levels: the BD (BC-leg) retracements, labeled "x BC", and the XD (XA-leg) retracement, labeled "x XA". These are commonly used as take-profit levels for traders scaling out after an entry at D.
Toggle: Show Retrace Targets
AB Extensions
Fibonacci extensions measured across the A-to-B leg of the pattern. The AB leg extension is a common XABCD calculation used to project additional price targets. The set is configurable in XT Pattern Options; the default levels are 127.0 and 161.8.
Toggle: Show AB Fib Extension | Opacity: the AB Extension slider (default 40)
Potential Patterns
When Show Potential Patterns is enabled (Detection > Pattern Search, on by default), the indicator displays patterns that are still forming — the D-point has not yet been reached, but the earlier legs have completed and the ratios are valid so far.
This gives you advance warning of a pattern that may complete, allowing you to prepare your analysis and price alerts before the entry zone arrives.
What Potential Patterns Show
- The pattern body drawn up to the last confirmed point, with the provisional D-point marked "D?" at the midpoint of the projected reversal area
- The reversal area showing where D is expected to form
- The same target and info-panel metrics as confirmed patterns, when those toggles are enabled
Reading the arrows
A potential pattern carries arrows that tell you how far along it is: two arrows means a pattern that is still forming, and one arrow means a pattern whose rules rejected it. Both draw their reversal area, so you can see the zone either way.
Show All Potential Patterns
Show All Potential Patterns (off by default) widens what is surfaced on both sides at once: the chart draws every eligible forming candidate rather than only the single best one, and the scanner sends a forming candidate to the Alerts board even when a confirmed pattern is already occupying that cell. It is opt-in because it adds chart clutter and extra potential alerts.
Use Price for Potential D
When Use Price for Pot. D is enabled (Detection > Pattern Search, on by default), the current closing price is used as the test price for deciding whether a forming pattern has reached its reversal area. When disabled, the bar's high or low extreme is used instead. Either way, the provisional D point is always drawn at the midpoint of the projected reversal area, not at the live price.
Require Price in Reversal Area
Require Price in Reversal Area (off by default) clears an unconfirmed pattern's Market Analyzer cell the moment price trades away from its reversal area. It is a filter on what the scanner shows rather than a display option, and the chart does not apply it at all — the chart ages its own patterns out on Max Bar Count. It ships off so the chart and the scanner agree out of the box.
Forming patterns are also kept tidy: a potential pattern expires on its own bar span, and is dropped as soon as the scan stops finding it, so stale candidates do not linger on the chart or scanner.
Note: Potential patterns have not completed and carry no confirmation. A pattern displayed as potential may never reach D, or price may pass through D without a reversal. Use potential patterns for awareness and planning, not as standalone entry signals.
Bar Count Rules
Location: Detection > Bar Count Rules
These settings impose minimum bar-count requirements on patterns, filtering out patterns that form too quickly across too few bars — very compressed patterns are often less reliable.
Bars Before X
Use Bars Before X (on by default) — when enabled, the indicator requires a minimum number of bars to exist before the X anchor point. This ensures the pattern has sufficient prior context before it begins.
Bars Before X — the minimum required bars before X (default: 5).
Bars Between Points
Use Bars Between Points (on by default) — when enabled, each individual leg of the pattern (XA, AB, BC, CD) must span more than the configured number of bars.
| Bars Between X-A | Minimum bars from X to A (default: 0) |
| Bars Between A-B | Minimum bars from A to B (default: 0) |
| Bars Between B-C | Minimum bars from B to C (default: 0) |
| Bars Between C-D | Minimum bars from C to D (default: 0) |
With the default value of 0, each leg simply needs to span at least one bar. Increase these values to require larger, more deliberate legs.
Example: On a 4-hour chart where you only want to trade meaningful swing patterns, set bars between each leg to 5. This requires each leg to span more than 20 hours (5 x 4h), filtering out fast patterns that would otherwise appear on your swing chart.
Quality & Confirmation Filters
Beyond the bar-count rules above, XT Patterns can filter and score patterns by the quality of their structure and by optional technical conditions at the D-point. Both live on the Detection sub-tab: Leg Quality Rules and Confirmation Filters (at D).
Leg Quality Rules
A "clean" leg drives directly to its next point; a weak leg wanders sideways or barely moves. This section can drop patterns whose legs are too messy and flags the weak ones so poorly-formed patterns stand out. Leg quality is judged on how straight the connector line runs from one point to the next, rather than on candle-by-candle chop, so a leg that trends cleanly to its point is not penalised for ordinary noise along the way. A pattern is graded on its worst leg, and the info panel can show the per-leg breakdown.
| Require Clean Legs | When on, patterns whose legs wander sideways instead of driving to each point are dropped. Off by default — it is a real filter rather than a display cue, so it is left for you to turn on rather than silently dropping patterns you would otherwise have seen. |
| Min Leg Quality (%) | How clean a leg must be to pass (default: 25). Higher values demand straighter, more decisive legs; lower values are more forgiving. |
| Weak-Leg Min Bars | A leg with fewer than this many bars is treated as cramped (too fast) and flagged as weak. |
| Weak-Leg Min Slope (ATR) | A leg that moves less than this amount, measured in ATR (default: 0.5), is treated as near-flat and flagged as weak, even if it spans enough bars. |
| Leg Straightness Weight (0-1) | How much of the quality score comes from the straightness of the leg as opposed to its other properties (default: 0.8). |
Weak legs are drawn in a distinct highlight color so you can see at a glance which part of a pattern is poorly formed: a leg that is cramped in bars is flagged, and a leg that barely moves relative to ATR is flagged in white as well. Leg cleanliness also feeds the Pattern Meter score whether or not Require Clean Legs is on.
Confirmation Filters (at D)
The Confirmation Filters are optional quality checks applied when a pattern confirms at the D-point. Every enabled filter is scored into the Pattern Meter on the chart and in the Market Analyzer, so you can see how well a setup lines up with your own criteria. Turning on Require filters to pass additionally holds back alerts (board, sounds, and automation) for confirmed patterns that fail an enabled filter — chart drawings are never suppressed, so you still see every pattern.
Each condition is evaluated the same way for bullish and bearish patterns unless you choose a direction-aware mode (see below). Set the filters for the way you personally trade; none are required, and all are off until you enable them. This section is available on accounts whose licence carries the Confirmation Filters feature.
| Volume at D | Scores above-average volume on the D pivot bar. Volume Lookback (bars) sets the baseline window (default 20); Volume Multiplier is the multiple of average volume the D bar must reach to pass (default 1.0 = above average). |
| RSI Divergence at D | Scores RSI divergence between D and the prior same-side pivot, using the configured RSI Period (default 14). |
| Close in Reversal Area | Scores whether the confirmation bar actually closes inside the pattern's reversal area. |
| Moving Average at D | Compares the D bar's close to a moving average, or checks the MA's slope. Set MA Type (EMA, default, or SMA), MA Period (default 20), and MA Condition (price above / below the MA, or MA slope up / down, plus direction-aware variants). |
| MACD at D | A MACD histogram or signal-line condition at D. Set MACD Fast (default 12), MACD Slow, MACD Signal, and MACD Condition (histogram positive / negative, bullish / bearish cross, plus direction-aware variants). |
| ADX at D | Only confirms when trend strength (ADX) at D is at or above your threshold. Set ADX Period and ADX Threshold. |
| RSI Level at D | Only confirms when RSI at D is below or above a level (distinct from RSI divergence). Set RSI Level Period, RSI Level, and RSI Level Comparison (below / above, plus direction-relative oversold-for-bull / overbought-for-bear modes). |
Direction-Aware Modes
The Moving Average, MACD, and RSI Level conditions each offer direction-aware options (for example "with direction" or "against direction"). These flip automatically by pattern direction, so a single setting reads correctly for both bulls and bears. For instance, an RSI Level set to "oversold for bull, overbought for bear" at level 30 requires RSI below 30 on a bullish pattern and above 70 on a bearish one. Set the condition once and it applies sensibly to both sides.
Minimum Meter Score
The Pattern Quality Filter lets you hide low-quality patterns outright. Set a Minimum Meter Score (0-10) and any pattern whose Pattern Meter score falls below it is not drawn. Set it to 0 to disable filtering and show every pattern regardless of quality. The Alerts board has its own Min meter control that filters the board without changing what the chart draws.
Example: Set the Minimum Meter Score to 6 to keep only the cleaner-structured setups on a busy chart, then combine it with a couple of Confirmation Filters (say Volume at D plus Close in Reversal Area) with "Require filters to pass" on, so your alerts only fire on patterns that both score well and meet your technical checks.
Style Settings
Location: the Style sub-tab of General Settings. An Appearance preset picker at the top applies a coordinated set of colors, line styles and opacities in one step; everything below can then be adjusted individually.
Opacities
Every visual layer of the pattern has an independent opacity slider (0 = fully transparent, 100 = fully opaque). This allows fine-grained control over visual density when multiple indicators share a chart.
| Pattern Body | Transparency of the pattern's shaded polygon fill (default: 40) |
| Pattern Body Gradient: Direction (°) | Angle of the gradient fill in degrees, 0 to 360. 90° = vertical (default), 0° = horizontal, 45° = diagonal |
| Pattern Body Gradient: Spread | How dramatic the gradient variation is, 0 to 50. 0 = flat/solid fill; 50 = high-contrast gradient (default: 25) |
| Reversal Box | Transparency of the reversal area box (default: 45) |
| Time Extension | Transparency of the time extension lines (default: 40) |
| Fib Target | Transparency of the Fibonacci extension target lines (default: 40) |
| AB Extension | Transparency of the AB Fibonacci extension lines (default: 40) |
| Ratio | Transparency of the ratio measurement text (default: 40) |
Colors
The following elements have individually configurable colors in Style > Colors:
- Pattern Text — text color inside the info panel
- Anchor Text — color of the X, A, B, C, D point letters
- Anchor Label BG — background color of the pill drawn behind each anchor letter
- Fib Level Text — color of the Fibonacci extension level labels
- Retrace Text — color of the retracement level labels
- Ratio Text — color of the ratio measurement text on each leg
- Meter Low — color at the low end of the Pattern Meter bar
- Meter High — color at the high end of the Pattern Meter bar
- Reversal Area Box — fill color of the reversal area rectangle
Per-pattern bullish and bearish colors are set on the Patterns tab, not here — including one bull and one bear color for each custom pattern.
Lines
Each line type in Style > Lines has a configurable color (Brush), dash Style, Width, and Opacity:
- Fib — the Fibonacci target lines
- Ratio Pill — the pill drawn behind the ratio labels
- Ratio Connector Line — the diagonal lines connecting the pattern points (X-B, A-C, B-D, D-X)
- Retrace — the retracement target lines
- Anchor — the anchor line before the bars-before-X requirement is met
- Anchor Count — the anchor line after the bars-before-X requirement is satisfied (the validated anchor line)
- Pattern — the outline stroke of the pattern body
Fonts
Each text element in Style > Fonts has a configurable Family, Size, Bold, and Italic:
- Fib Font — font for the Fibonacci level labels
- Retrace Font — font for the retracement level labels
- Ratio Font — font for the ratio measurement text
- Anchor Font — font for the X, A, B, C, D letters (also used for the on-chart pattern name label)
- Meter Font Size — the base font size for the info panel and meter text. This is an absolute point size (roughly 6 to 36, default 9), not a multiplier
Labels & Text, just above Lines, holds Fib Text Alignment (Left, Right, or Center) for the Fibonacci level text.
Detection & Chart Display Settings
Detection > Pattern Search
| Deviation (ticks) | Controls the Fibonacci ratio tolerance in ticks. A higher value allows more deviation from ideal ratios; a lower value requires stricter adherence (default: 12) |
| Max Bars Back | How many historical bars to scan for patterns (default: 300). Increase for more history; decrease to improve performance on very active charts |
| Min Pattern Size | Minimum bar distance required between pattern points (default: 30). Increasing this filters out small, compressed patterns |
| Max Bar Count | How many bars a completed pattern stays on the chart before it ages off (default: 10). This default matches the Market Analyzer scanner so the chart and the scanner find the same patterns; the scanner also auto-aligns to the chart and flags any remaining differences |
| Use Current Bar | Includes the currently forming bar in the Real-Time Engine's calculations (default: on) |
| Engine Type | Real-Time Engine (default) or Confirmation Engine — see Detection Engines |
| Show Potential Patterns | Displays still-forming patterns (default: on) — see Potential Patterns |
| Show All Potential Patterns | Surfaces every eligible forming candidate on the chart, and lets the scanner send one to the board even when a confirmed pattern occupies the cell (default: off) |
| Use Price for Pot. D | Uses the closing price to test reversal-area entry on potential patterns (default: on) |
| Require Price in Reversal Area | Clears an unconfirmed pattern's scanner cell once price trades away from its reversal area (default: off; scanner only) |
| Replicate Market Analyzer Patterns | When on (default), clicking an alert draws that pattern on the chart as a replica, marked so it is distinguishable from a pattern the chart found itself |
Detection > Reversal Area & Gaps
| Reversal Area Mode | Time Based (default) or Price Based — see Reversal Area |
| Gap Percent | Advanced tolerance value used in pattern detection |
Chart Display > Pattern Elements
| Draw On Top | When enabled, patterns render in front of other chart elements (default: on) |
| Show Pattern Name | Shows or hides the pattern name label drawn on the chart |
| Show Last Pattern Only | When enabled, only the most recently detected pattern is shown. When disabled, all detected patterns within the lookback window are drawn (default: on) |
| Show Details | Shows or hides the floating pattern info panel |
| Show Fib / Pattern / Retrace Targets, Show AB Fib Extension | The target-level toggles — see Targets & Fibonacci Levels |
| Pattern Location | The corner of the chart the info panel starts in: BottomLeft, BottomRight, Center, TopLeft, or TopRight |
| Info Meter Layout | The info panel layout: Block, Line, Mini, or Off — see Pattern Meter |
| Open Info Panel On Load | When enabled, the info panel starts expanded each time the indicator loads (default: on) |
| Display Reversal Box | Shows or hides the reversal area |
Chart Display > XT Pattern Options
A nested group inside Pattern Elements, holding the equivalent toggles for the XT pattern types plus the level sets and number formats:
| Show Pattern Name, Show Fib Targets, Show Pattern Targets, Show Retrace Targets, Show AB Fib Extensions | The same visibility toggles, applied to the XT pattern types |
| Show XD Time Ext | Draws the XD time extension |
| Show Time Ratios | Draws the time-ratio labels |
| Show AB Fib Option | Enables the AB Fibonacci option for these patterns |
| Fib Format / Pattern Format | How the Fibonacci and pattern target numbers are formatted on the chart |
| AB Targets / Fib Targets | The level sets themselves — AB defaults to 127.0 and 161.8, Fib to 38.2, 61.8 and 127.0 |
Chart Display > Time Extensions
| Time Extension 1 / 2 / 3 | Time-projection factors (each with its own color) used to extend the reversal area and time markers forward |
Templates
The Template selector lets you apply a saved XT Patterns configuration to a chart. It is available both in NinjaTrader's standard indicator Properties dialog (under the General settings group) and in the XABCD Properties window's toolbar.
Selecting a Template
Choose a saved template from the drop-down. The selected template applies its settings to that chart. Templates are applied per chart, so each chart can use a different template at the same time. Leave the selection empty to use your default settings.
What a Template Captures
A template stores a full XT Patterns configuration, including:
- Enabled and disabled pattern types, and your custom patterns
- Detection engine selection and detection values
- Style settings (opacities, colors, line styles, fonts)
- Bar count rules and leg quality rules
- Chart display settings (panel layout, target toggles, time extensions)
Example Use Cases:
- "Swing" — Variations 1 to 4 only, a large Min Pattern Size, stricter bar-count rules, muted opacities for a clean chart
- "Scalp" — all variations, a small Min Pattern Size, light rules, high opacities for quick visual scanning
- "Review" — all patterns shown, Confirmation Engine, Show Last Pattern Only turned off so history stays visible
Market Analyzer (Scanner & Alerts)
XT Patterns can scan many instruments and timeframes at once inside NinjaTrader's Market Analyzer window. Rather than building that grid by hand, the indicator includes a Market Analyzer Template Builder that generates a ready-to-load Market Analyzer template for you.
Location: the Scanner & Alerts tab of the XABCD Properties window (Control Center > New > XABCD Suite > XABCD Patterns, then click the Scanner & Alerts tab).
Adding Timeframes
Each row in the builder becomes one column in the Market Analyzer grid. The builder starts with a common set of rows (100T, 300T, 5M, 15M, 30M, 60M, 240M, 1D), which you can edit, reorder, or remove.
To add a chart type or timeframe:
- In the Add Chart Type row, choose a period type from the drop-down (Tick, Volume, Range, Second, Minute, Hour, Day, Week, Month, Renko, Point and Figure, Kagi, Line Break, or Heiken Ashi)
- Enter the period value (for example, 5 for a 5-minute column)
- Click Add
Presets add a ready-made set of timeframes in one click:
- Default — 100T, 300T, 5M, 15M, 30M, 60M, 240M, 1D
- Scalping — 100T, 300T, 1M, 5M
- Swing — 60M, 240M, 1D, 1W
- Multi-TF — 5M, 15M, 60M, 1D
Per-row options (each row in the list):
- Checkbox — include this row in the generated template (only checked rows are exported)
- Color swatch — set a custom color for the column (enable Custom Colors first)
- Name — the column header text (editable)
- Source — XT Patterns, or any installed NinjaTrader indicator (RSI, ATR, and so on). The gear button edits a non-XT indicator's parameters; XT Patterns parameters come from the Patterns and General Settings tabs
- Plot Type — for XT Patterns columns: PatternValue, RiskVsReward, Risk, Reward, TotalBars, or MeterScore. For other indicators: which of that indicator's plots to show
- Bars and Days — how much data each column loads (bars to load and days back)
- Type badge — the bar period type for that row
- Duplicate / Move up / Move down / Remove — row actions
- Bell and square buttons (XT Patterns rows only) — per-row alert toggles, bell for audio and square for popup (see Alerts below)
Potential patterns: the Potential Patterns button toggles whether still-forming patterns are included in the scan. The Potential Opacity slider (Grid Settings) dims those cells so they stand apart from completed patterns.
Live Preview shows how the resulting grid will look, including the column headers, sample values and the colors that will actually be generated — custom patterns included. It refreshes as you edit a custom pattern, so you can see the effect immediately.
Grid Settings (collapsible) control the generated grid: Max Rows, Font Size (default 18), Auto Sort, Highlight (ms) for how long a changed cell flashes (default 500), Max Bar Count (default 10, and the same setting as Detection's Max Bar Count), Potential Opacity (default 40), and Grey pattern cells for a plainer dark-grey grid instead of per-pattern colors.
Generating & Loading a Template
- Make sure the rows you want are checked
- Enter a file name in the box at the bottom (the default is "XABCD MarketAnalyzer")
- Click Generate Template
The template is saved as an .xml file in NinjaTrader's standard Market Analyzer template folder:
Documents\NinjaTrader 8\templates\MarketAnalyzer\<name>.xml
The status line confirms with "Saved: <name>.xml".
To load it in the Market Analyzer window:
- In the NinjaTrader Control Center, click New > Market Analyzer to open a Market Analyzer window
- Right-click anywhere in the grid and choose Templates > Load
- Select the template you generated and confirm
- Add the instruments you want to scan (right-click > Instruments..., or add an instrument list)
The template provides the scanner columns and grid appearance; you choose which instruments populate the rows. If you change your XABCD pattern settings later, a drift banner appears at the top of the Scanner & Alerts tab listing exactly what changed, along with the remedy for each item; click Regenerate Template and reload it in the Market Analyzer.
Sync Checker (collapsible) lets you pick an existing Market Analyzer template (.xml) and compare its embedded XT Patterns settings against what would be written today, reporting a match (green), a list of differences (amber), or a read error (red).
Alerts
Each XT Patterns row has two per-row alert toggles: the bell (audio alert on or off) and the square (popup alert on or off). Both are on by default. Set them per timeframe so that, for example, only your higher timeframes play a sound. New patterns can also be read aloud (text-to-speech), on by default, and a Test Alert button on the Alerts board previews your configured sound and popup so you can confirm they work before relying on them.
Per-pattern audio alerts are configured in the Alert Settings area, where each pattern type can carry its own sound.
All XABCD alert sounds are played through one shared queue, so multiple alerts firing at once no longer talk over each other, and a sound is kept alive until it finishes rather than cutting off mid-playback.
The XABCD Alerts Board
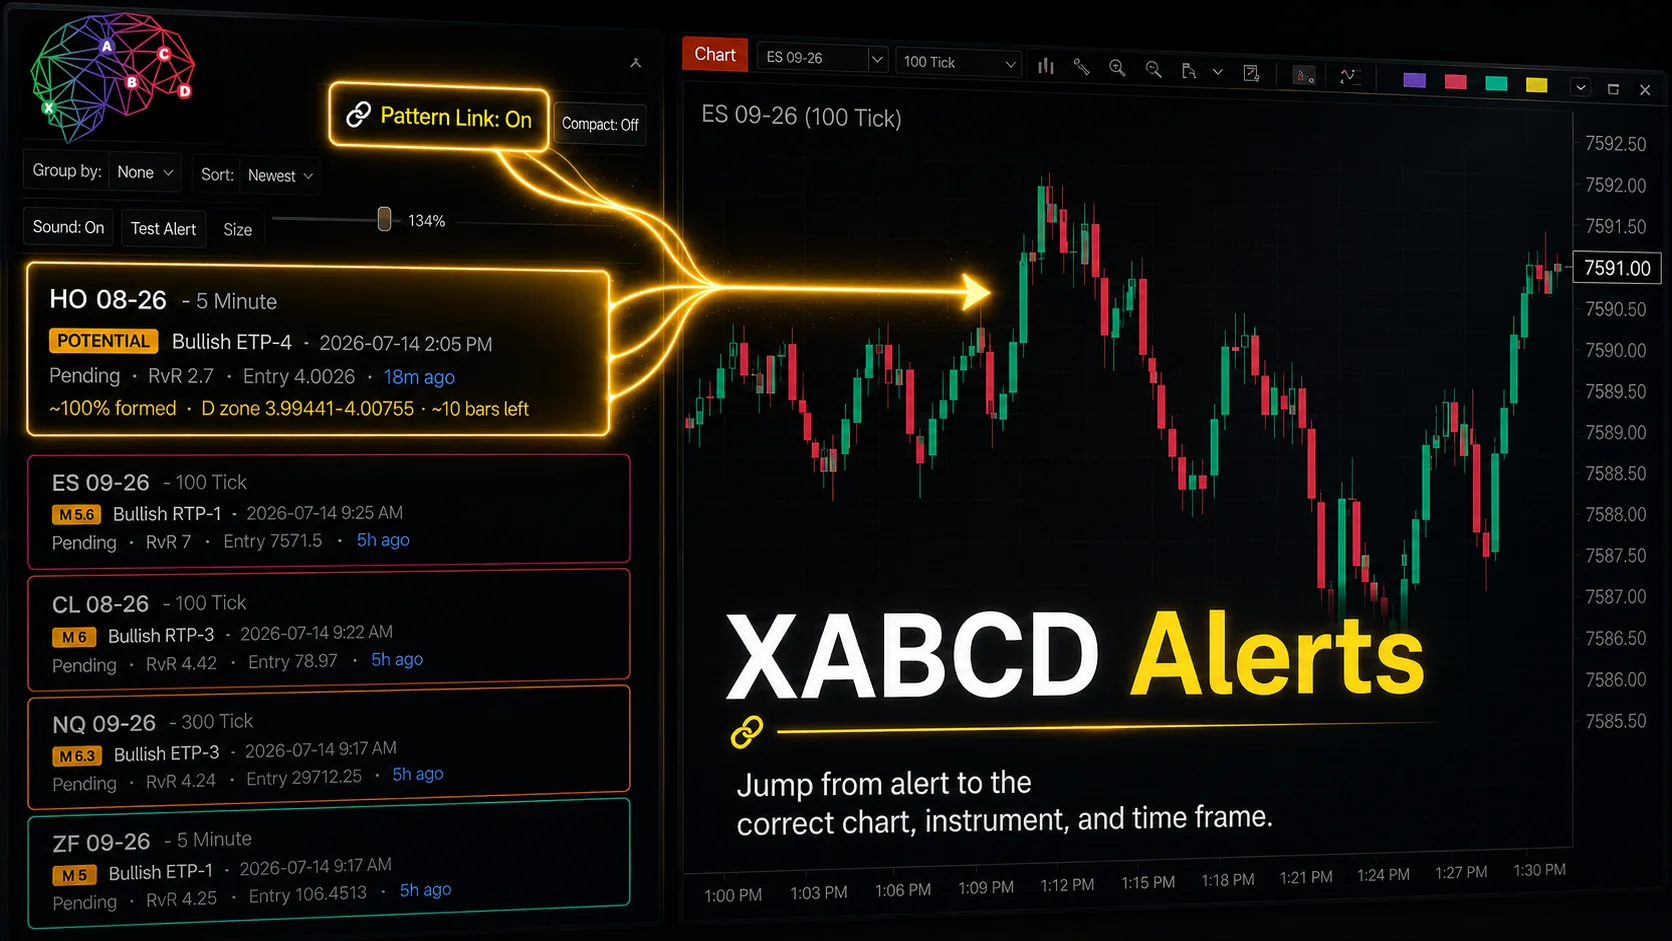
Confirmed patterns — and forming ones, when Show Potential Patterns is on — arrive as tiles on the XABCD Alerts board. Click a tile to draw that pattern on a chart; if the pattern cannot be drawn, the board explains why rather than doing nothing.
Narrowing the board
- Group by — group the tiles by none, priority, day, instrument, pattern, timeframe, or direction. Click a group header to collapse it and click again to open it; the header keeps its count either way. Collapse all / Expand all next to Group by does the whole board at once, and what you collapsed is remembered the next time you open the board.
- Sort — newest or oldest first.
- Min meter — hide tiles below a meter score.
- Periods — a checklist of the timeframes currently on the board. Untick one to hide its tiles.
- Instruments — the same idea for instruments, with All and None buttons.
- Stages — show or hide Confirmed, Unconfirmed and Potential patterns independently.
- Live mode — show only alerts whose pattern is still live on the chart.
When a filter hides everything, the board says so and names the filters responsible, rather than going blank.
Working with tiles
- Pin — click the star in a tile's top-right corner (or Pin to top in its right-click menu) to sort that alert to the top and keep it there. A pinned tile survives every Clear, auto-clear, the retention window and Live mode; the other filters still apply. If the pattern behind a pinned tile is gone, the tile dims rather than disappearing.
- Pattern Link — each new alert auto-selects and navigates any tab-linked chart to that pattern's instrument and interval.
- Compact — a single-line tile layout, so more alerts fit in the window.
- Zoom — scales the tiles' text, badges and meters together.
- Coalesce — when on, a live re-evaluation of a pattern already on the board updates its existing tile instead of adding a new one.
- Sound — a board-local quick mute for audio alerts.
- Clear all / Clear pinned / Clear read / Clear older than, plus Auto-clear — housekeeping for a busy board.
- Confluence badge — a tile is badged when the same pattern is alerting on more than one timeframe.
Remote Alerts (Pushover)
Alerts can also be pushed to your phone. In Remote… you can add a Pushover push channel so a new pattern reaches your mobile device through the Pushover app, in addition to the on-screen board, sounds, and popups.
The board's bottom tab strip switches between the Alerts list and the AI Reports tab (see AI Pattern Analysis).
AI Pattern Analysis & Pattern Database
Detected patterns appear as tiles on the XABCD Alerts board. From a tile you can run a Pattern Database look-up that opens a full visual report of the setup, and you can run free look-ups that show how similar historical patterns actually resolved. These features are entirely optional and are presented as educational structure analysis, not trading advice or a prediction of results.
Two kinds of action live on a tile. Look up in Pattern Database (the written visual report) spends one credit, and the menu item says so. The other Pattern Database tools — View similar patterns and the stop/target optimizer — are free: they read historical data only, with no model call and no credit. All of these windows open modeless, so they never freeze the board while you keep working.
Running an Analysis
To analyze a pattern, right-click its tile and choose Look up in Pattern Database… (1 credit). The indicator sends the pattern's geometry away for analysis and returns a written breakdown together with a set of visuals.
- Runs in the background — the analysis is asynchronous, so the board stays responsive while it works, and you can cancel it. If you cancel, or it takes too long and times out, no credit is spent (any reserved credit is refunded automatically).
- AI Reports tab — finished reports are collected on a dedicated AI Reports tab on the board and saved to disk, so you can reopen any of them later at no cost (reopening a saved report makes no server call and spends no credit). Clear all reports removes the saved set. A small purple badge appears on any tile that already has a report.
- Real patterns only — a test or incomplete alert with no instrument cannot be analyzed; the board tells you so in the same window and no credit is spent.
Reading the Visual Report
The report window has three parts: a visual panel at the top, a written analysis below a draggable divider, and an action bar at the bottom. Drag the divider to give more room to the visuals or to the text.
The verdict header
- Structure score gauge — a gauge captioned "structure score" that rates how well-formed the pattern's geometry is. This is a structure rating, not a win probability or a confidence that a trade will profit.
- Grade stamp — a letter grade derived from the structure score, shown as A-GRADE (green), B-GRADE (yellow), C-GRADE (orange), or D-GRADE (red). The grade colors are fixed so a "B" looks the same in every screenshot, video, and support ticket.
- Factor scorecard — the individual structural factors that fed the grade, so you can see why a pattern scored the way it did.
History charts (when comparable data exists)
When the Pattern Database holds enough similar historical setups, the report adds a set of study charts drawn from them:
- How far similar patterns ran (R) — a histogram of how far comparable historical patterns travelled, measured in R multiples, with the target marked.
- Typical path from here — a projection cone showing the typical favorable and adverse excursion (in R) that similar setups experienced from the D-point.
- Time to resolve — how many bars similar setups typically took to reach their outcome, including the median.
- Illustrative levels — an entry / stop / target ladder derived from how similar patterns actually resolved.
The written breakdown
Below the divider, the SUMMARY section holds the written analysis, rendered as formatted text (headings, bold, and bullet points). It reads defensively and, if the response is unexpected, fails with a clear message rather than erroring out.
Action bar
- Apply to Position Tool — pushes the report's illustrative entry, stop, and target onto an XABCD Position Tool on the chart, so you can see the levels in context. (Available when this feature is enabled for your account.)
- Share card — builds a compact, branded results card (the summary, the structure-score gauge, the grade stamp, the factor scorecard, and the how-far-they-ran histogram), copies it to the clipboard, and saves it as a PNG under
Documents\NinjaTrader 8\XABCD\AiCards— handy for sharing a screenshot. - Export — saves the full visual report as a PNG image.
- Copy to Clipboard — copies the written analysis text.
- Close — closes the window (the report stays saved on the AI Reports tab).
A disclaimer is always visible at the bottom of the report, including on saved reports and the exported card: the analysis is for education only, not financial advice, and pattern grades and historical statistics describe the past — they do not predict or guarantee future results. Trade at your own risk.
Credits
The written analysis runs on credits, shown as a small battery gauge on the alerts board. Each completed analysis spends one credit; the free Pattern Database look-ups (View similar patterns, the optimizer) never do.
- Buy credits — the Buy Pattern Database credits button opens the credit-pack product page on the XABCD Trading shop. At zero credits the gauge itself becomes the buy button.
- Re-check balance — a small refresh control sits next to the gauge. Use it right after buying credits if the gauge still shows none, to re-query your balance immediately. The balance also refreshes automatically when the board regains focus.
- No credit wasted — a cancelled or timed-out analysis, or a click on a test/empty alert, never spends a credit.
Pattern Database Insights
The Pattern Database is a shared, anonymized pool of graded historical patterns. Only anonymized pattern data — instrument, timeframe, geometry, and outcome — is ever involved; no account or license key is attached. When it is available for your account, tiles gain a few study tools drawn from it, all free of credit:
- View similar patterns — right-click a tile to see the nearest historical formations to this one, so you can study how comparable setups played out.
- Optimize stop / target — suggests stop and target placement based on how similar graded patterns actually resolved (their real excursions), shown in the same report-style window.
- PAST HITS badge — a tile is flagged with a ★ PAST HITS badge (for example, 62% over 18, meaning 62% of 18 similar past patterns reached target) when the historical record for that kind of setup is strong. The edge is judged on expectancy rather than a flat win-rate, and low-sample slices are shrunk so a handful of noisy matches cannot flash a confident badge.
These tools need a minimum amount of comparable, graded history to work. Until there is enough similar data with outcomes, the board says so rather than showing a misleading edge. As with the written report, the badge and its numbers are historical and for study only — past results do not predict or guarantee future outcomes.
Practical Examples
Example 1: First-Time Setup for Day Trading
- Add XT Patterns to a 5-minute ES chart
- Open the settings window (Control Center > New > XABCD Suite > XABCD Patterns)
- On General Settings > Detection > Pattern Search, set Engine Type to Real-Time Engine
- On the Patterns tab, enable Variations 1 to 4 only; leave 4 Point and 6 Point off until familiar
- Set Min Pattern Size to suit a 5-minute chart (smaller values allow more patterns)
- On Chart Display > Pattern Elements, enable Display Reversal Box and Show Details
- When a pattern appears, read the RvR in the info panel and only consider trading if it meets your minimum (for example, 1.5 or higher)
Example 2: Using the Pattern Meter for Trade Selection
- Two patterns appear at the same time on the chart
- Pattern A has a meter score of 8.5/10 and RvR of 2.1
- Pattern B has a meter score of 4.2/10 and RvR of 3.5
- Pattern A's higher quality score suggests a cleaner, more reliable structure — a reasonable primary candidate despite the lower RvR
- Treat Pattern B as a secondary watch, and remember the meter is a quality heuristic, not a probability
Example 3: Filtering With Bar Count Rules
Scenario: You trade 1-hour charts and only want patterns with meaningful leg structure.
- On Detection > Bar Count Rules, enable Use Bars Between Points
- Set each leg minimum to 5 bars (each leg must then span more than 5 hours)
- Enable Use Bars Before X and set Bars Before X to 10 for additional prior context
- Optionally turn on Require Clean Legs in Leg Quality Rules to drop patterns whose legs wander
- Result: only patterns with substantial swing structure appear
Example 4: Planning Ahead with Potential Patterns
- Show Potential Patterns is on by default; confirm it in Detection > Pattern Search
- A potential pattern appears, with the reversal area shown around 4490 to 4498
- Set a price alert near 4495 (the center of the reversal area) in NinjaTrader
- When the alert triggers, the pattern may be completing — check the info panel for the updated metrics before considering an entry
Example 5: Using All Targets for a Scaling Exit Plan
- On Chart Display > Pattern Elements, enable Show Pattern Targets, Show Fib Targets, and Show Retrace Targets
- After completion at D, multiple levels appear (for a bullish pattern): retracement lines, the pattern's swing-price targets, and the Fibonacci extension levels
- Scale out across those levels according to your plan
- Use the Risk value from the info panel to gauge your stop distance from the reversal area
Example 6: Keeping a Busy Alerts Board Readable
- Set Group by to Instrument, then click Collapse all so the board is a short list of headers with counts
- Open just the instrument you are working on
- Pin the one or two alerts you are actually watching, so they stay at the top and survive a Clear
- Use Min meter and the Stages checklist to keep only what you trade
- Your collapsed groups are remembered, so the board opens the same way next time
Example 7: Studying a Setup with the Pattern Database
- When a pattern arrives on the XABCD Alerts board, right-click its tile and choose Look up in Pattern Database
- Read the structure-score gauge and letter grade to gauge how well-formed the geometry is (remember this rates structure, not the odds of a winning trade)
- If history charts appear, look at how far similar patterns ran and how long they took to resolve
- Use View similar patterns (free) to browse the closest historical formations, and the optimizer for illustrative stop/target ideas
- Optionally click Apply to Position Tool to drop the illustrative levels onto the chart, then adjust them to your own plan
Troubleshooting
No Patterns Appearing
- Verify at least one pattern type is enabled on the Patterns tab
- Check that Max Bars Back is large enough for the current timeframe (try increasing it)
- Reduce Min Pattern Size — if set too high, all detected patterns may be filtered out
- Increase Deviation (ticks) slightly — if set too low, the indicator may not find patterns within tolerance
- If Require Clean Legs is on, try turning it off or lowering Min Leg Quality
- Confirm the chart has enough historical data loaded
Too Many Patterns Appearing
- Enable Show Last Pattern Only to show just the most recent
- Increase Min Pattern Size to require larger swings between points
- Reduce the number of enabled pattern types (disable 4 Point, 6 Point, and the XTP types)
- Turn off Show All Potential Patterns if it is on — it draws every eligible forming candidate rather than the best one
- Enable the bar count rules to require minimum bars between each leg
- Reduce Deviation (ticks) for stricter ratio matching
A Custom Pattern Never Appears
- Check the rules in the Pattern Builder — the builder refuses a range that can never match, but a very narrow one may simply be rare
- Confirm the pattern is enabled on the Patterns tab, and that its point count is supported by the engine you are running
- A custom pattern's reversal area comes from the rules that place its final point; if you removed all of them, there is nothing left to project
Pattern Info Panel Not Visible
- Confirm Show Details is enabled in Chart Display > Pattern Elements
- Confirm Info Meter Layout is not set to Off
- The panel may have been closed — look for the small score badge on the chart and click it
- Enable Open Info Panel On Load so it reopens automatically on chart reload
Pattern Meter Shows a Low Score
- A low score means the pattern's structure scores poorly on the quality factors (bar count, reversal-area size, prior context, leg cleanliness — graded on the worst leg). It is still a valid pattern, but the structure is weaker. Treat it with extra caution and confirm with your own analysis.
Reversal Area Not Showing
- Enable Display Reversal Box in Chart Display > Pattern Elements
- Check that the Reversal Box opacity is greater than 0 in Style > Opacities
The Chart and the Scanner Disagree
- Check the drift banner at the top of the Scanner & Alerts tab — it lists exactly what differs and what to do about each item, then click Regenerate Template and reload it in the Market Analyzer
- Use the Sync Checker to compare a saved template against what would be written today
- Max Bar Count is one setting shared by both, so a chart and a scanner set differently will age patterns off at different times
- Require Price in Reversal Area applies to the scanner only, never to the chart
Potential Patterns Showing but No Completed Patterns
- This is normal when the market has not yet formed a complete D-point. Potential patterns are expected to disappear if price moves away from the projected D zone without completing.
- To see only confirmed patterns, disable Show Potential Patterns.
Alerts Board Looks Empty
- If the board says alerts are hidden by filters, it names the filters doing it — check Stages, Periods, Instruments, Min meter and Live mode
- If Group by is on, a group may simply be collapsed; its header still shows the count. Click Expand all to open everything
- Auto-clear and the Clear older than age remove tiles on their own; pin anything you want kept
Analysis or Credits
- If the credit gauge shows none right after buying, click the small refresh control next to the gauge to re-check your balance.
- A cancelled or timed-out analysis does not spend a credit; if one seems to have been reserved, it is refunded automatically.
- If a tile cannot be analyzed, confirm it is a real detected pattern with an instrument — test or incomplete alerts cannot be analyzed and cost nothing.
- If "View similar patterns", the optimizer, or the PAST HITS badge do not appear, there is not yet enough comparable graded history for that kind of setup.
Indicator Slowing Down the Chart
- Reduce Max Bars Back
- Switch to the Confirmation Engine to reduce intrabar recalculation
- Disable Show Potential Patterns, and Show All Potential Patterns in particular — potential pattern calculations add additional processing load
XT Patterns Documentation — Version 1.7.0.72
For support and updates, visit XABCDTrading.com