XABCD TRADING

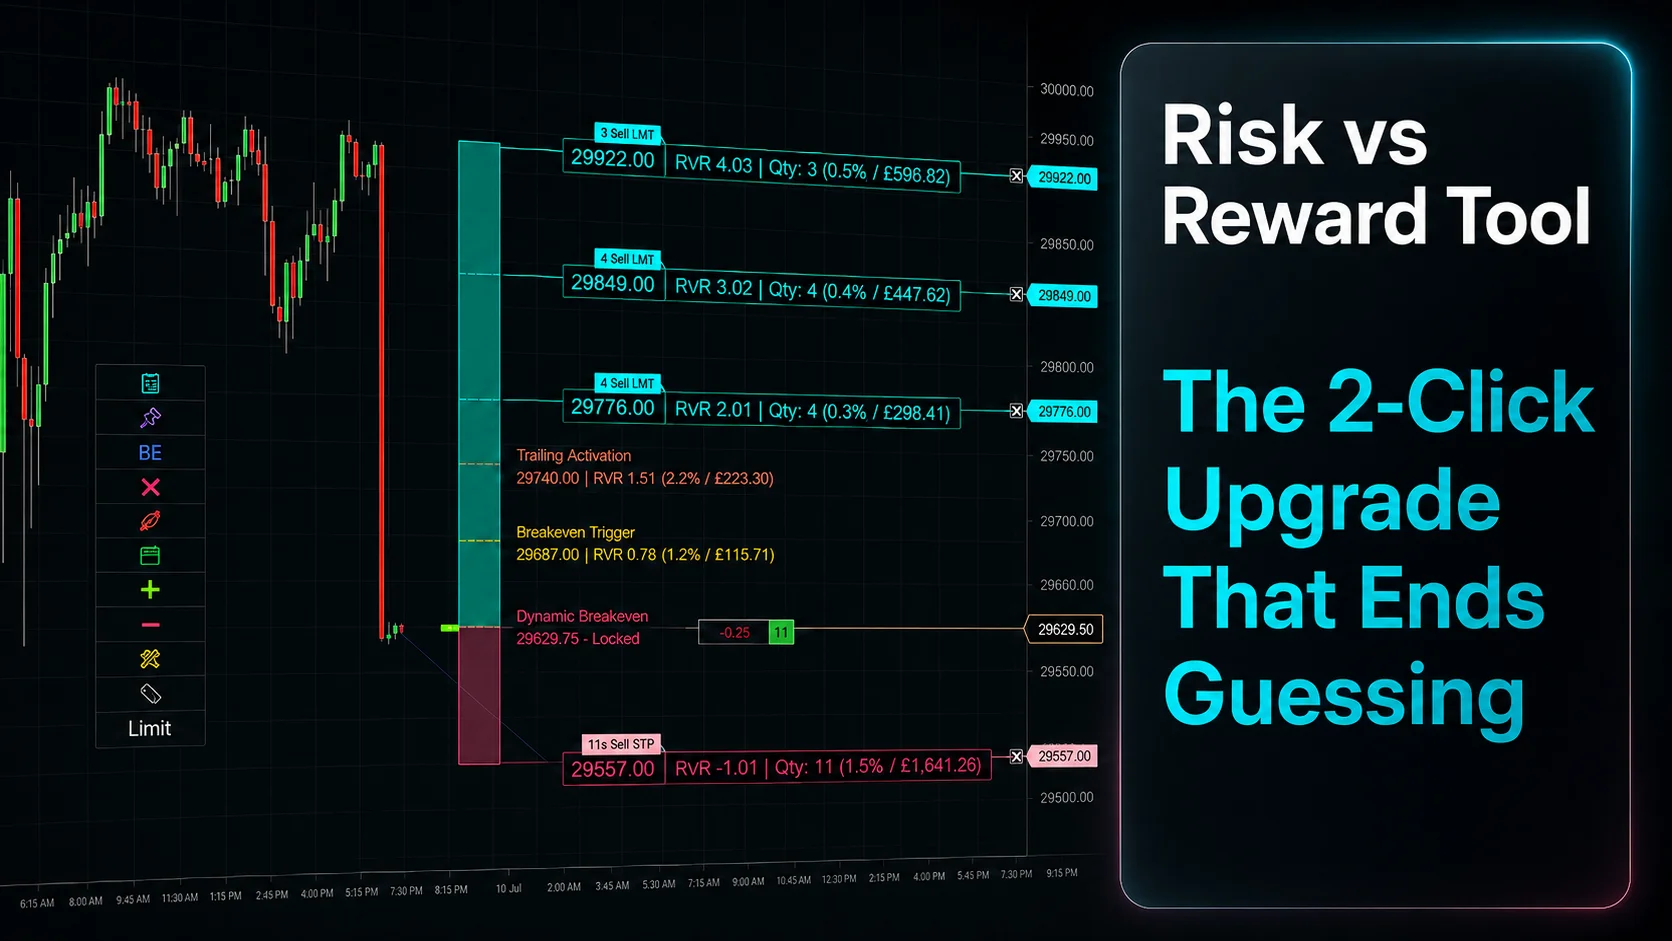
Risk vs Reward Tool: The 2-Click Upgrade That Ends Guessing
Subscribe
to get alerts to our next blog post!
A risk vs reward tool is the software that sits between your trade idea and your order entry. Its only job is to make the size you send match the risk you actually meant to take. Most traders treat it as a calculator they glance at before pulling the trigger. That framing is exactly why they keep getting burned. Done right, a risk vs reward tool is not a number you consult. It is the engine that draws the trade on your chart, sizes it from your risk, and submits the real bracket order. The plan on your screen and the position in your account finally agree.
This piece explains what that tool actually is, how the risk-reward ratio underneath it works, and why the version most traders settle for—a colored rectangle—is barely half of one. The concrete examples come from the XABCD Position Tool for NinjaTrader 8.
What a Risk vs Reward Tool Actually Does
A risk vs reward tool is not something you glance at before a trade. It is the mechanism that refuses to let you take the trade at the wrong size. Understanding that distinction changes everything about how you manage entries.
Consider the practical difference. A calculator waits for you to type in numbers—entry, stop, account size, risk percent—and hands back a contract count. You then re-key that count by hand into an order ticket. Every one of those steps is a place to fat-finger a digit or round in your head. A real risk vs reward tool collapses the whole chain into two clicks on the chart.
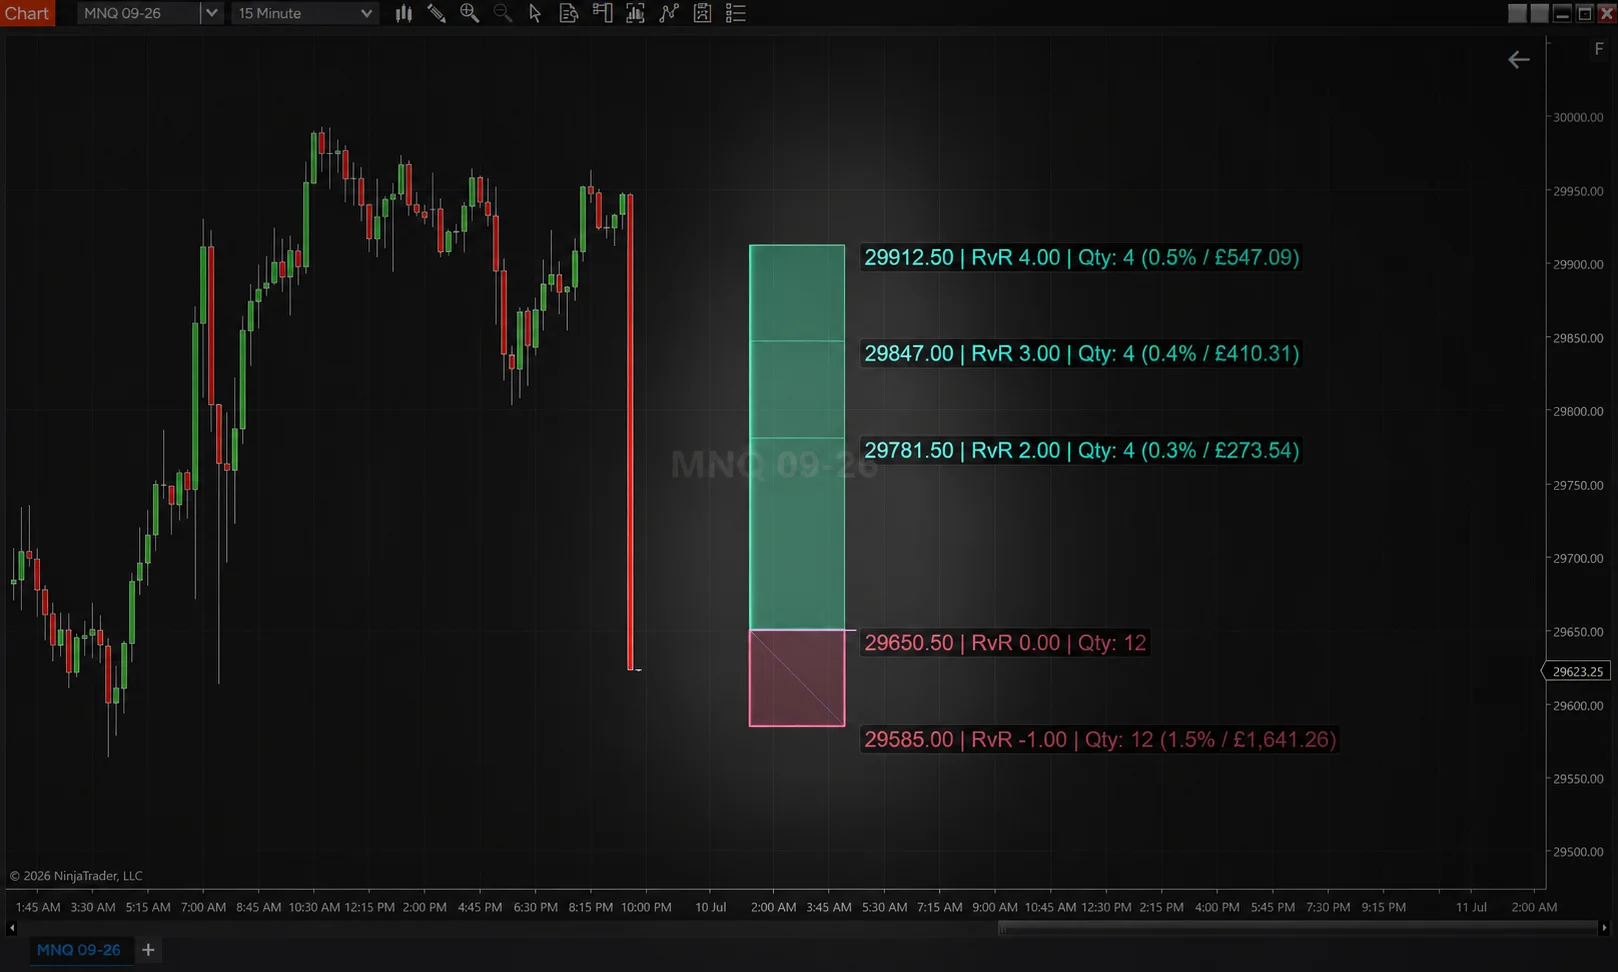
Screenshot showing the XABCD Position Tool drawing an entry, stop, and target directly on a NinjaTrader 8 chart with live position sizing displayed
You click where you want to enter, then click where your stop belongs. The position size computes automatically from your configured risk and the exact distance between those two prices. Meanwhile, the size updates live while you drag. You can watch the contract count fall as you widen the stop and climb as you tighten it. The trade-off between stop distance and size stops being an abstraction. It becomes something you can see moving in front of you.
That drawing step is directional and deliberate. You can anchor the trade Entry-First, dropping your entry and then placing the stop. Alternatively, you can work Stop-First when your risk is defined by structure—a swing low, a prior level, or the far side of a candle. Either way, the tool handles the arithmetic that traders routinely botch under pressure. Moreover, it performs that math continuously rather than once at the start.
The mental shift is the entire point. When your size is a live output of your risk and your stop, you are no longer answering the question "how many contracts do I feel like trading today." Instead, you are answering two honest questions: Where am I wrong? and How much does being wrong cost? The size falls out of those answers automatically.
A risk vs reward tool converts a risk decision into a sized, ready-to-send order—so the discipline you promised yourself at the whiteboard actually survives contact with a live market.
The Risk-Reward Ratio Explained in 60 Seconds
If you can read a fraction, you already understand the hardest part of risk reward. Everything after that is just execution—which is exactly where traders fall apart.
So what is a risk reward ratio explained simply? It is what you stand to make compared with what you are risking to find out. If your stop is 10 points away and your target is 20 points away, you are risking one unit to make two. Your reward-to-risk is 2 to 1. That is the whole definition. Reward on top, risk on the bottom, read it as a fraction.
A Concrete Example on the ES
Take the E-mini S&P 500, where each point is worth $50 per contract. Say you buy at 5,000.00 with a stop at 4,990.00. That is 10 points, or $500 of risk per contract. You set your target at 5,020.00—20 points, or $1,000 of potential reward per contract. Reward divided by risk is 1,000 over 500, so your ratio is 2:1.
Run the same trade on the NQ (E-mini Nasdaq 100) at $20 a point. The dollar figures change, but the ratio does not. A 10-point stop and a 20-point target is still 2:1. The ratio is instrument-agnostic, which is exactly why it is the number worth anchoring your plan to.
A capable reward to risk calculator will show you that number on the chart in whichever form you think in. It can print it as an R-multiple, where your risk is defined as 1R and that target sits at 2R. Or it can print it as a classic 1:2 style ratio. Here is the part worth internalizing: the R-multiple and the ratio are the same measurement shown two ways. "2R" and "1:2" are not two different numbers you need to reconcile. They are one measurement wearing two outfits.
Furthermore, the tool can layer on price, currency, percent, allocation, unit count, and order type on the same entry line. The ratio never floats in isolation. It sits next to the dollars and the contracts it actually implies.
Why the Math in Your Head Is Costing You Money
You have done it at least once. You eyeballed a stop, guessed a size, and learned at the close that "1%" was really 4%. A risk vs reward tool makes that mistake structurally impossible.
Mental math fails not because traders are bad at arithmetic. It fails because "risk" is not one number, and the base you size against quietly changes as your account moves. This is where a serious position sizing tool earns its place, because it lets you define the base explicitly instead of guessing.
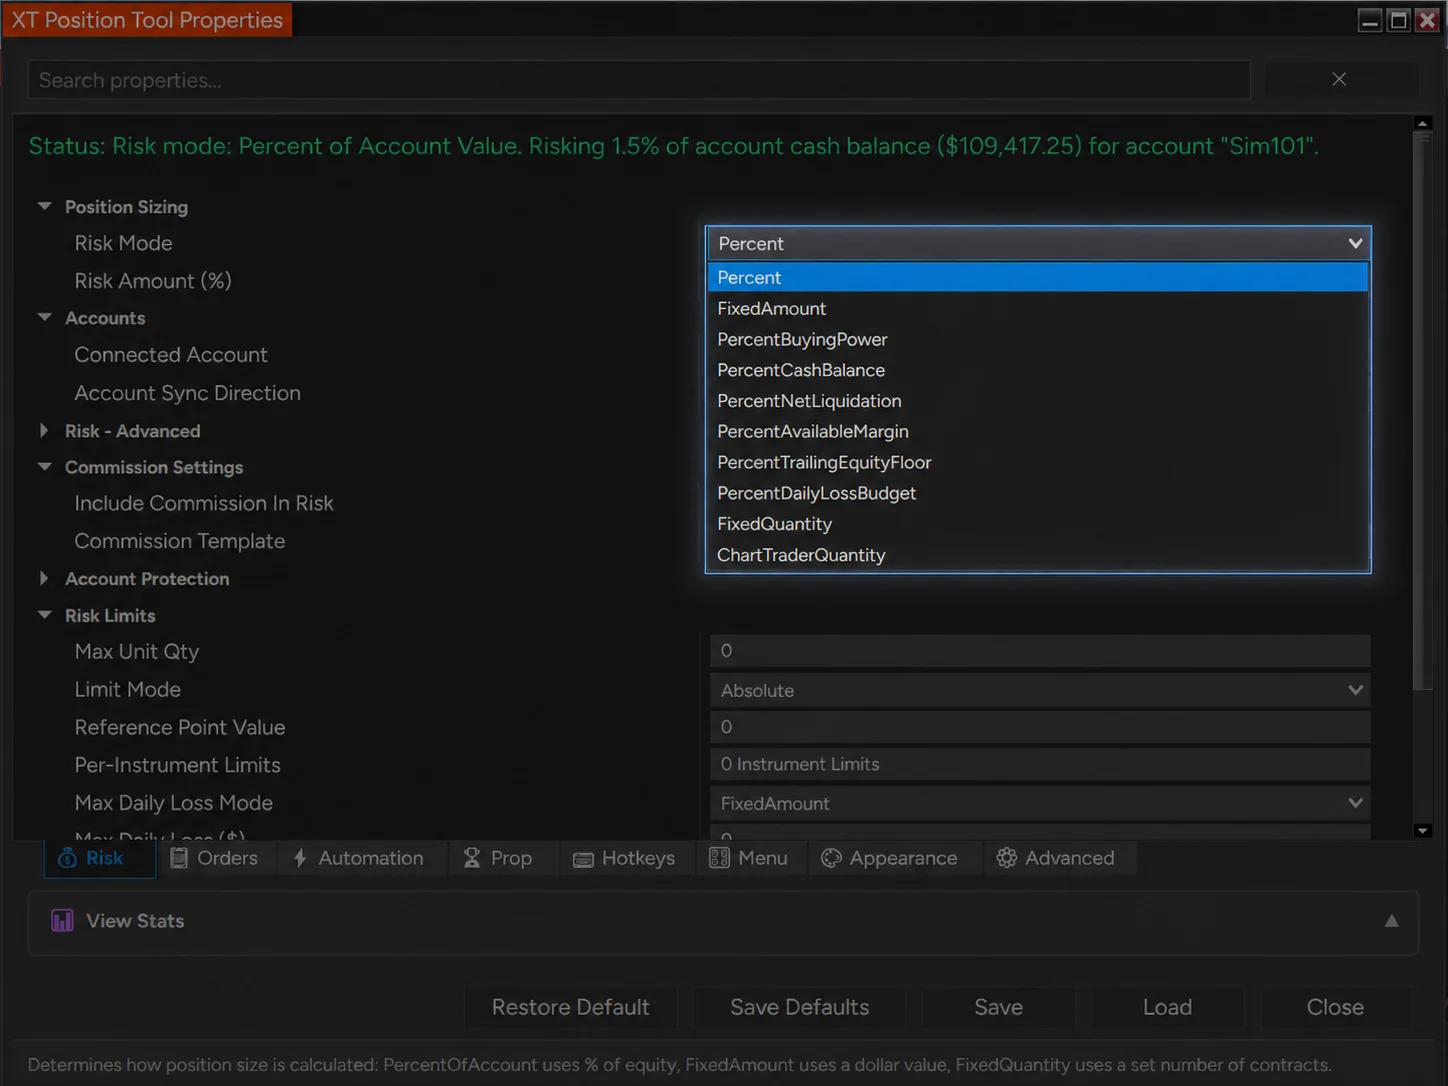
Settings panel from the XABCD Position Tool displaying ten different risk base options including percent of account, fixed dollars, and percent of net liquidation
The XABCD Position Tool exposes ten risk bases. You pick one:
- Percent of account
- Fixed dollars
- Percent of buying power
- Percent of cash balance
- Percent of net liquidation
- Percent of available margin
- Percent of a trailing equity floor
- Percent of your daily-loss budget
- A fixed-quantity override
- Use Chart Trader quantity
Choose "1 percent of net liquidation" once, and every trade sizes off that same, correctly measured base. No more sizing off yesterday's account balance in your head while today's balance is different. The position sizing tool features make the calculation derived, not remembered.
The Rounding Problem
Rounding sounds trivial. It is not. Suppose your risk budget is $1,200 and the trade risks $500 per contract. The honest answer is 2.4 contracts, and you cannot trade four-tenths of a contract. Rounding to 3 pushes you 20 percent over your intended risk.
A proper tool lets you set the rule in advance: Floor for a conservative 2 contracts, Round for the nearest whole number, or Ceiling if you knowingly accept the extra exposure. You decide the policy once instead of improvising it differently on every entry.
Commissions and Slippage
Two more leaks that hand-sizing never catches deserve attention. First, commissions. You can turn on commission-inclusive sizing so the tool deducts the round-trip commission and sizes you accordingly. As a result, the loss at your stop actually matches your target risk after costs, not before them.
Second, slippage. You can add a slippage buffer measured in ticks that pads the stop distance for sizing purposes only. It makes the tool size you slightly smaller to leave room for a bad fill. Importantly, it does not move your real stop order. These are the exact reductions a trader "means to make" and never does at 9:31 in the morning.
Risk First, Size Second: The Order That Changes Everything
Amateurs pick a size and hope. A risk vs reward tool flips the sequence: you choose the risk, and the size stops being a guess. It becomes the answer.
Think about how most platforms condition you to trade. You load an ATM strategy or a fixed-lot habit—"I trade 3 contracts"—and then you go looking for a stop that feels okay next to that pre-chosen size. That approach is backwards. The size came first, and the risk got bent to fit it. Some days that 3-lot is half a percent of your account. Other days it is five percent. You never actually decided which.
A trade risk management tool inverts the sequence, and the inversion is the whole discipline. You set your risk once—say 1 percent of net liquidation, or a flat $300—and from then on the size is simply whatever makes that statement true for the stop you drew. Widen the stop and the tool hands you fewer contracts. Tighten it and you get more. The risk stays pinned while the size flexes. That is precisely the relationship most traders have upside down.
Because the trade is drawn on the chart, you get to rehearse it before it becomes real. As you place the entry and stop, the tool shows ghost preview lines—staged, not-yet-live lines with quantity pills attached. You can see the exact contract count, the stop, and the target sitting on the chart before a single order goes to the broker. The advantages over ATM strategies become obvious once you experience this workflow.
Nothing is committed while you are still deciding. The trade only becomes real when you choose to submit it. And when you do, it ships at the size your risk demanded rather than the size your ego suggested.
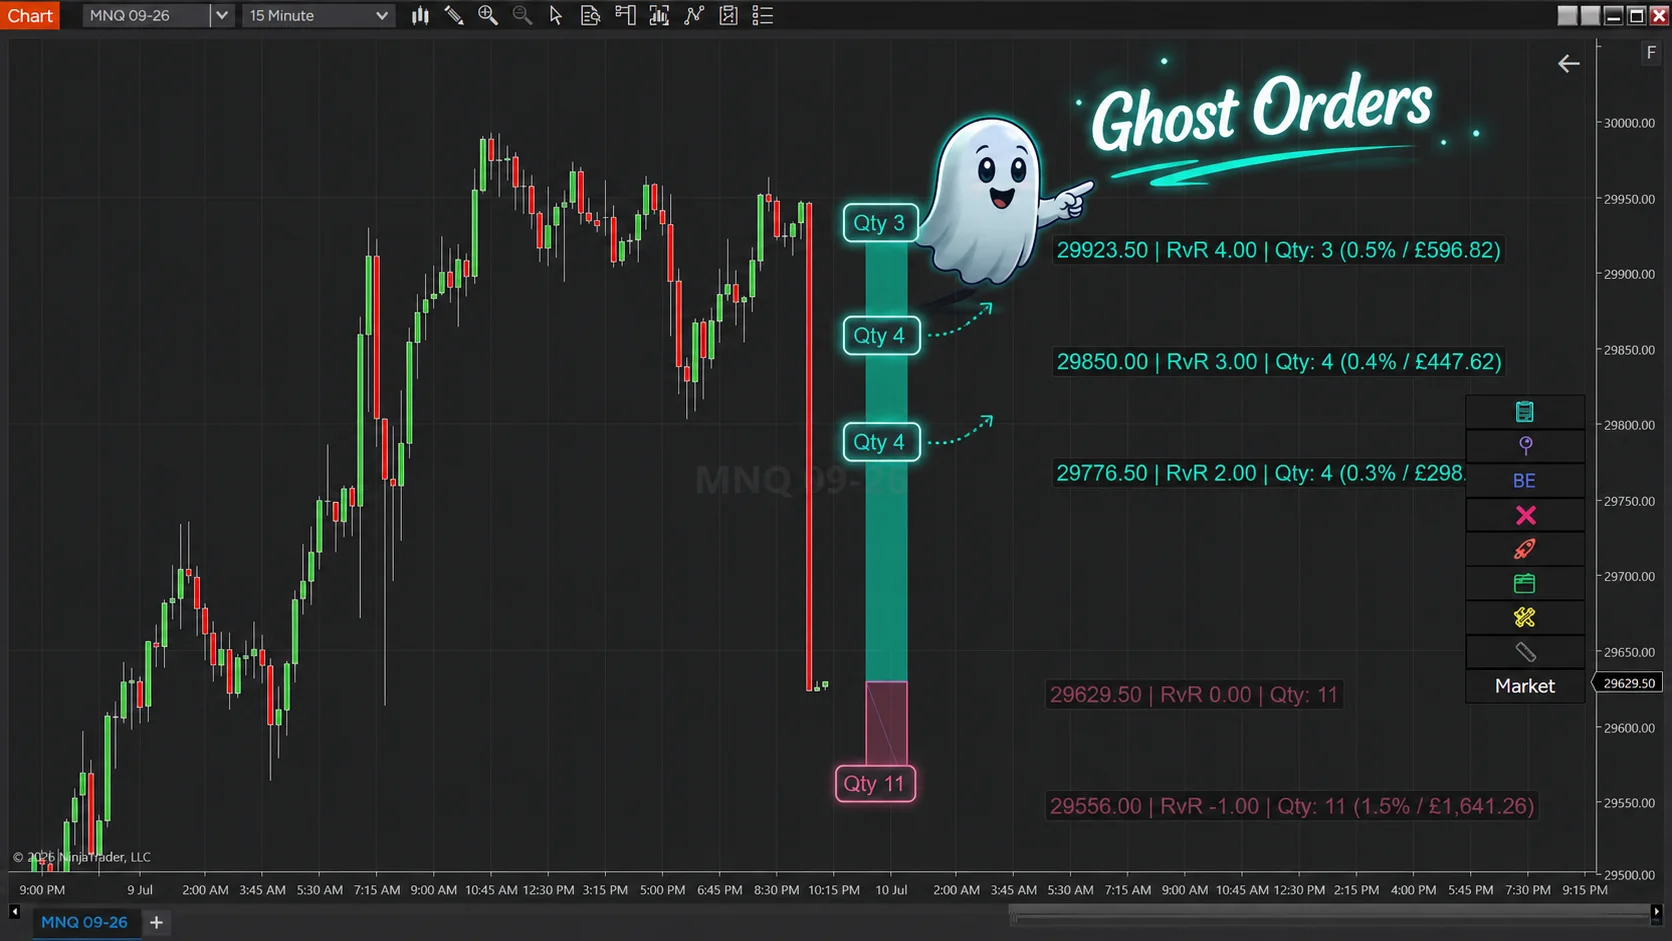
A NinjaTrader 8 chart displaying ghost preview lines for entry, stop, and target with the contract count pill visible before order submission
What Separates a Real Risk vs Reward Tool From a Colored Box
Most "risk reward tools" stop at shading a green rectangle and a red one. The one worth using sizes the trade, folds in your commissions, and caps you before you break your own rule.
A colored box tells you the ratio and nothing else. The difference between that and a real tool is a set of guardrails that sit between your worst impulse and your account. Let's walk through the layers that matter.
Hard Size Caps
You can set a Max Unit Qty as an absolute ceiling and choose a Limit Mode. "Absolute" treats the cap as a literal contract count. "Equivalent" understands micro contracts, scaling the cap 10:1 for micros and optionally scaling across products by point value using a reference. On top of that global cap you can define per-instrument limits—NQ capped at 5, MNQ at 50, ES at 10, MES at 100—that match on the root symbol and override the global number.
Risk-Side Rules
Turn on Prevent Exceeding Max Risk and the tool will refuse to submit an order that would blow past your per-trade risk. It blocks the order rather than quietly letting it through. Additionally, set a Max Daily Loss in dollars or percent. When your realized loss for the day reaches that threshold, the tool blocks new entries and throws an on-chart "Orders blocked" alert.
Be clear-eyed about the scope here, because it matters. That daily-loss block reads your realized profit and loss and stops the tool's own new entries. It is not a broker-side kill switch. It does not police orders you place through other software. However, it enforces your rule through the orders it controls, which is a real and useful thing.
Visual Helpers That Earn Their Keep
Risk subdivision lines drop 2 to 10 evenly spaced markers inside the risk area. You can see quarter-risk and half-risk levels at a glance. They are purely visual and change nothing about your orders. Nevertheless, they make partial-stop thinking and scaling decisions faster to read. For traders who study chart pattern setups, these visual cues speed up decision-making considerably.
The point of the whole set is consistent: a real risk vs reward tool caps you before you break your own rule, instead of coloring in the rule you are about to break.
From Ratio on the Chart to Real Order in Two Clicks
A ratio drawn on a chart is a wish. A risk vs reward tool that submits the bracket at that exact ratio is a plan. This is the step the colored-box tools never take.
Once your trade is drawn and sized, the XABCD Position Tool can submit and manage the real bracket order. By default it uses an EntryOnlyWithGhosts submission mode. It sends your entry order and stages the protective stop and target locally as ghosts. These ghost orders stay off the broker until your entry actually fills. Then the tool live-syncs the protective quantity to your partial fills as they come in.
Consequently, a partial fill does not leave you with a mismatched stop covering contracts you never got. If you prefer, you can submit all orders at once instead.
Managing the Trade After Entry
The management layer keeps honoring the ratio you drew. You can split the exit across multiple targets and allocate them Even, Front-Heavy, Back-Heavy, or fully Custom by percentage. You can also edit that allocation live as the trade breathes.
Moreover, you can automate a move to breakeven at a trigger you define—by percent, by units, or by reward-to-risk itself. The breakeven calculation optionally covers commissions so "breakeven" is truly flat. A dynamic breakeven line shows exactly where the trigger sits on your chart.
For trailing, you have three flavors:
- Static ticks – a fixed distance behind price
- ATR-based – using your own period and multiplier
- Bar-based – trailing by the previous bar's high or low
Each trailing method starts with a Jump, Smooth, or Stepped behavior you select. The 2:1 you sketched on the chart becomes a bracket that is actually working toward 2:1 in the market. According to risk management research, traders who automate their exit management tend to stick closer to planned ratios.
A Necessary Disclaimer
One thing must stay front and center, because it separates honest software from a sales pitch. This tool places, modifies, and cancels real broker orders. It is order software, not a simulator. Everything is manual or one-click by default, with every automation switch shipping in the off position until you deliberately turn it on.
The protective features—the daily-loss block, the breakeven move, the trailing stop—enforce your rules through live broker orders. They cannot repeal the market. A gap through your stop or a fast, thin market can still fill you worse than your stop price. No software prevents that. What a risk vs reward tool does is ensure that when the market behaves normally, your intended risk and your real order are the same thing.
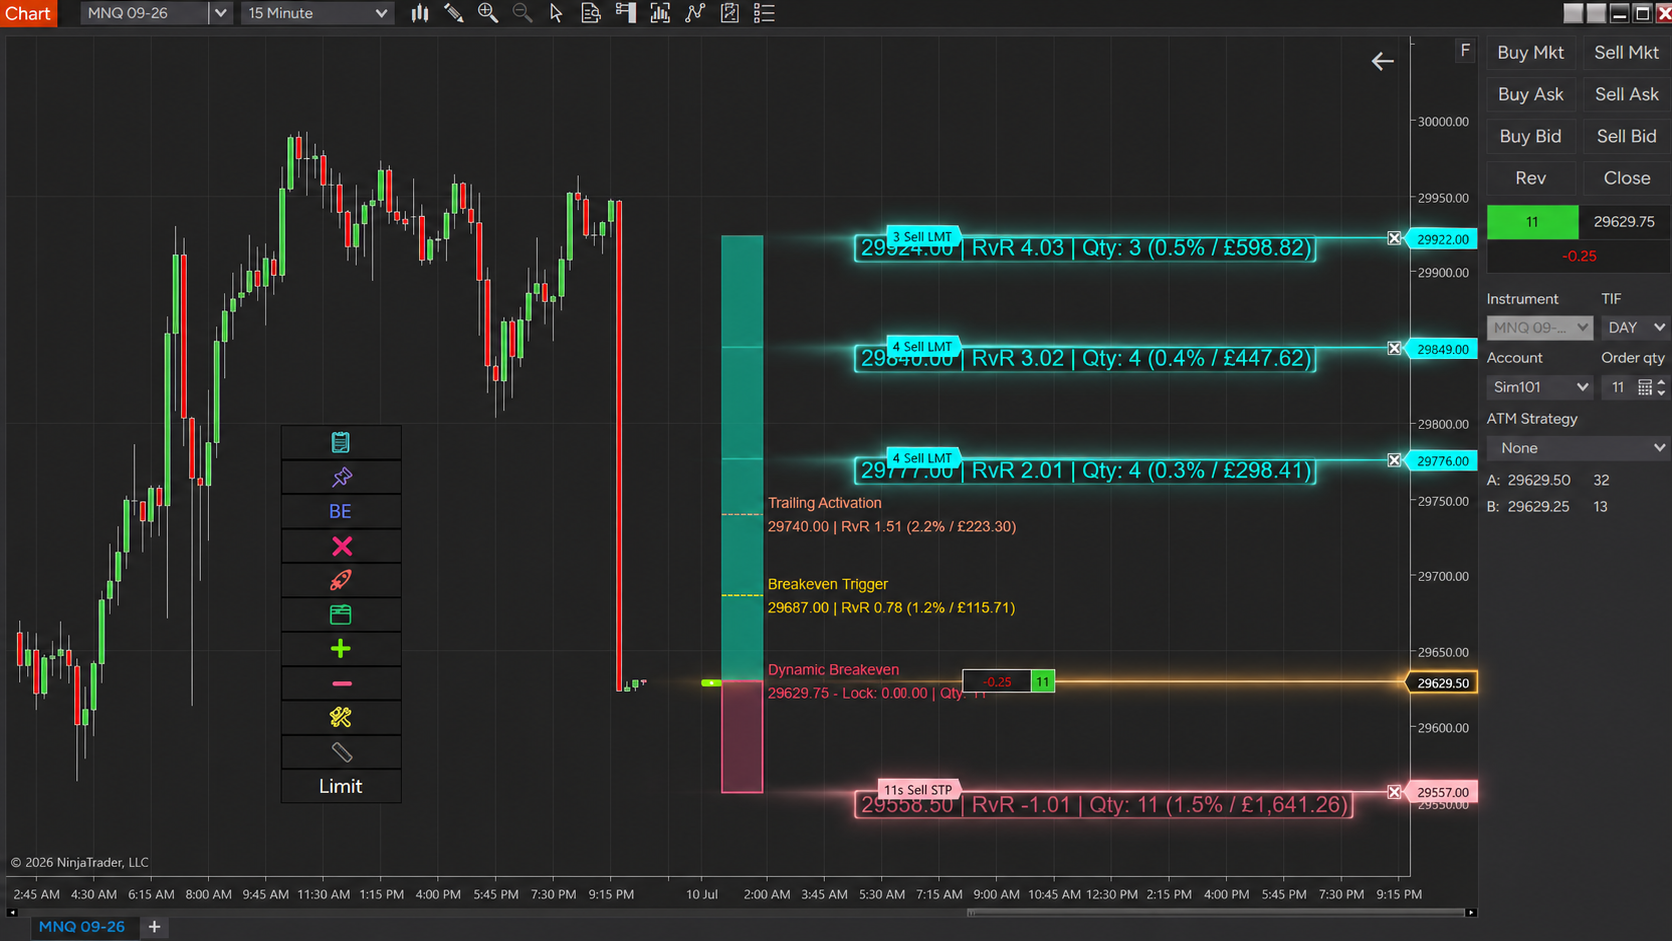
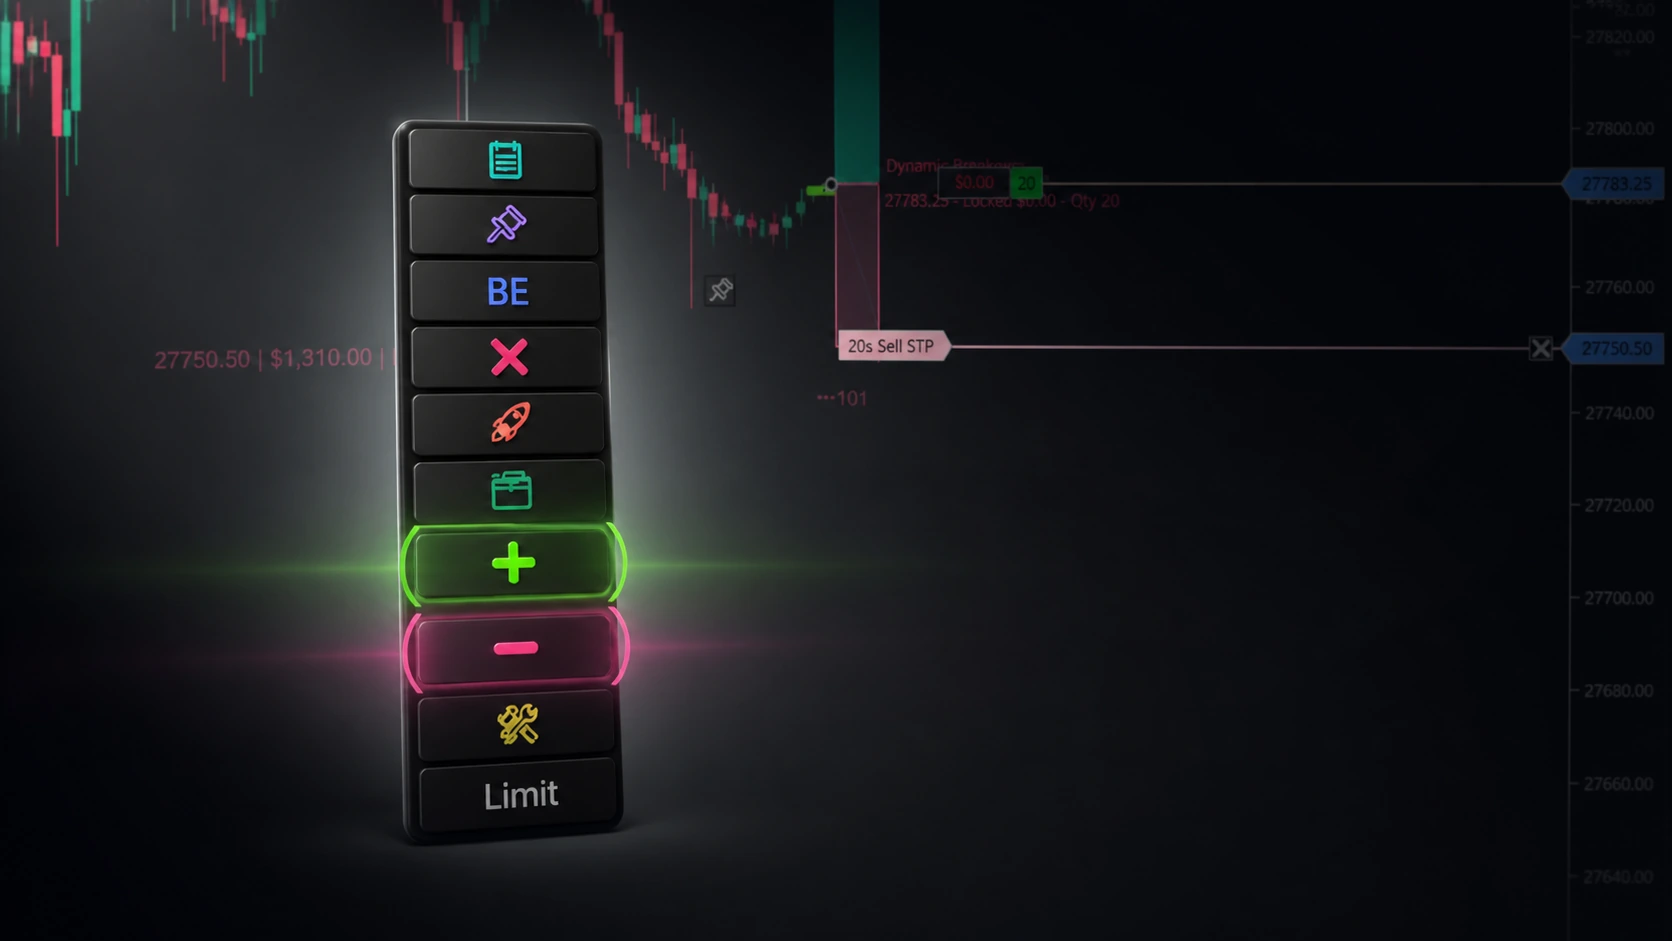
NinjaTrader 8 chart showing a live bracket order managed by the XABCD Position Tool with breakeven trigger line and trailing stop visualization
Building a Complete Workflow Around Your Risk vs Reward Tool
A tool is only as strong as the workflow wrapped around it. Here is a practical sequence that ties the risk vs reward tool into a repeatable daily process.
Step 1: Define Your Daily Risk Budget
Before the market opens, set your Max Daily Loss. This number should reflect both your account size and your emotional tolerance. Once it is set, the tool enforces it. You do not need willpower at 2 p.m. when you are down and frustrated.
Step 2: Identify Your Setup
Use whatever method fits your edge—candlestick patterns, harmonic structures, or support-and-resistance levels. The setup tells you where to trade. The risk vs reward tool tells you how much.
Step 3: Draw the Trade
Click your entry, click your stop. Watch the NinjaTrader position sizing update live. If the contract count looks too large, your stop is probably too tight for the volatility. If it looks too small, your risk budget may be conservative for the instrument. Either way, the feedback is instant and honest.
Step 4: Evaluate the Ratio
Before submitting, check the reward-to-risk number on the chart. If it sits below your minimum threshold—many traders use 1.5:1 or 2:1—move on. The tool makes this evaluation effortless because the ratio is printed right on the drawing.
Step 5: Submit and Manage
One click sends the sized bracket. From there, your breakeven rules and trailing stops handle the management you defined in advance. You are free to watch the market rather than babysit the order ticket.
Frequently Asked Questions
What is the difference between a risk reward tool and a standard calculator?
A standard calculator asks you to type in numbers and then hands back a contract count you must re-enter manually. A risk vs reward tool draws the trade on your chart, computes the size from your configured risk, and submits the bracket order directly. It eliminates the manual re-entry step where most errors happen.
Can a risk reward tool prevent losses entirely?
No. A risk vs reward tool ensures your intended risk matches the actual order you send. It cannot prevent gaps, slippage, or adverse market moves that fill you beyond your stop price. What it does is remove the sizing errors and discipline failures that add unnecessary loss on top of normal market risk.
What risk-reward ratio should I target?
There is no universal answer. Many traders set a minimum of 1.5:1 or 2:1, meaning they need at least $1.50 or $2 of potential reward for every $1 of risk. The right ratio depends on your win rate and trading style. A higher ratio lets you be profitable even with a lower win percentage.
Does the XABCD Position Tool work only on NinjaTrader 8?
Yes, the XABCD Position Tool is built specifically for NinjaTrader 8. It integrates with NinjaTrader's order system, commission templates, and chart interface. You can review the full position tool changelog to see the latest updates and feature additions.
How many times should I adjust my risk base?
Ideally, you set your risk base once and leave it alone. The tool recalculates automatically as your account value changes. Most traders revisit their risk base only when their overall strategy or account structure changes meaningfully, not on a trade-by-trade basis.
Bring the Ratio and the Order Into One Motion
A risk vs reward tool is not a widget you check before trading. It is the mechanism that turns "I want to risk one percent for a two-to-one" into a correctly sized bracket sitting on your chart, ready to send. It answers what a risk reward ratio is. It handles your position sizing off a base you actually chose. It folds in commissions and slippage. It caps you before you break a rule. And then it places and manages the real order at the reward-to-risk you drew.
If you are tired of eyeballing stops and re-keying contract counts, this is the upgrade that ends the guessing. Draw the trade, set the risk, and let the size be the answer.
New NinjaTrader Articles Delivered First
 (opens in a new tab)
Easy Order Tool
The Strategy
Scanning & Alerting

NinjaTrader Release
XABCD News (Free Version)
XABCD News (Community Edition) is the best free Indicator for NinjaTrader 8. Don't let news sneak up on you again. Puts economic news events on your charts so you can stay informed and move around positions/stops before the news is released. Works in any market.
XABCD Priceline (Free)
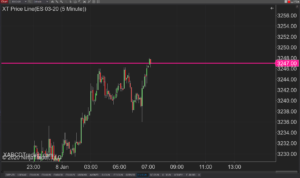
XABCD Price Line tool for NinjaTrader 8 will draw a line at current price and move every time the market changes price. This is useful because it will allow you to easily identify where price is at all times and the exact quoted price.
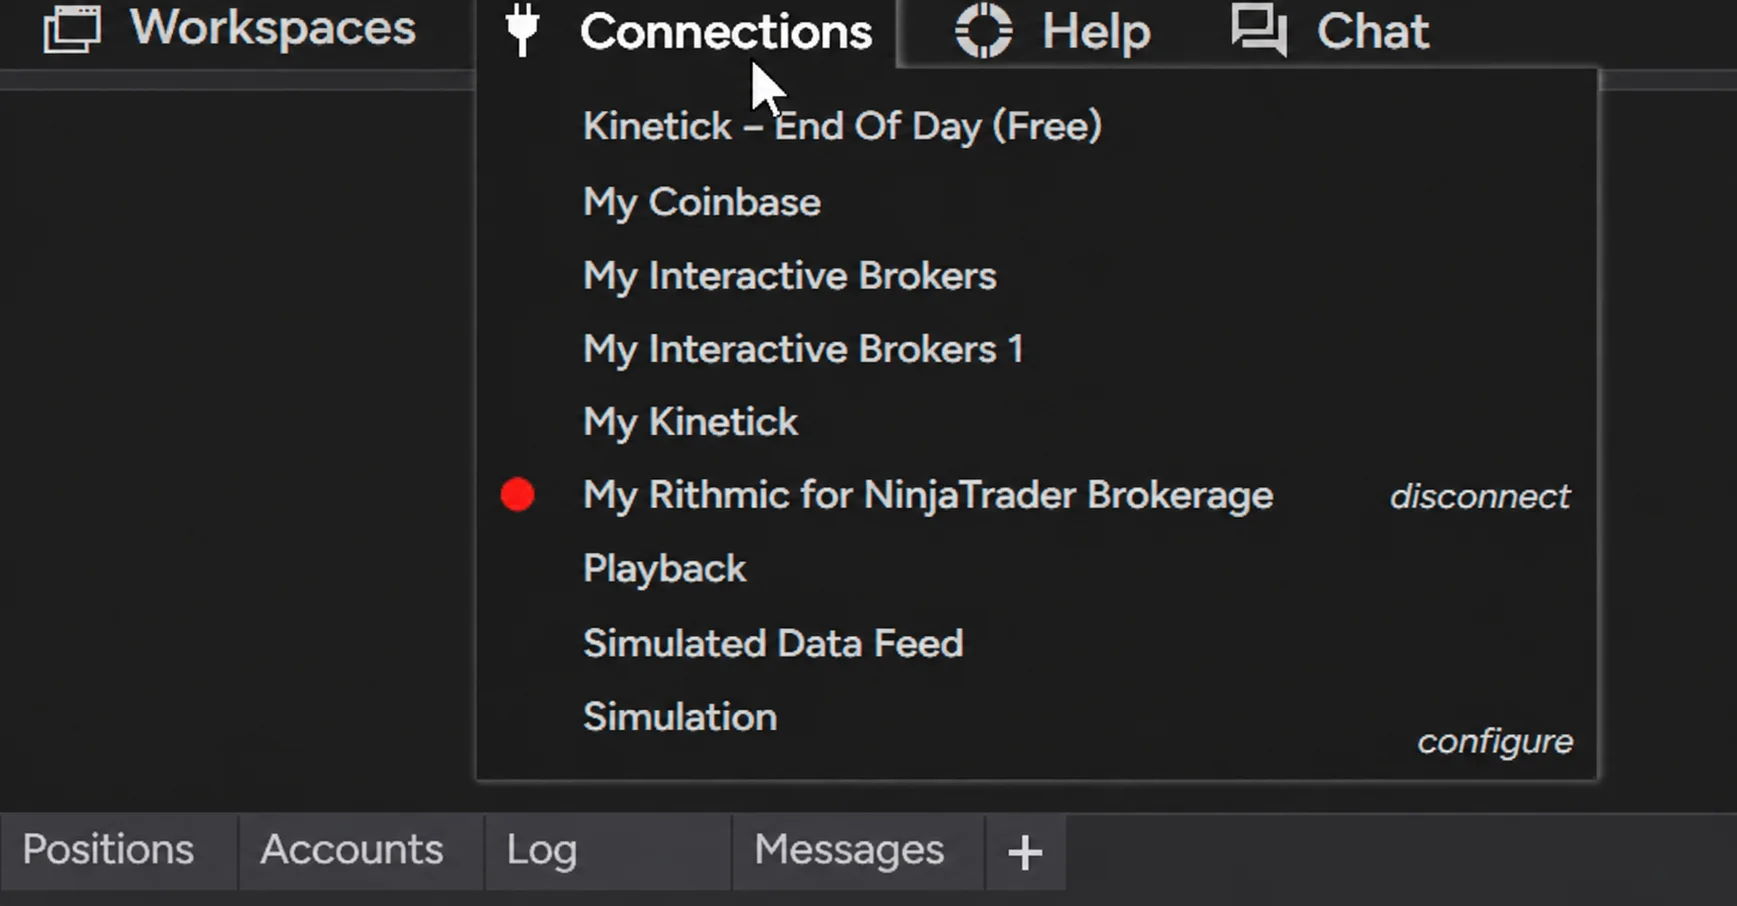
NinjaTrader Data Feed Not Updating? Quick Fixes
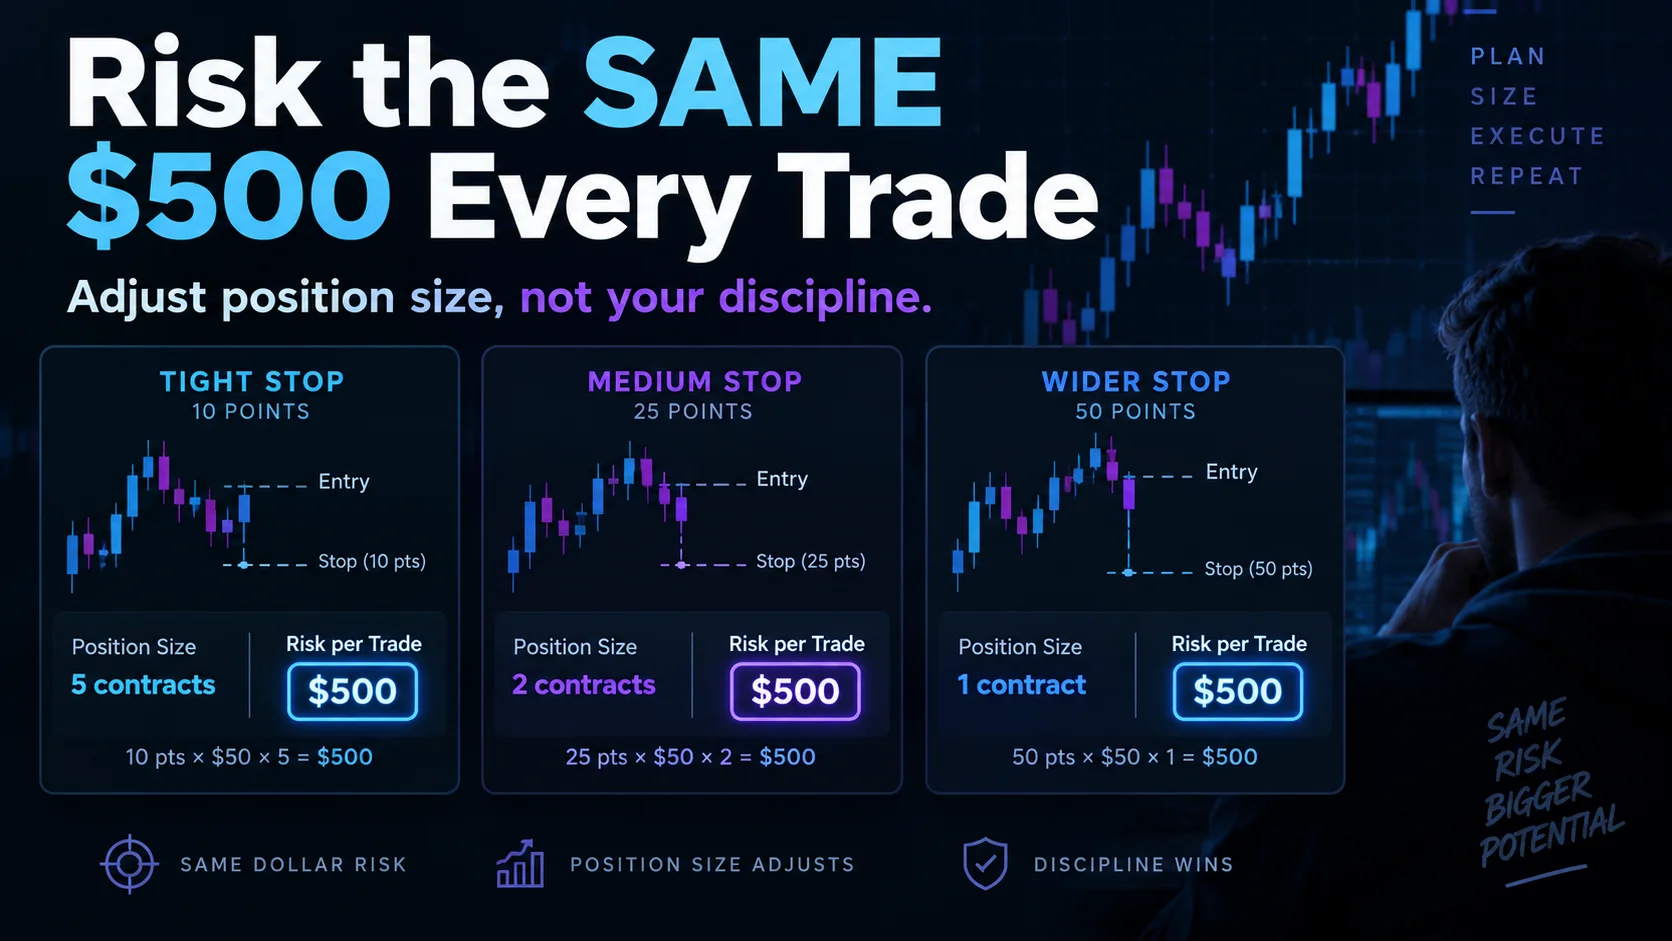
NinjaTrader Risk Per Trade: Risk $500 on Every Trade
NinjaTrader 8.1.8 Review: Should You Upgrade or Wait?
XABCD Pattern Alerts: The Complete Guide for Traders
Risk vs Reward Tool: The 2-Click Upgrade That Ends Guessing
NinjaTrader Faster Last Price Updates on Charts Explained
NinjaTrader 8 Hotkeys: Best Shortcuts for Faster Trading
NinjaTrader Position Sizing Tool: 64 Features Stock NT8 Does Not Include
NinjaTrader – Adding to Position: A Field Guide for Active Traders