XABCD TRADING
How To Overlay A Chart in NinjaTrader?
Subscribe
to get alerts to our next blog post!
Video Instructions Overlaying A Chart
Overlaying your charts is pretty easy on NinjaTrader once you know how to do it. Here is a video that will show you everything you need to know in order to get those charts working. Any questions, leave us a comment we will be happy to help you!
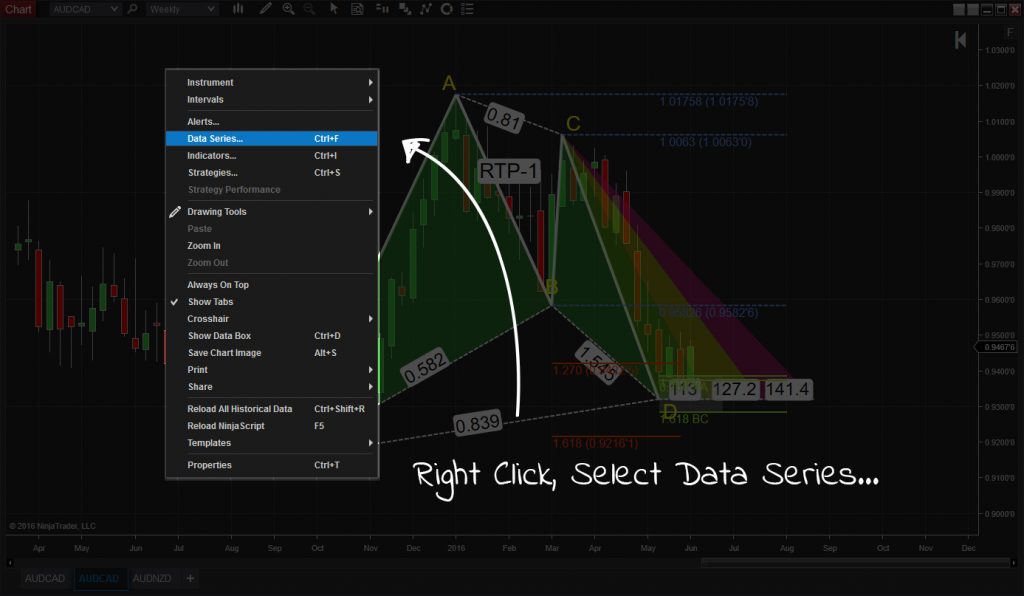
Step 1: Go To Your Data Series
In order to overlay a chart in NinjaTrader we need to do the following: Right click on the chart, select Data Series...
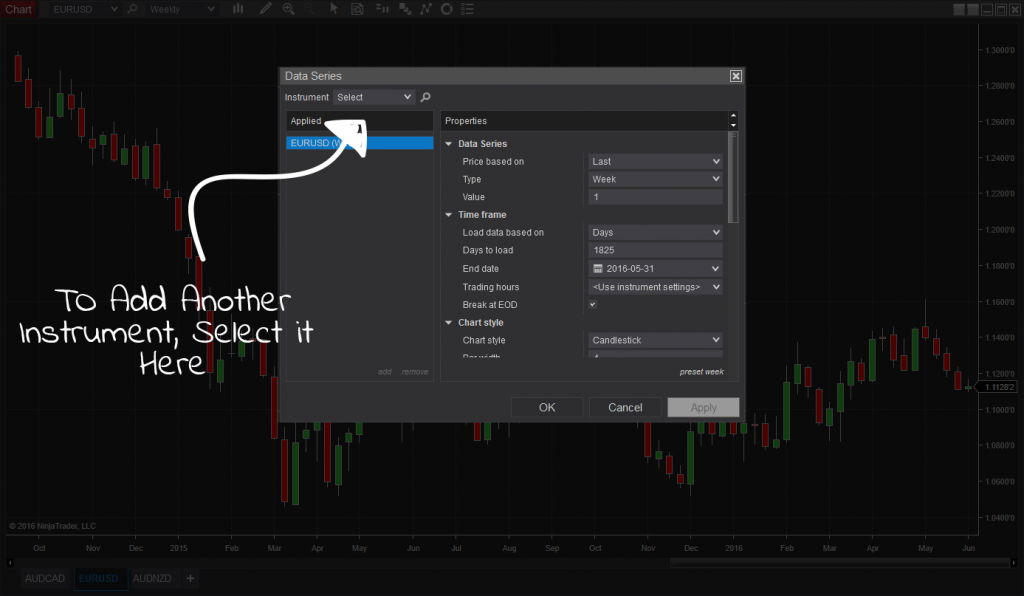
Step 2: Add An Instrument
Select the new instrument and hit the drop down arrow. Find any symbol you want to use to overlay a chart in NinjaTrader. Once added to the list of applied symbols, you can now continue on to step 3.

Step 3: Set Your Panels
Select the table as being part of Panel 1. This is probably going to be the same for most but you want the panels for the instruments to be the same so they are in overlay.
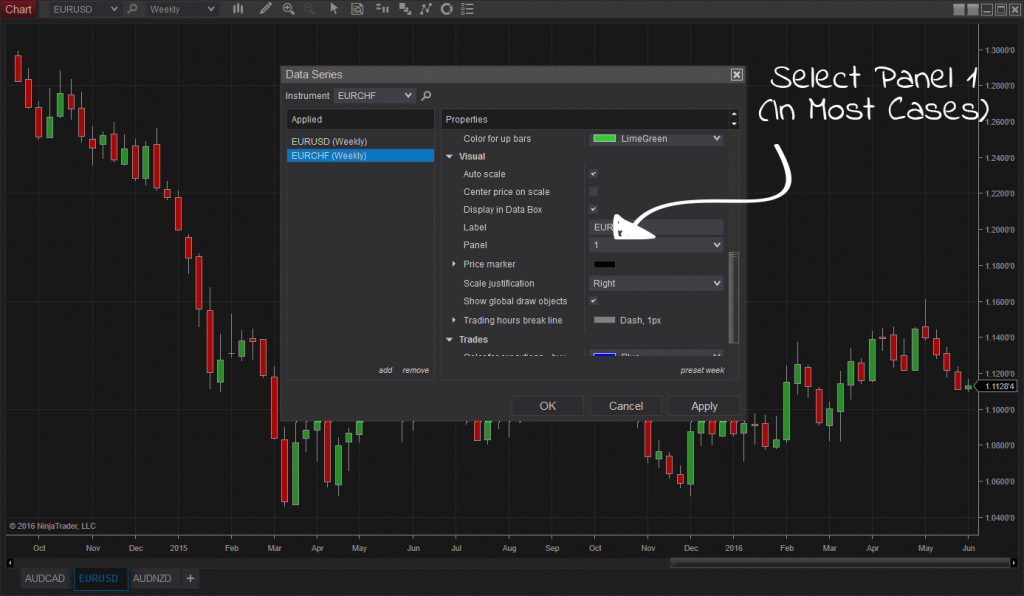
Depending on the price of the two instruments your looking at, you might find that the chart data of one instrument is above the other and they are on the same chart but they are not together. Right click on the chart -> Data Series on the top instrument change Scale justification to Overlay.
Step 4: You have completed Your Overlay Chart in NinjaTrader
Did it work for you?
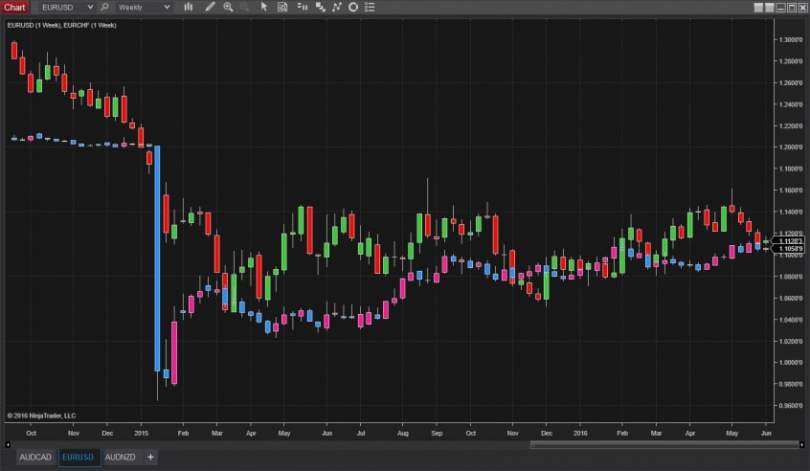
That's it! Success! Let us know if this did the trick; we're also interested in any other neat tips you've discovered. Your chart is now overlaid with another. You can even do the same thing using different time frames. In other words, you could overlay a daily chart onto a weekly chart etc.
New NinjaTrader Articles Delivered First

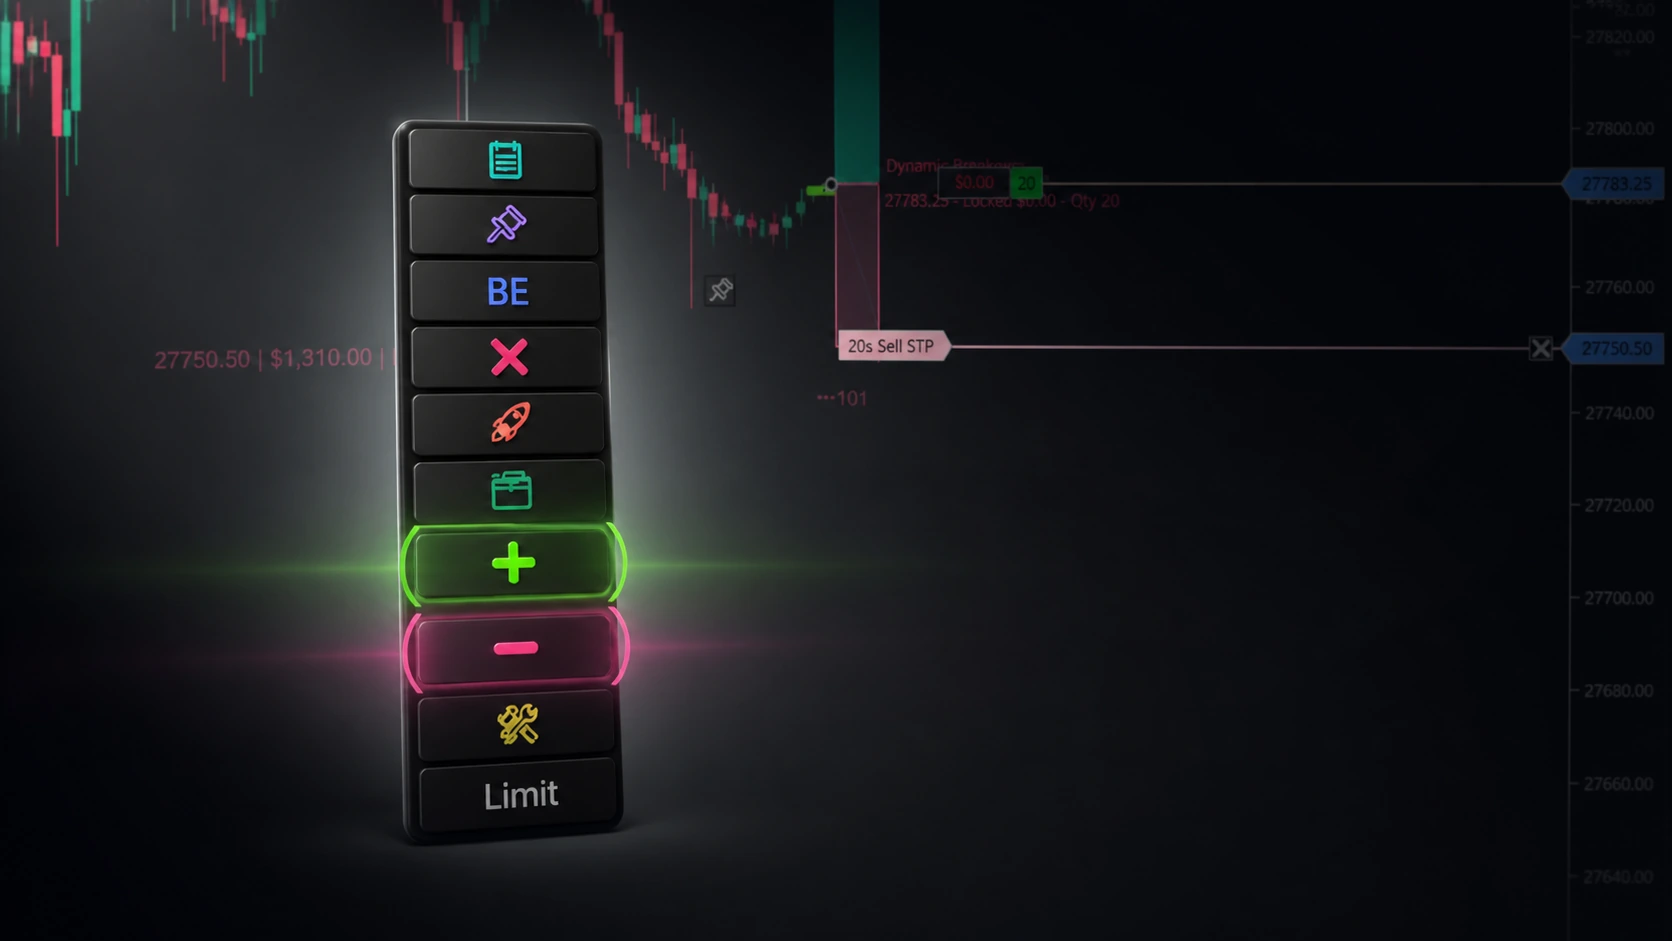
Easy Order Tool
The Strategy


Scanning & Alerting

NinjaTrader Release

XABCD News (Free Version)
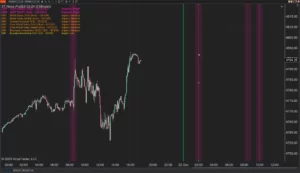
XABCD News (Community Edition) is the best free Indicator for NinjaTrader 8. Don't let news sneak up on you again. Puts economic news events on your charts so you can stay informed and move around positions/stops before the news is released. Works in any market.
XABCD Priceline (Free)
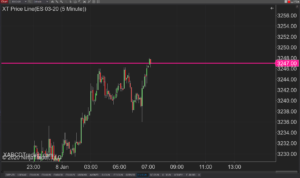
XABCD Price Line tool for NinjaTrader 8 will draw a line at current price and move every time the market changes price. This is useful because it will allow you to easily identify where price is at all times and the exact quoted price.
NinjaTrader – Adding to Position: A Field Guide for Active Traders
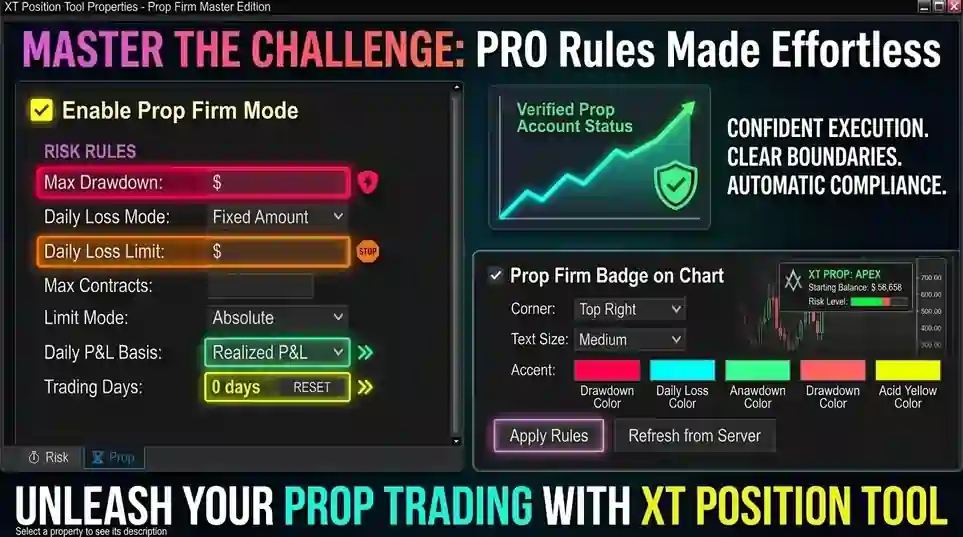
NinjaTrader Prop: The Ultimate Guide to Prop Firm Trading
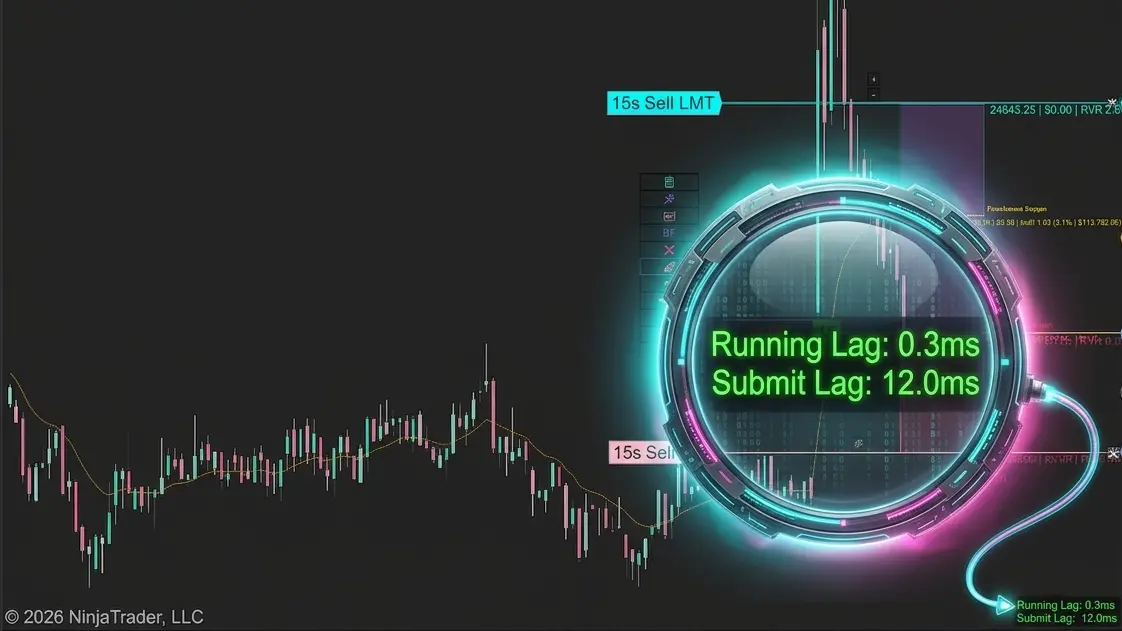
Does the XABCD Position Tool Lag?
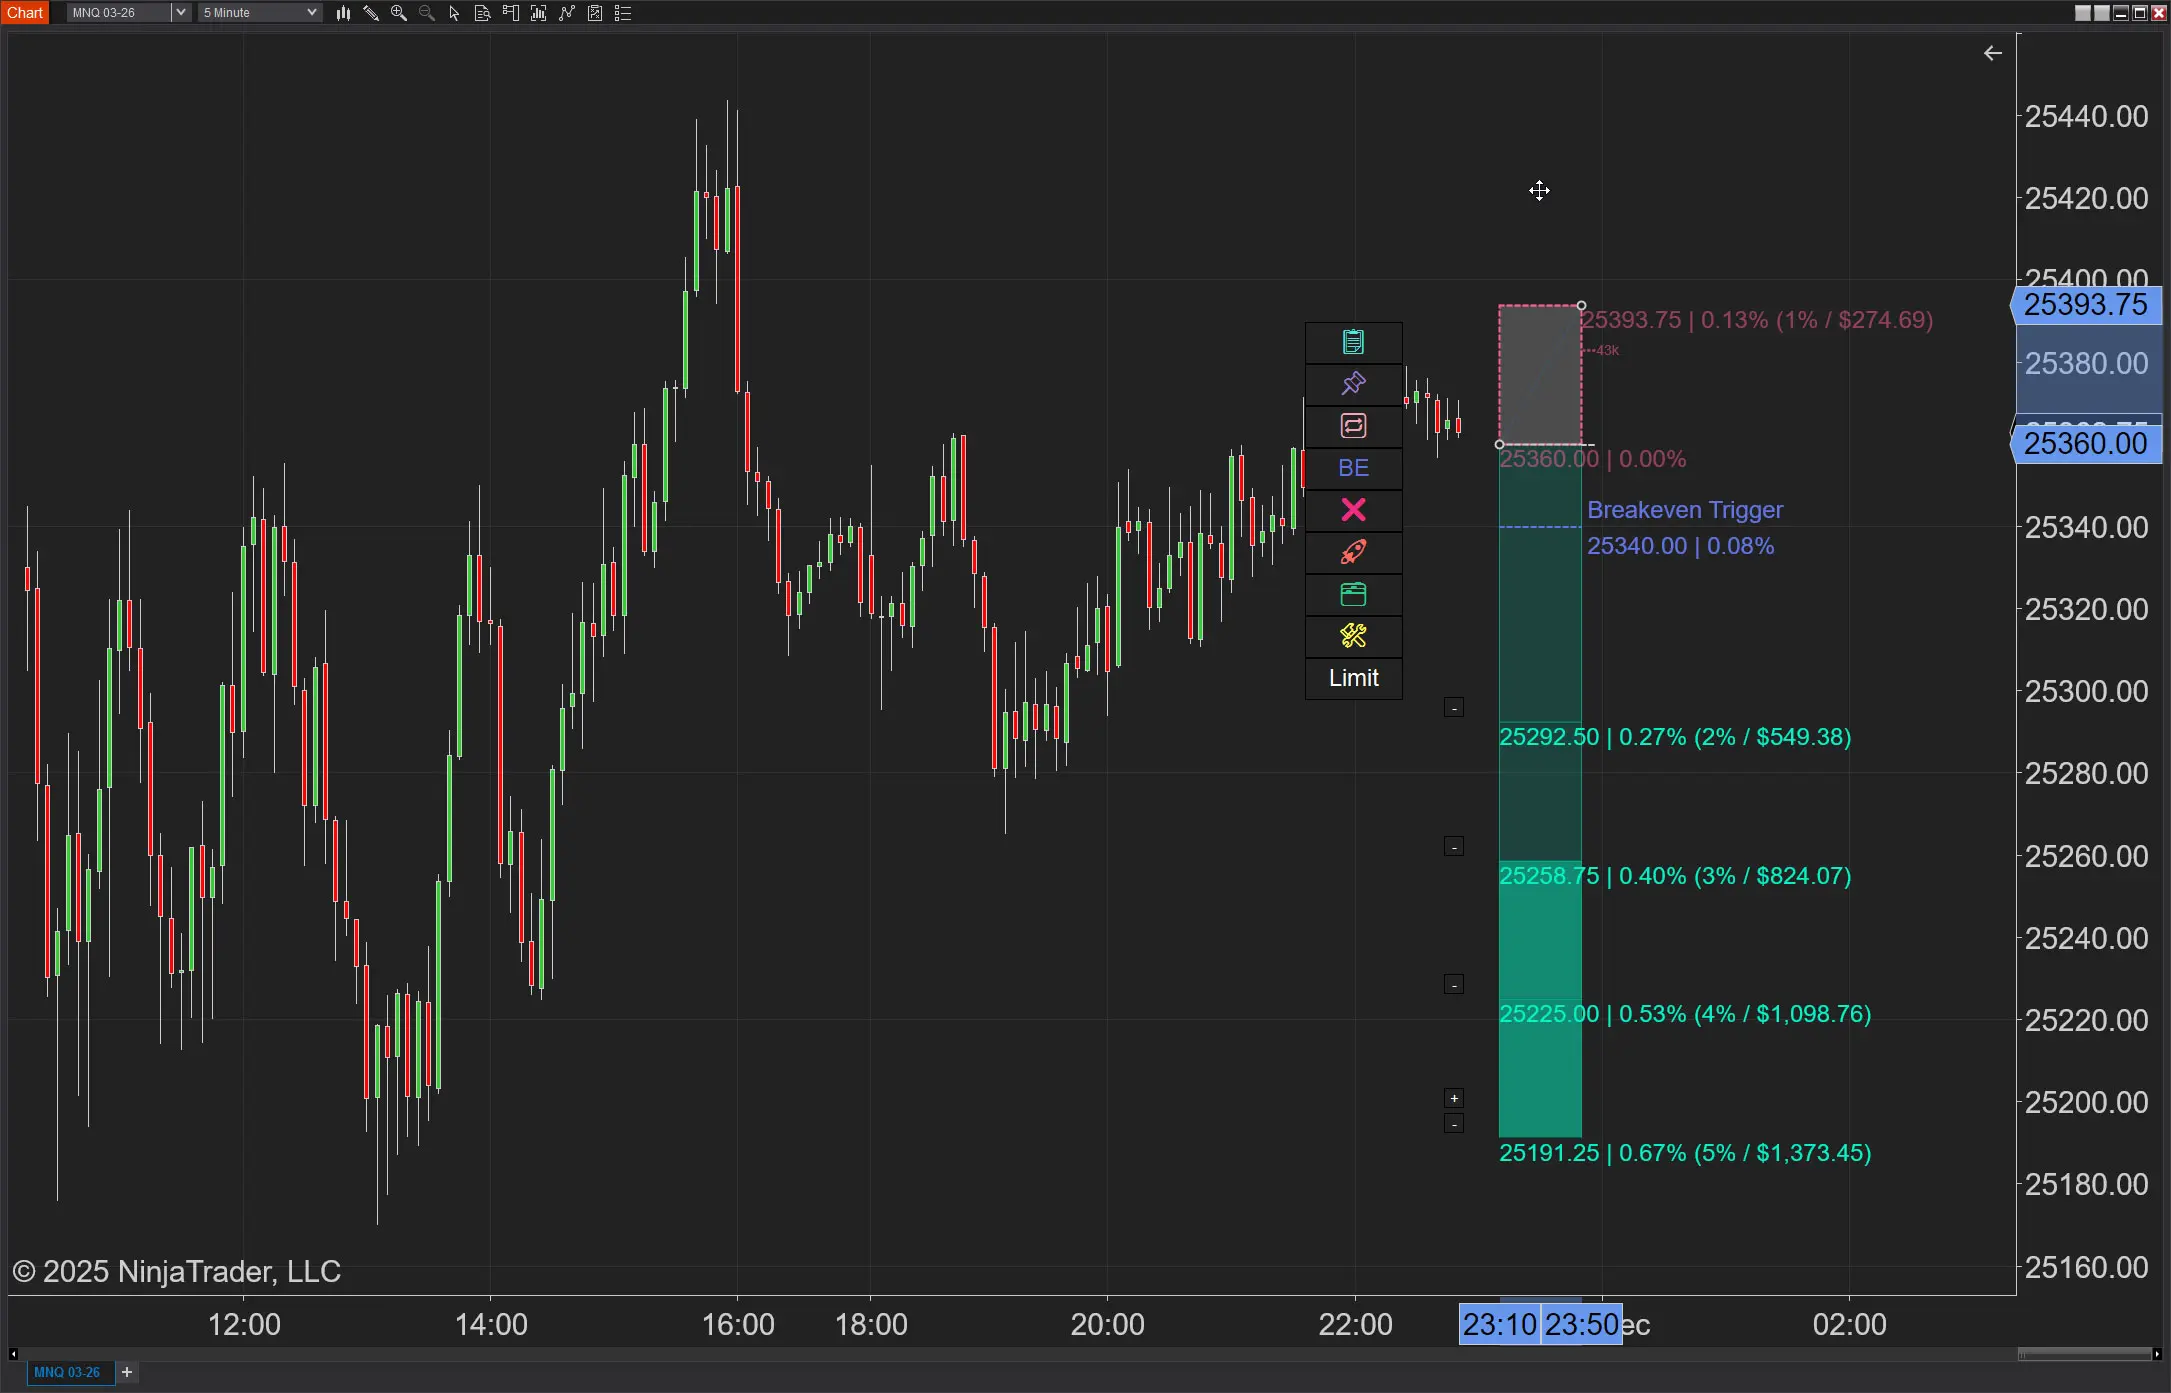
NinjaTrader Position Sizing: What the XABCD Position Tool Can Do That ATM’s Can’t
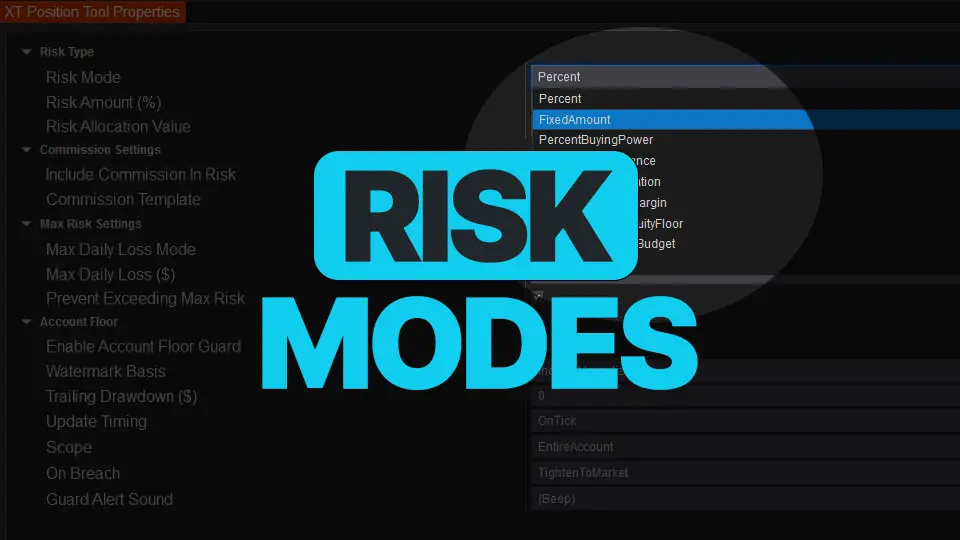
NinjaTrader Risk Management That Actually Moves the Needle
NinjaTrader 8.1.6 — The “No Fluff” Tour (Speed, Clarity, Fewer Clicks)
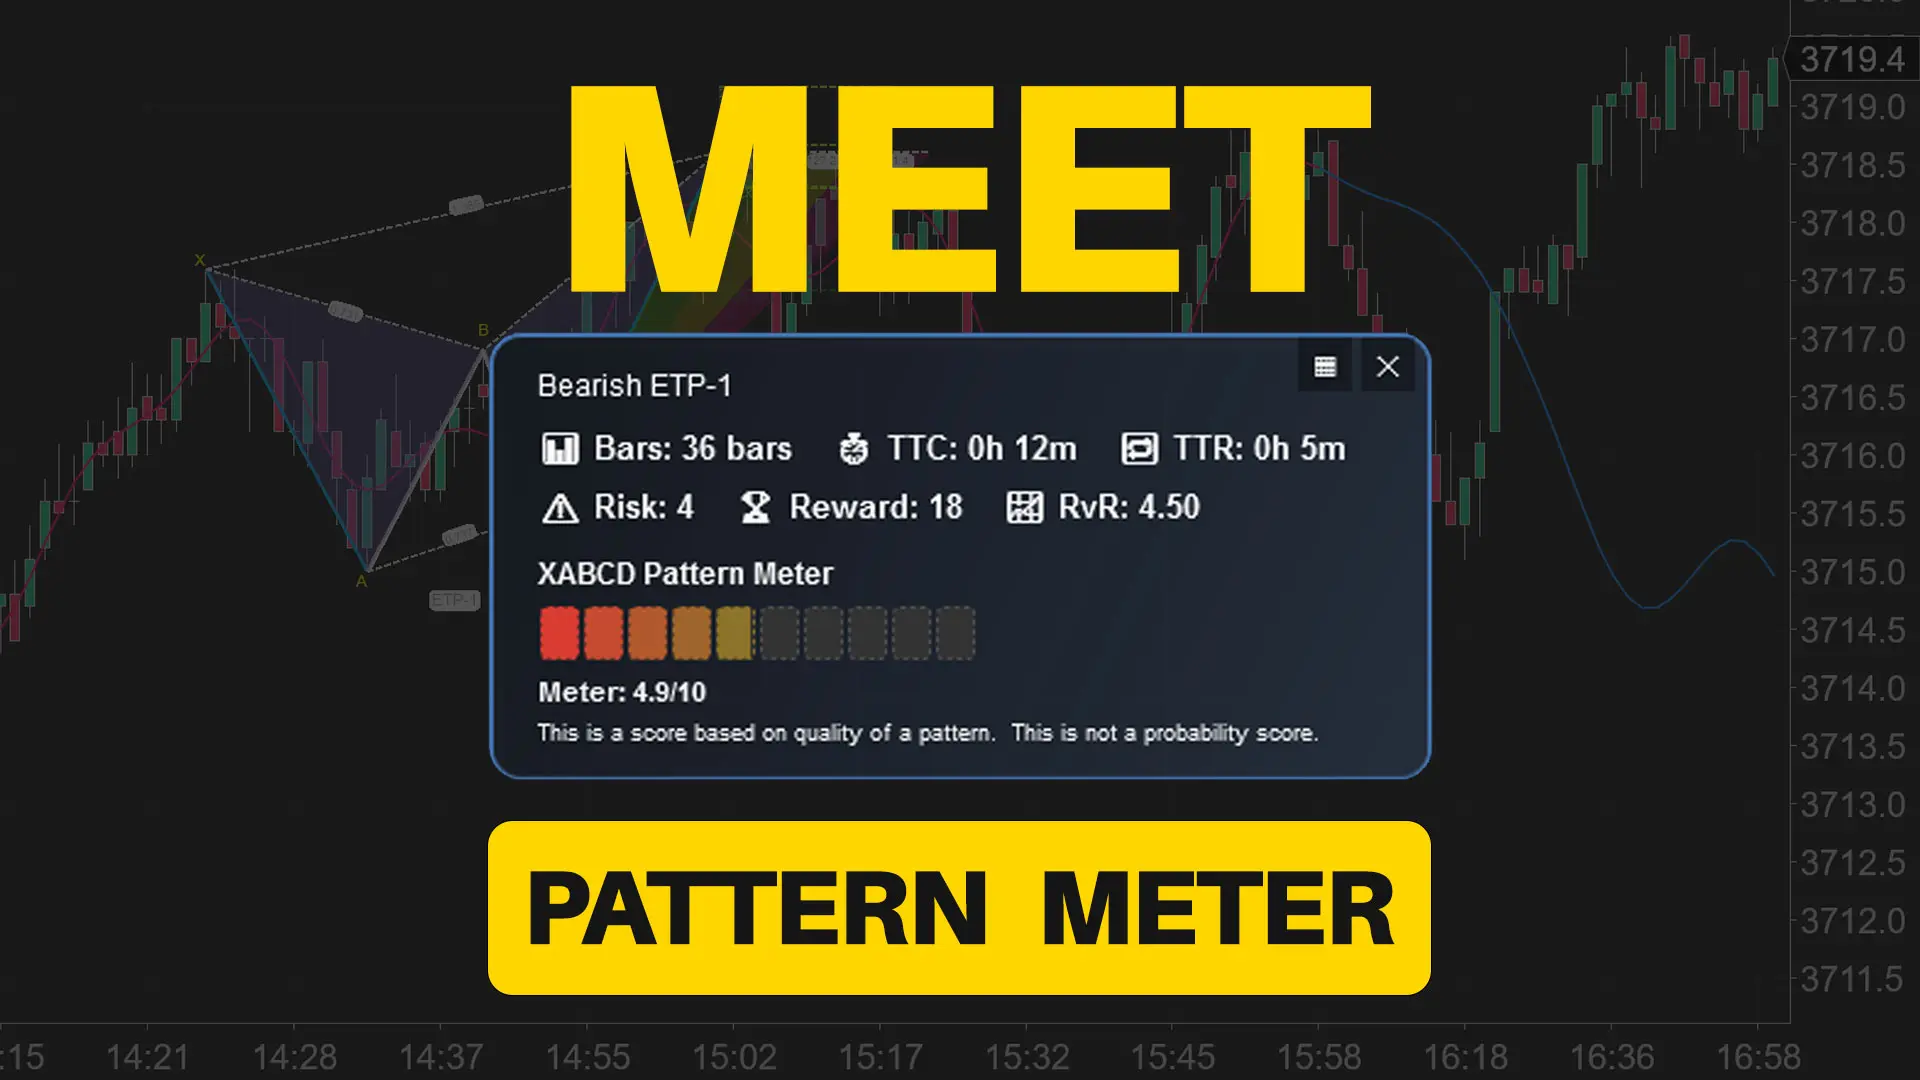
Meet the XABCD Pattern Meter (Real-Time Clarity)
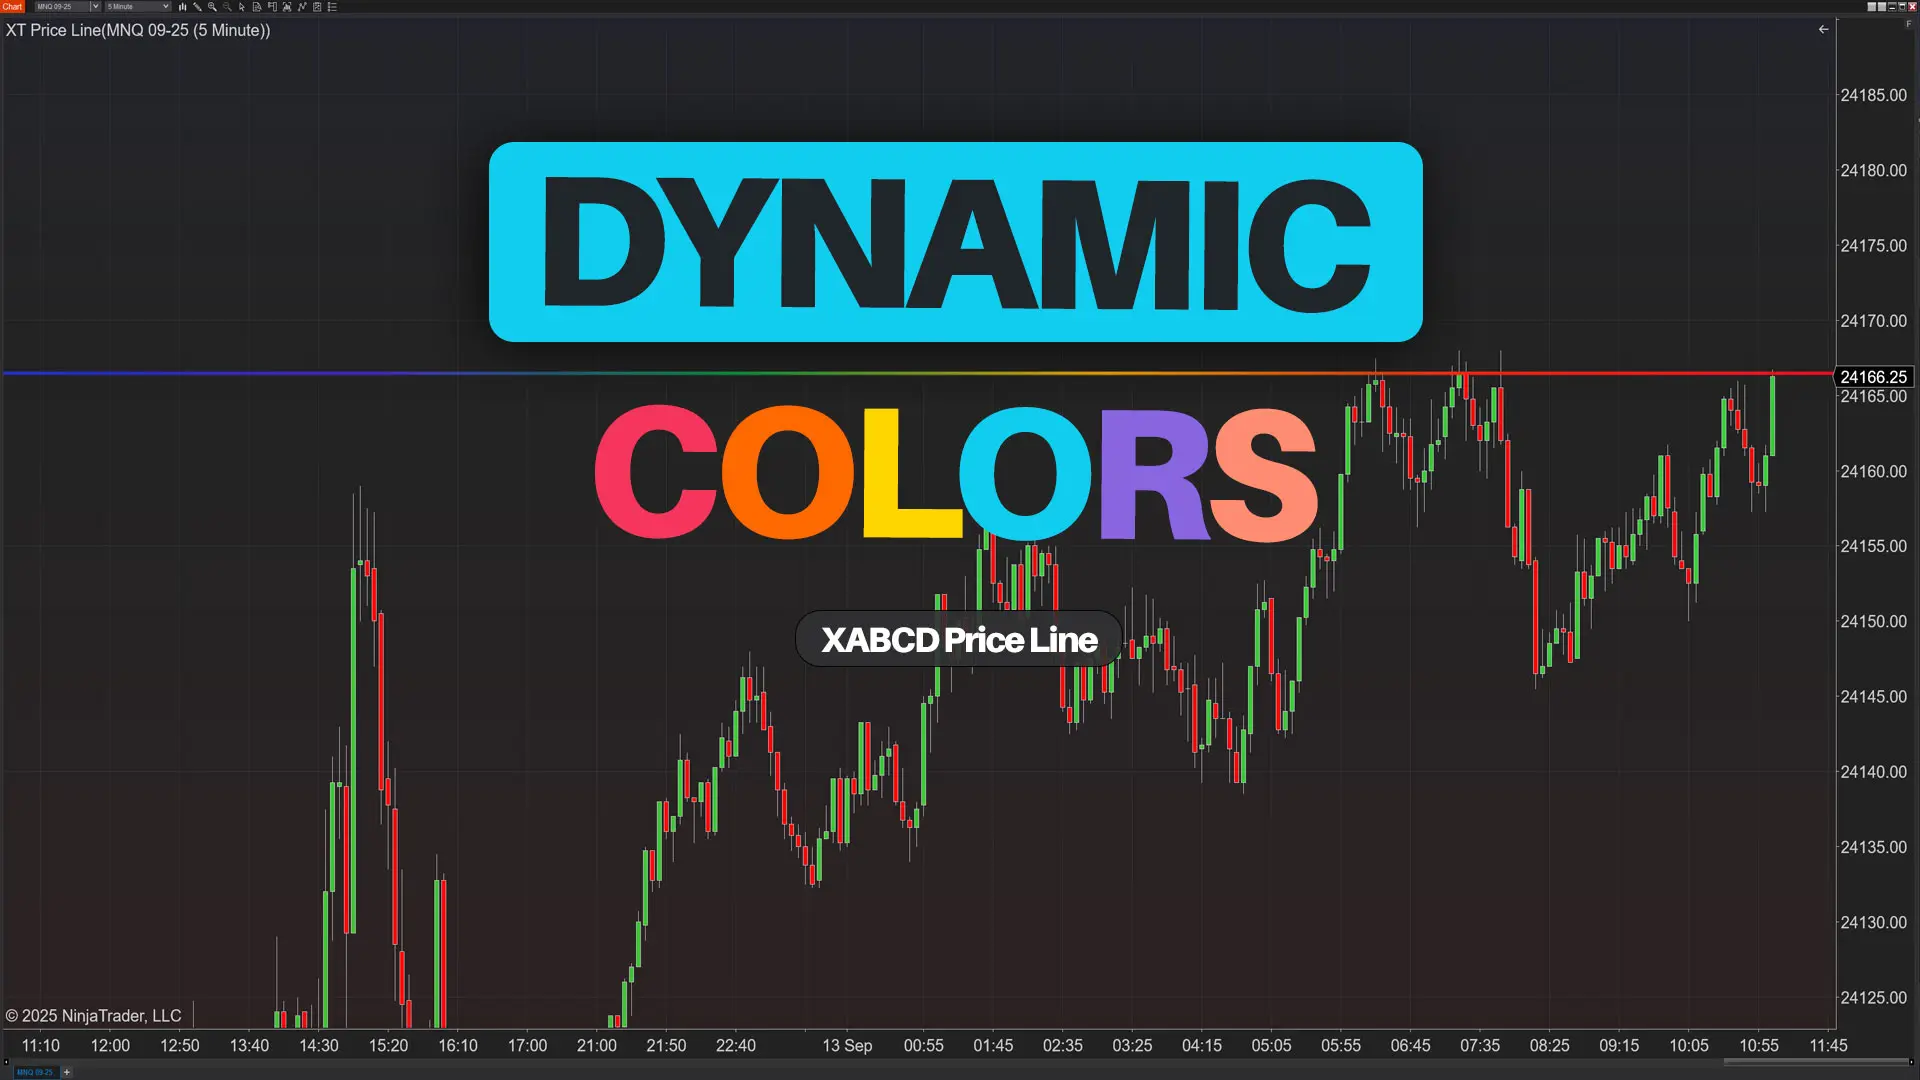
XT PriceLine: Dynamic Colors That Let You See Every Tick
Dominate the Market with Smarter Trailing Stops in NinjaTrader