XABCD TRADING
Does the XABCD Position Tool Lag?
Subscribe
to get alerts to our next blog post!
Built You a Way to See It for Yourself
Will the XABCD position tool lag used on fast-moving instruments or lower timeframes? Its important to quantify it too depending on how much lag you're talking about. Our tool used to take 500ms (half a second) to process your advanced orders from start to finish. See it waits to get all your orders and then submits them at once. However, we've figured out a way how to reduce that trading tool latency from 500ms and still submit all the orders and now most lag is 0.10-25ms.
To give you an idea, the average human reaction time is 200-250ms. 25ms = around 1/10th of your reaction time. 100ms is the same speed as it takes you to do a fast manual click which leaves total manual execution time around 120-300ms. So 25ms is faster than your mouse, faster than your brain and faster than most retail order routing.
New Feature: Live Lag Overlay
Do you want to see how much xabcd position tool lag in our software is causing your chart?
We added a built-in diagnostic display so you can see exactly how much trading tool latency there is at any moment. No guesswork, no wondering if things are slow or if it is just your imagination.
How to turn it on:
- Right-click the position tool on your chart
- Go to Properties
- Scroll down to the Custom Settings section
- Set Show Latency to True
- Click OK
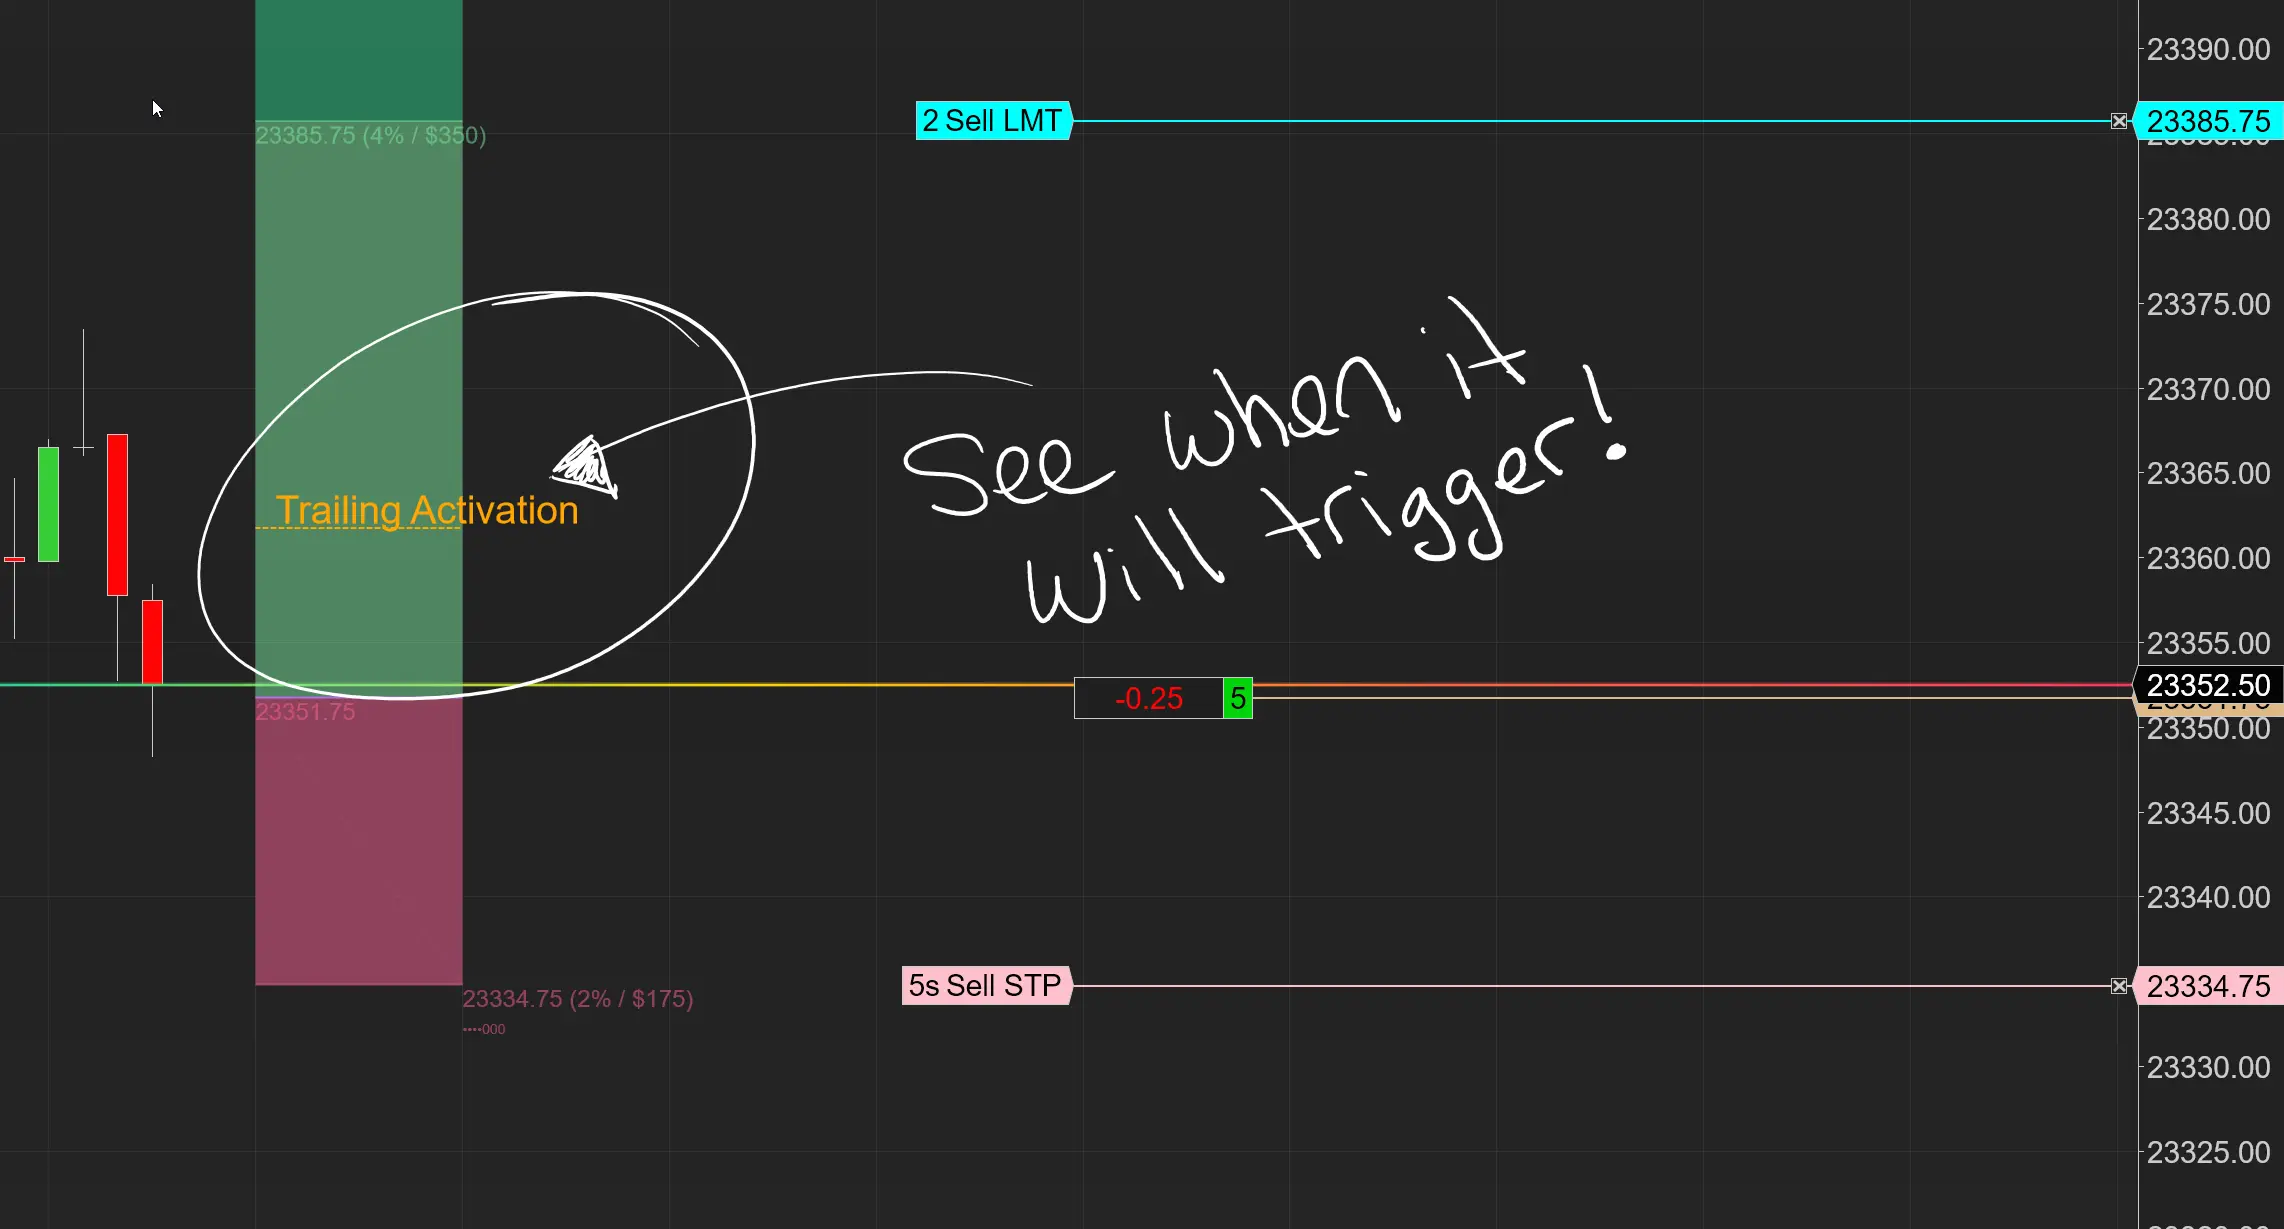
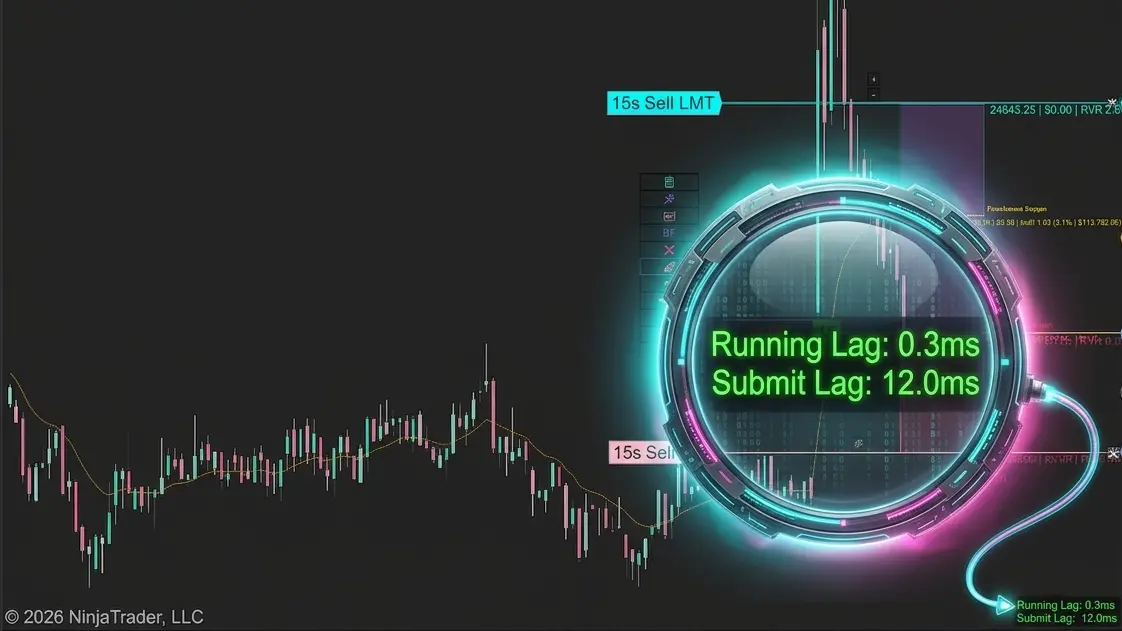
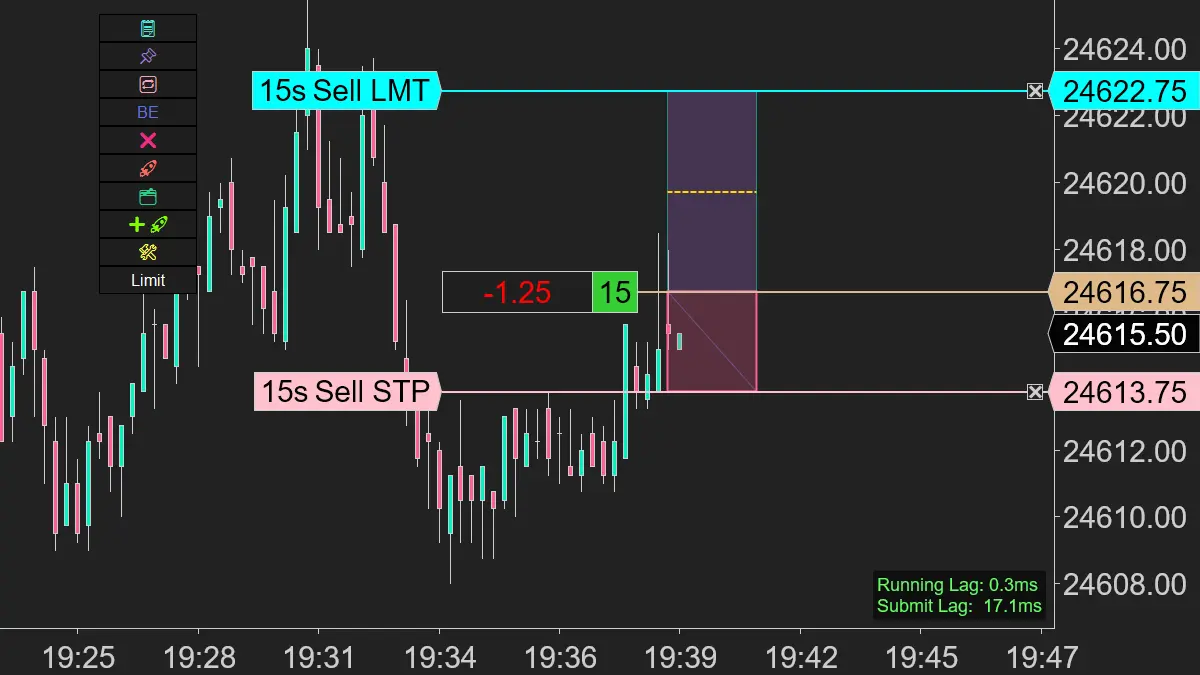
You will see a small label appear in the bottom-right corner of your chart.
What it Shows
XABCD Position Tool Lag in Two Categories
The overlay displays two numbers:
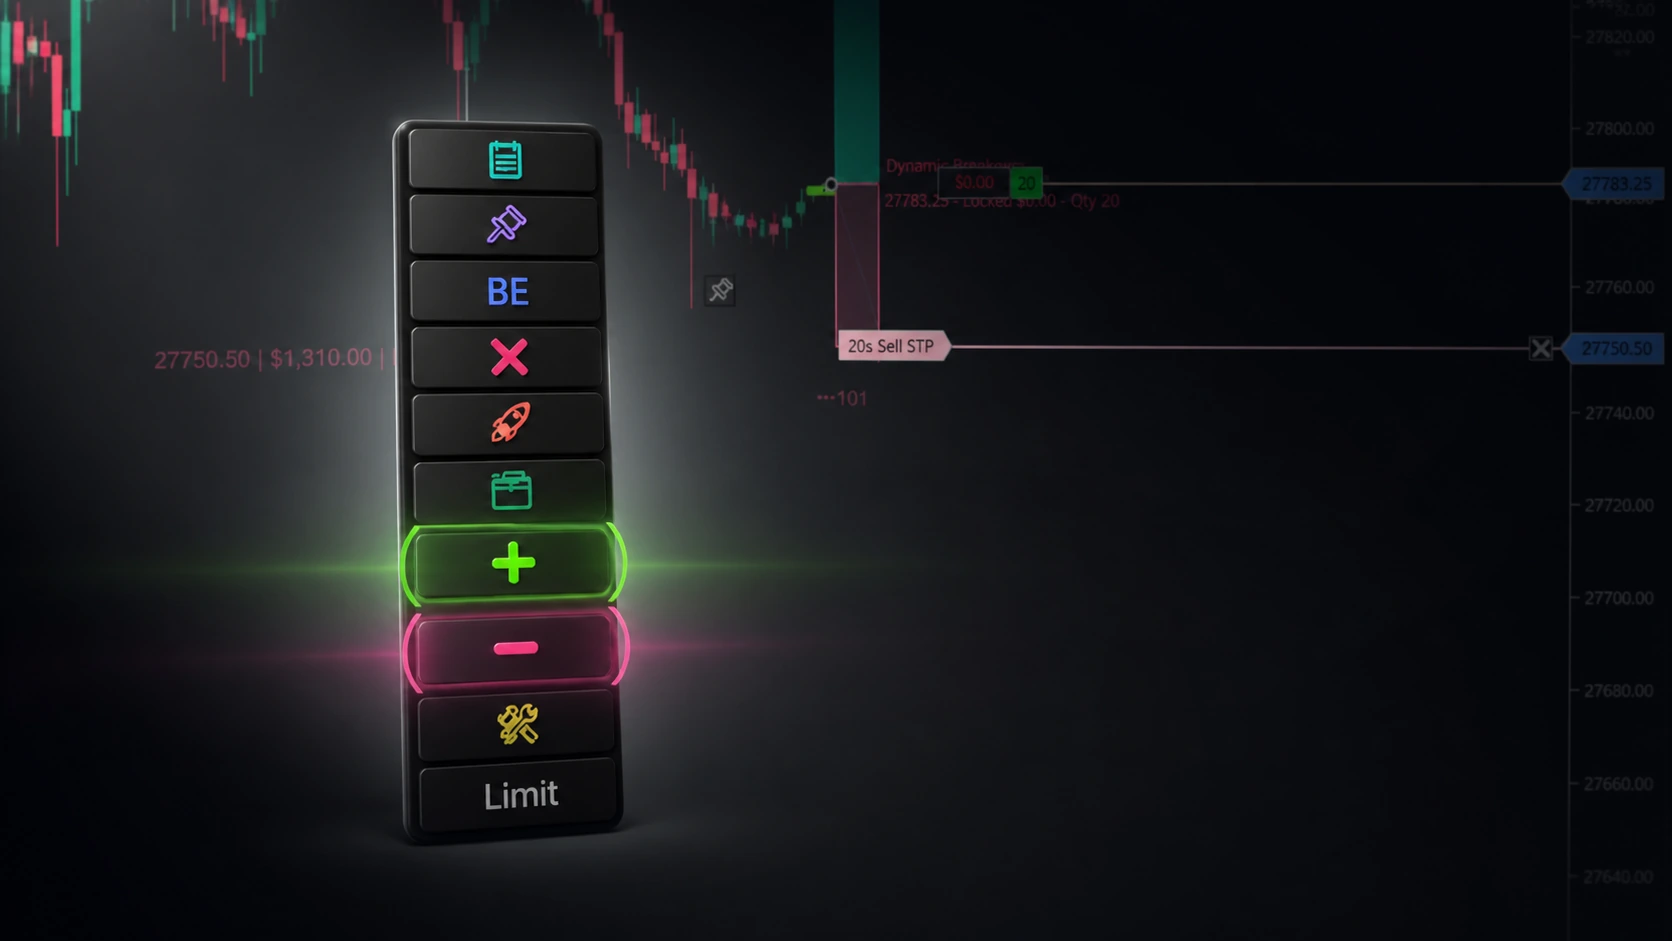
Running Lag — This is how long the tool spends drawing each render cycle, measured in milliseconds. It updates continuously in real time. This tells you how much work the tool is doing every time the chart redraws. A low number means the tool is lightweight and not slowing things down. A high number means something is making the tool work harder than usual.
Submit Lag — This is how long it takes from the moment you click Submit to when the order is actually sent to NinjaTrader. This only appears after you have placed an order. If this number is high, it means there was a delay between your click and the order reaching the platform. Under normal conditions this should be very fast.
What the Colors Mean?
The overlay changes color to give you a quick read on how things are going.
| Color | Latency | What It Means |
|---|---|---|
| Green | Under 150ms | Everything is running smoothly |
| Yellow | 150 – 300ms | Slight delay, usually fine |
| Red | Over 300ms | The chart is under heavy load |
If you are seeing green or yellow, you are in good shape and your XABCD position tool lag is basically non-existent.
If the overlay stays red, that tells you something on the chart is adding significant load. It might be the instrument, the number of indicators, or the timeframe. Either way, it gives you a starting point for troubleshooting and would recommend you download our free XABCD Performance Indicator for further troubleshooting skills.
How to turn it off
Same way you turned it on. Right-click the tool, go to Properties, scroll to Custom Settings, and set Show Latency back to False. The setting is saved with your templates, so if you have it turned on in a template it will stay on for any chart that uses that template.
When This Matters Most
You will notice the biggest improvement in these situations:
- Lower timeframes where ticks arrive rapidly
- Volatile instruments like NQ, ES, or CL during news events
- Charts with multiple indicators that add rendering load
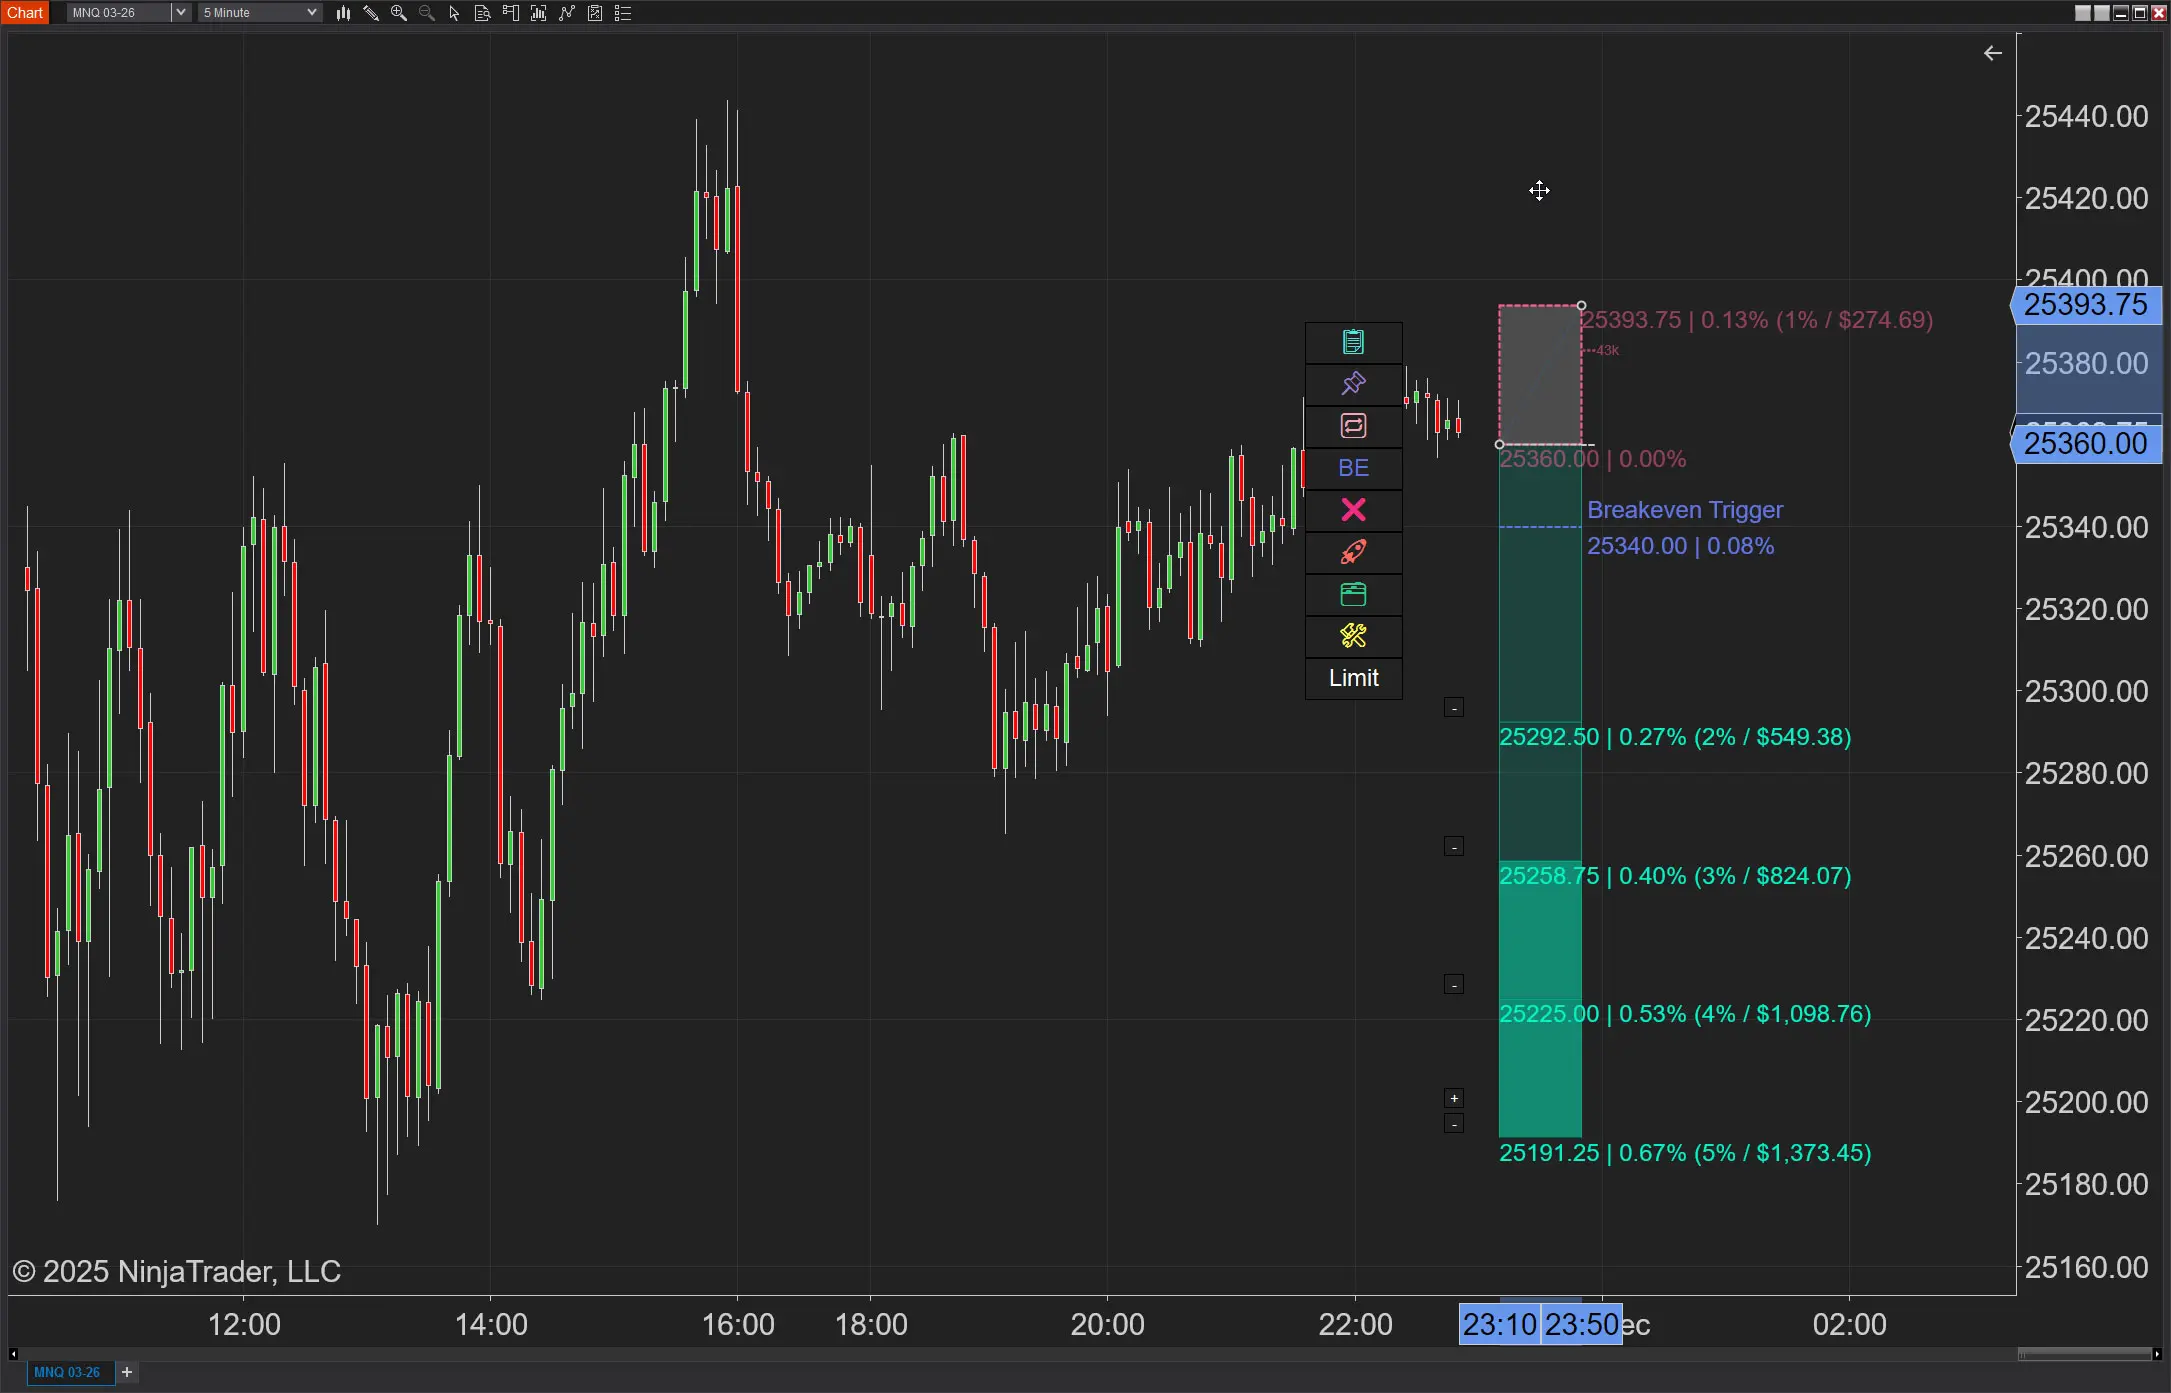
- Scaling in and out of positions where the tool needs to recalculate frequently
If you were avoiding lower timeframes because the tool felt sluggish, give it another try with this update.
If You Still See Lag
Turn on the latency overlay and watch the numbers. If Running Lag stays in the red, take a screenshot and send it over in a support request. Support requests can be sent when you login to your account from the menu and you can upload attchments. That tells us exactly what the tool is experiencing and lets us dig into the specific cause. The overlay turns a vague report of "it feels slow" into a concrete data point we can act on.
You can figure out the exact cause by backing up your \Documents\NinjaTrader 8\ to a different folder and then starting from scratch. Install NinjaTrader, let it recreate your \Documents\NinjaTrader 8\ and it will be a fresh copy.
Toss on our position tool and you'll see things run with the baseline lag lower than 50ms. Keep adding your old stuff one by one until you find out what triggers it or check out NinjaTrader 8 Performance Tips. Also a good idea to visit NinjaTrader 8 realistic system requirements.
FAQ
Why does the XABCD position tool lag on my trading platform?
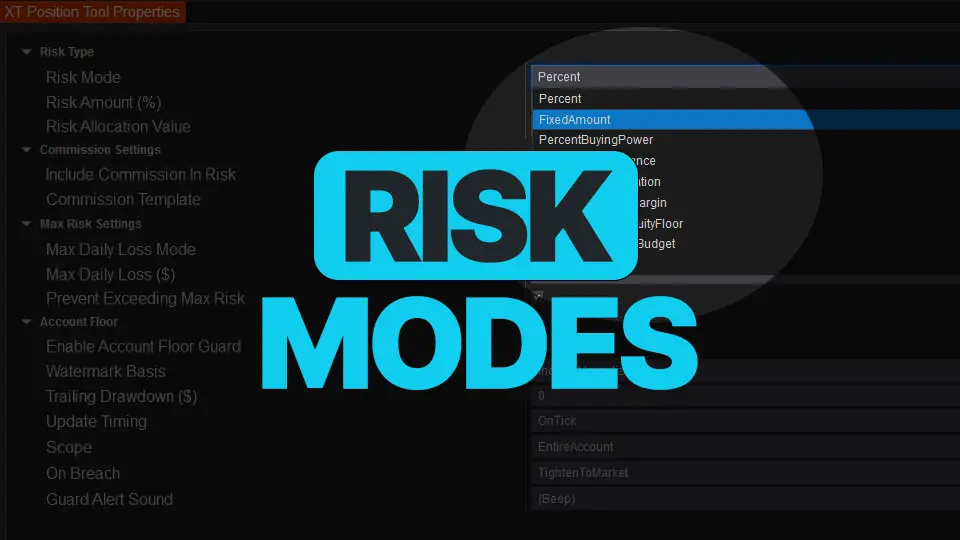
XABCD position tool lag woudn't be caused by our software in the rare case any does show up. Typically caused by high CPU usage (perhaps not meeting the minimum NinjaTrader system resources, excessive indicators running simultaneously, or a slow data feed connection. If you really need to find the root cause I would start with a default blank template, add our XABCD Position Tool.
Then verify there is no lag (which you'll see your baseline in the green range) then you would want to add on each indicator to build back your template one at a time. This approach will reveal which tool on your system is delaying execution in your platform as a whole (and noy just on our tool).
Does the XABCD pattern tool slow down NinjaTrader or other charting software?
The XABCD pattern tool has been extensively tested. So typically any performance issues can be traced back to other hardware / software on the machine such as limited RAM or processing power. Especially when applied to multiple charts at once.
However, if your install our free XABCD Performance tool, we report the amount of resources all our tools are using so that everything is clear and transparent - plus we breakdown different acceptable thresholds depending on your type of trading. It's really neat if you have not run it before.
What are the system requirements to run XABCD tools without performance issues?
To run XABCD tools smoothly, you generally need at least 8 GB of RAM, a modern multi-core processor, and a stable broadband internet connection. A dedicated graphics card is not usually required, but ensuring your operating system and trading platform are up to date is essential. Closing background applications and browser tabs can also free up resources and prevent lag.
Is XABCD position sizing tool lag caused by the broker's data feed?
In some cases, lag in the XABCD position sizing tool can be traced back to a slow or unstable broker data feed rather than the tool itself. When the data feed delivers delayed or inconsistent tick data, the tool must wait for accurate price information before calculating position sizes. Switching to a faster data provider or contacting your broker about feed quality can help resolve this type of lag. However, I'd first get you to use the XABCD Performance tool to narrow down that bottleneck.
New NinjaTrader Articles Delivered First

Easy Order Tool
The Strategy


Scanning & Alerting

NinjaTrader Release

XABCD News (Free Version)
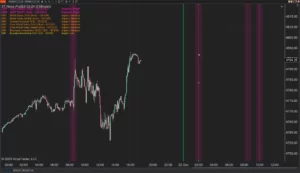
XABCD News (Community Edition) is the best free Indicator for NinjaTrader 8. Don't let news sneak up on you again. Puts economic news events on your charts so you can stay informed and move around positions/stops before the news is released. Works in any market.
XABCD Priceline (Free)
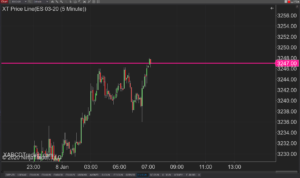
XABCD Price Line tool for NinjaTrader 8 will draw a line at current price and move every time the market changes price. This is useful because it will allow you to easily identify where price is at all times and the exact quoted price.
NinjaTrader Position Sizing Tool: 64 Features Stock NT8 Does Not Include
NinjaTrader – Adding to Position: A Field Guide for Active Traders
NinjaTrader Prop: The Ultimate Guide to Prop Firm Trading
Does the XABCD Position Tool Lag?
NinjaTrader Position Sizing: What the XABCD Position Tool Can Do That ATM’s Can’t
NinjaTrader Risk Management That Actually Moves the Needle
NinjaTrader 8.1.6 — The “No Fluff” Tour (Speed, Clarity, Fewer Clicks)
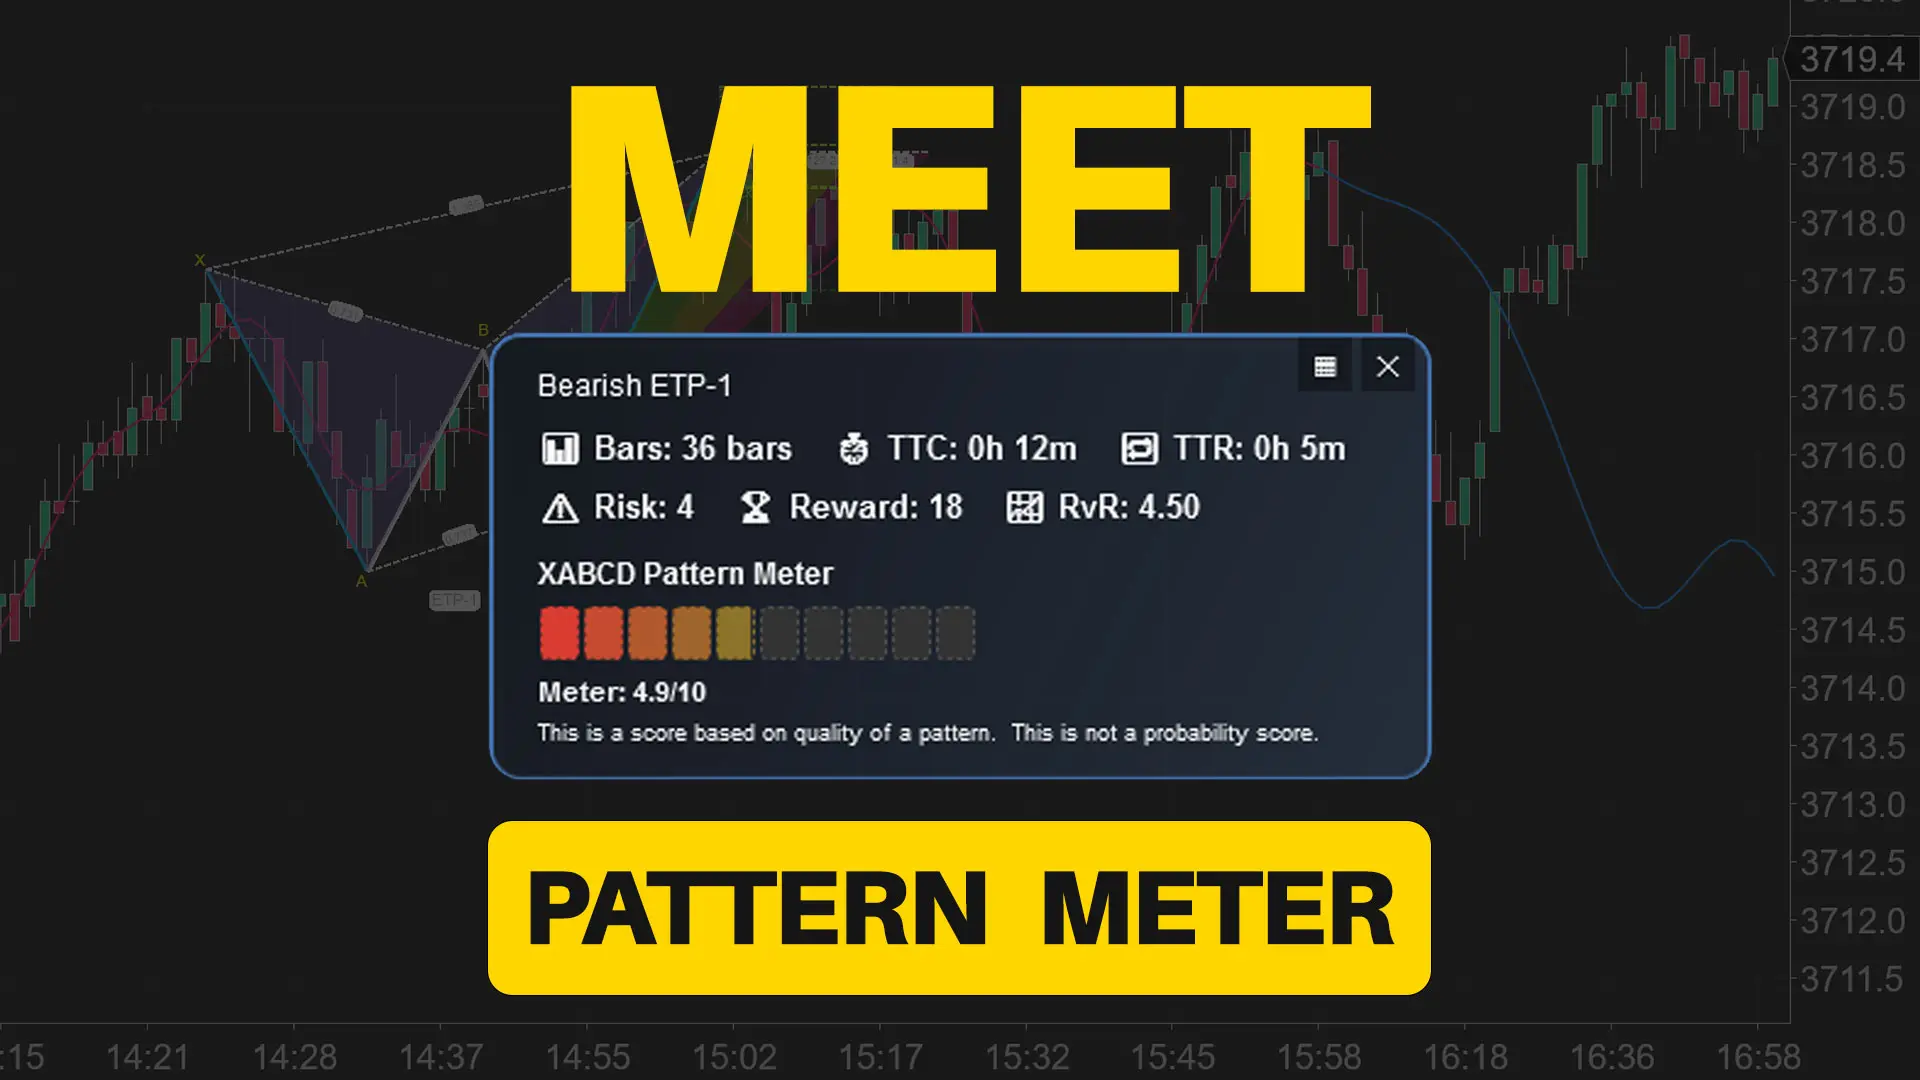
Meet the XABCD Pattern Meter (Real-Time Clarity)
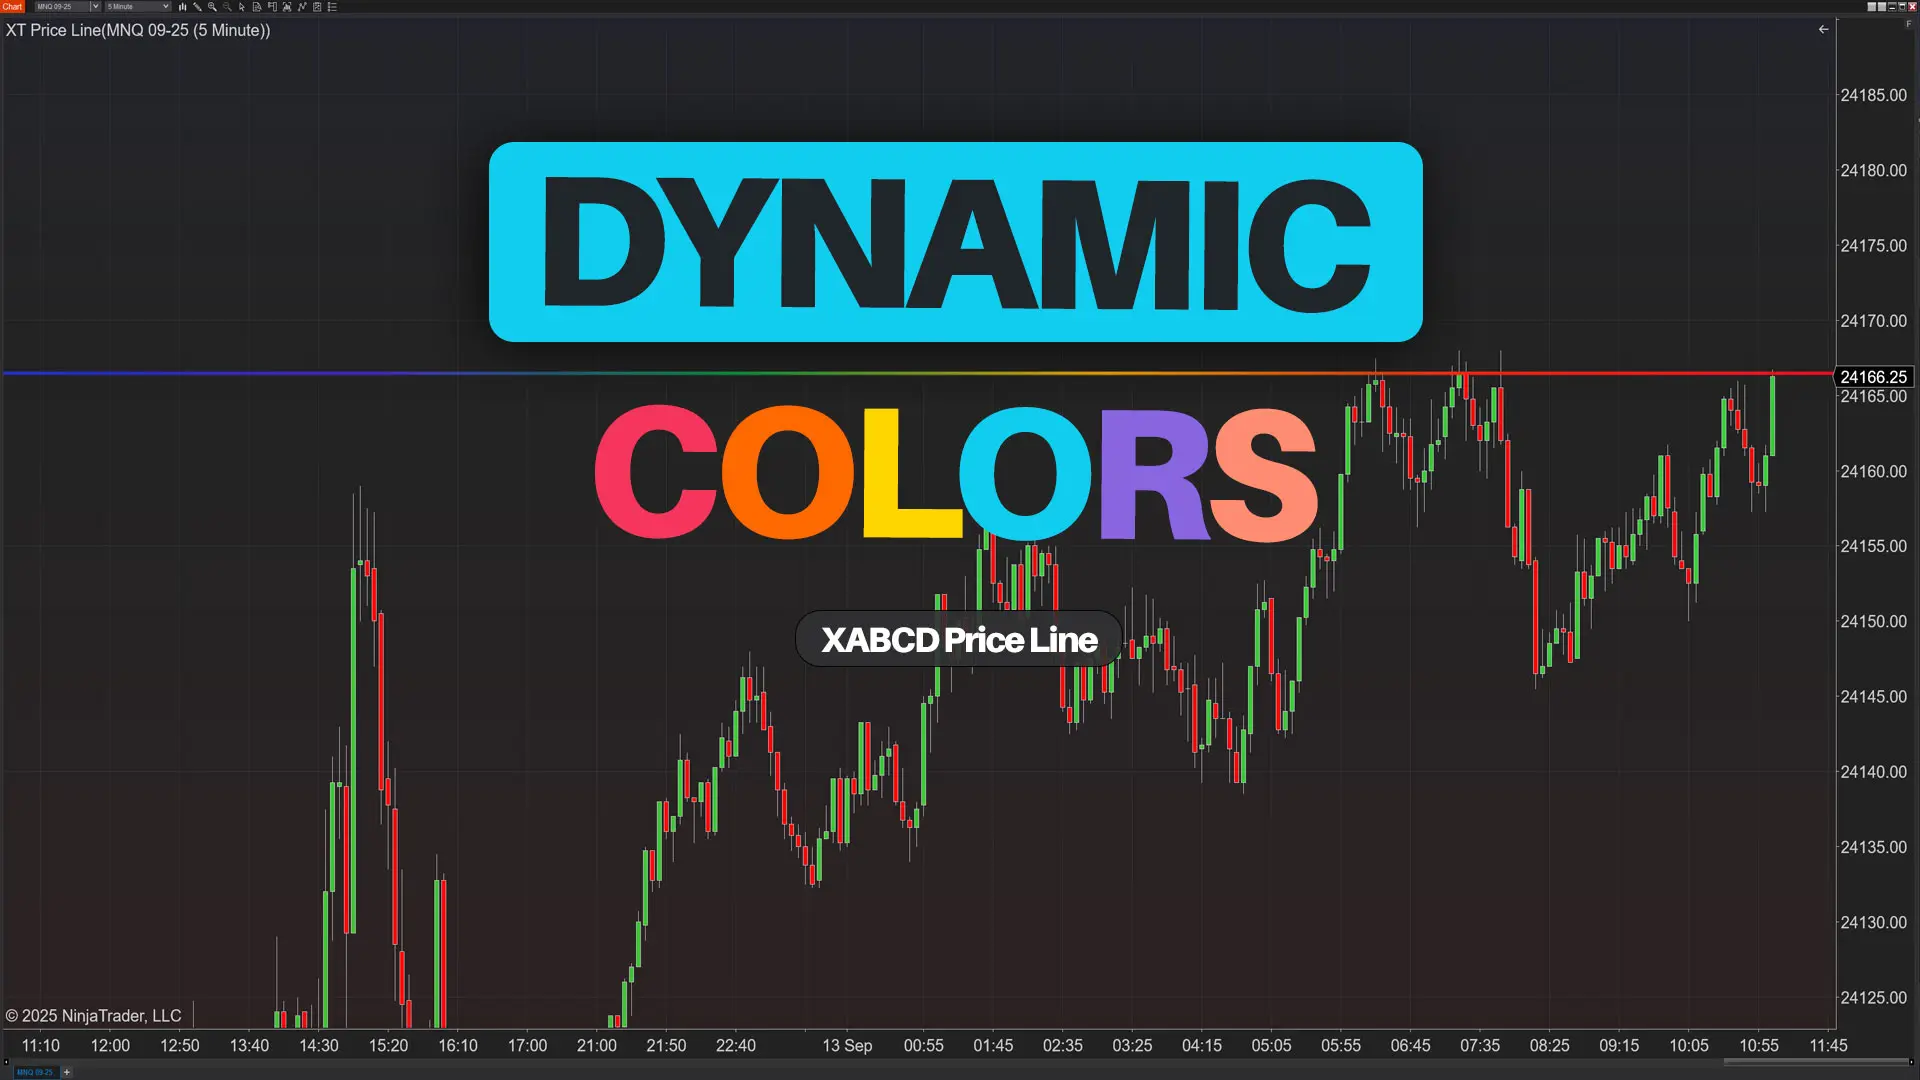
XT PriceLine: Dynamic Colors That Let You See Every Tick