XABCD TRADING
How to Customize the Fibonacci Retracement and Extension Levels?
Subscribe
to get alerts to our next blog post!
Customizing Fibonacci Levels
Fibonacci retracement and extension customization doesn't have to be hard. In fact, NinjaTrader 8 makes this very easy to do. You can also do this in MetaTrader 4 and MetaTrader 5 as it would work the same way. If you use a different platform and can't figure out how to do it, drop a comment below and we'll help you figure it out.
Below we're going to discuss two important topics.
- How to modify your Fibonacci levels in the drawing tool settings
- How to save them as a default setting so you don't have to change them every time.

How to Modify Fibonacci Level's in NinjaTrader 8?
(The same basic principal might apply to your charting platfrom too if you don't use NinjaTrader 8)
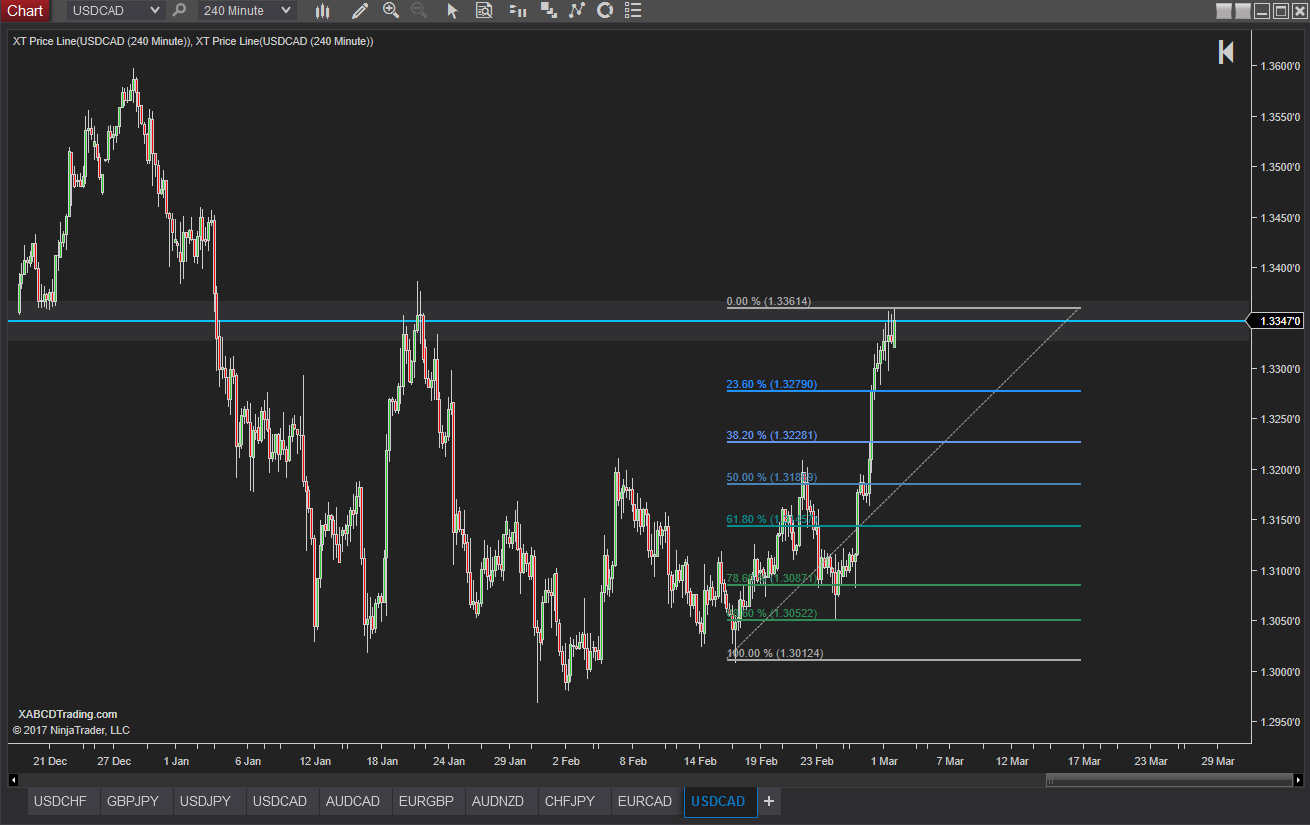
Step 1 - Place the Tool on the Chart
- Draw the Fibonacci Retracement tool onto a chart. You can do this by clicking on the pencil icon on the chart's menu and going down to Fibonacci retracement.
Pressing the short cut key F8 is a quicker way to draw the Fibonacci retracement.
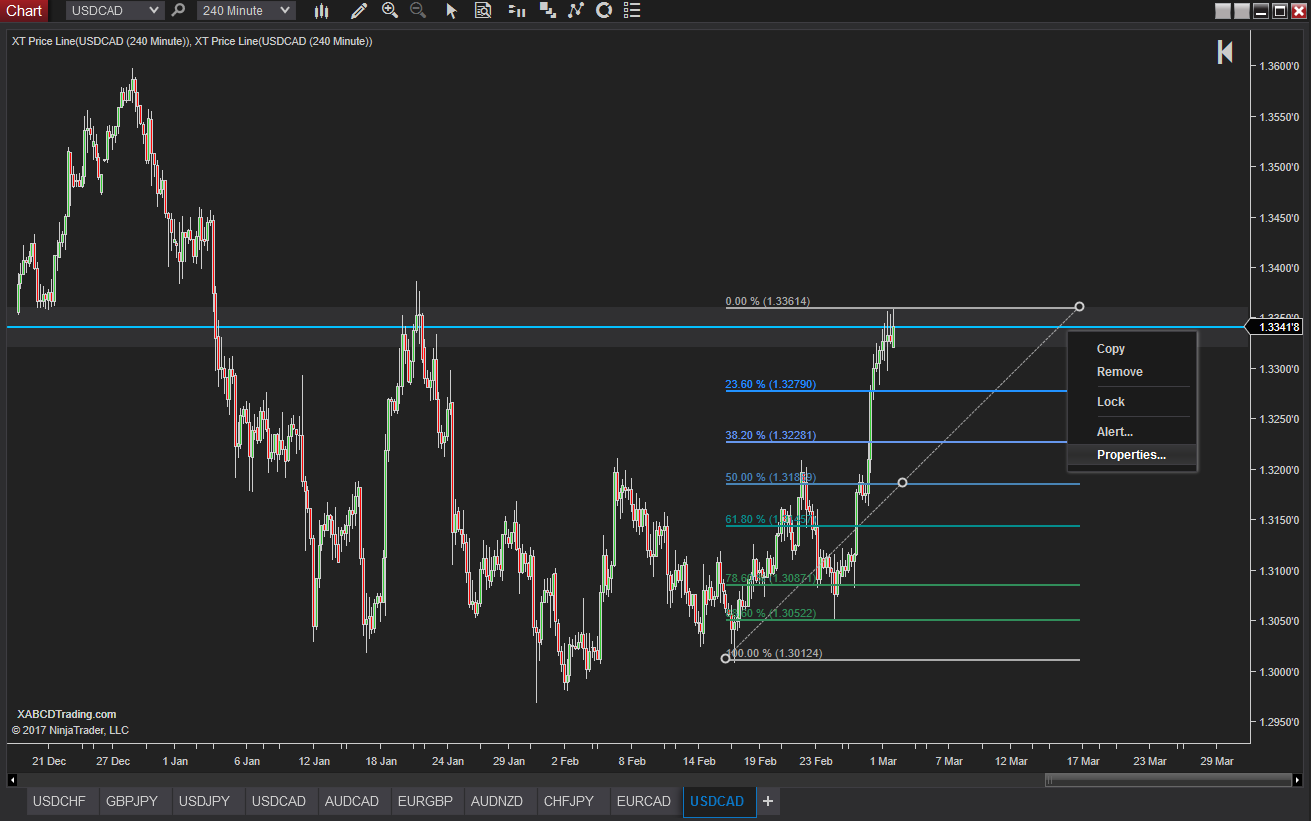
Step 2 - View The Indicator Properties
- Right Click on the chart's Fibonacci tool that you just created in step 1.
- Select Properties...
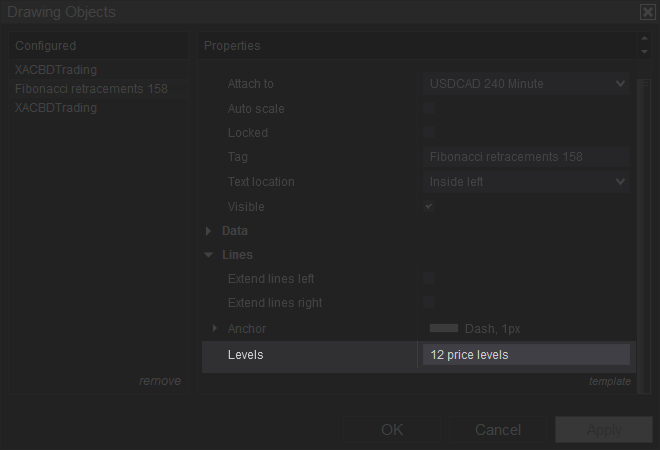
Step 3 - Edit the Price Levels Section
- Scroll Down under the properties.
- When you hover your mouse over the "12 price levels" or whatever number you have listed, it will change to Edit price levels...". Select this option and a new window will open.
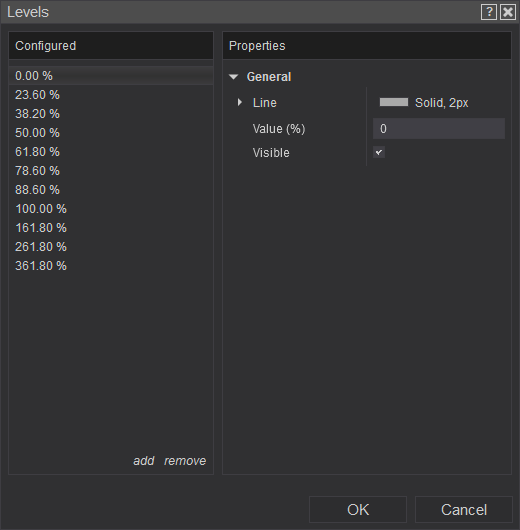
Step 4 - Add in the Levels
- Add / Remove buttons are at the bottom of the window where you can add in different levels. Press OK when done to close the price level window and then you will see "templates" in the bottom right. Click on Template and hit "Save".
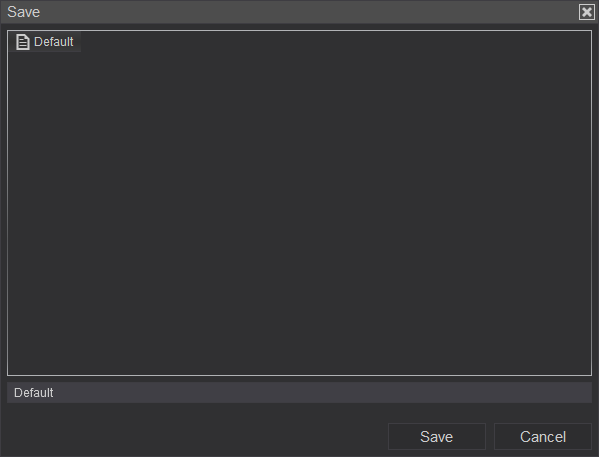
Step 5 - Save Your Changes
- Call it default so that it will use these ratios every time you use the tool from now going forward.
- If you call it anything but default, it will not use your customization the next time you use the tool automatically.
Why Modify Your Fibonacci Level's?
It's a great question, but a lot of brokers will include the primary levels like the 38.2%, 61.8% but when it comes to a lot of the secondary level's they tend to leave them out. Maybe it is to prevent too much confusion but your guess is as good as ours. Whatever the reason, i've never seen any one broker that has the same level's as default so it's great to know how to edit them.
What is Fibonacci Retracement Levels in Forex, Stocks and Futures?
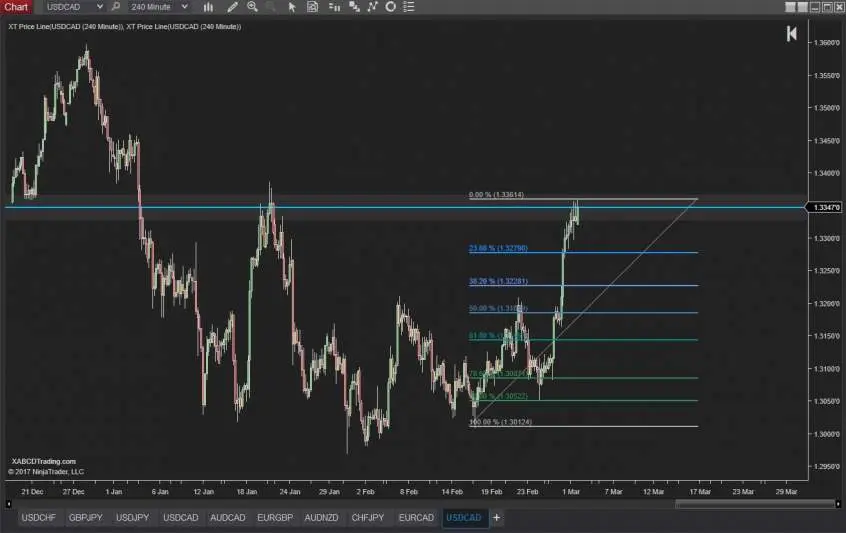
A Fibonacci retracement level (or for short, a "fib level") is just a measurement of how far price retraces from any high to low in your charts. The different levels are just a vertical distance in a percentage from the Fibonacci sequence and where technical analysis traders look for support and resistance in their chart.
We use Fibonacci retracement levels to construct patterns. It won't matter if your doing this if you're forex trading, stock trading or using it on the futures market. Most of our 5 point patterns is a combination of 12 fibonacci measurements using both Fibonacci time and Fibonacci price. This can be a lot to draw out manually which is why we have drawing tools for NinjaTrader 8 that let you do it in just 5 clicks.
How to Calculate Fibonacci Retracement and Extension Levels?
Fibonacci retracement and extension levels are calculated using ratios from the Fibonacci sequence. The Fibonacci sequence is a series of numbers in which each number is the sum of the two preceding ones. It starts with 0 and 1, and the sequence continues infinitely. Traders and analysts use these levels to identify potential support and resistance levels in financial markets.
To calculate Fibonacci retracement levels, follow these steps:
1. Identify a significant price move: Look for a strong upward or downward trend in the price chart of a financial instrument.
2. Determine the swing high and swing low: Locate the highest point (swing high) and lowest point (swing low) of the identified price move.
3. Calculate the retracement levels: Use the following Fibonacci ratios to calculate the retracement levels: 23.6%, 38.2%, 50%, 61.8%, and 78.6%. These levels represent potential areas where the price may retrace before continuing in the direction of the original trend.
Fibonacci ratios are just percentages of that total move. So if a move has gone from a low to a high, and retraced half way, then its a 50% Fibonacci retracement.
How to use Fibonacci in Trading
In trading, the XABCD pattern is based off time and price that incorporates Fibonacci ratios to identify potential market reversals and continuation points. The Fibonacci ratios are used in every aspect of the pattern to form a consistent shape.
Watch this video on how we map out patterns using Fibonacci ratios:
If you can't watch the video above then i'll try to explain this in words. A pattern is made up of directional moves (retracements and extensions) of each leg of the pattern. Each leg segment for both time and price is measured which is why there are 12 measurements to do in total. You will need to measure both up and down(price), and left to right (time). All of these measurements should come together at one point which we call the "D" point.
A complete guide on XABCD Patterns is going to be very useful for getting a better understanding of how these Fibonacci based patterns work.
New NinjaTrader Articles Delivered First

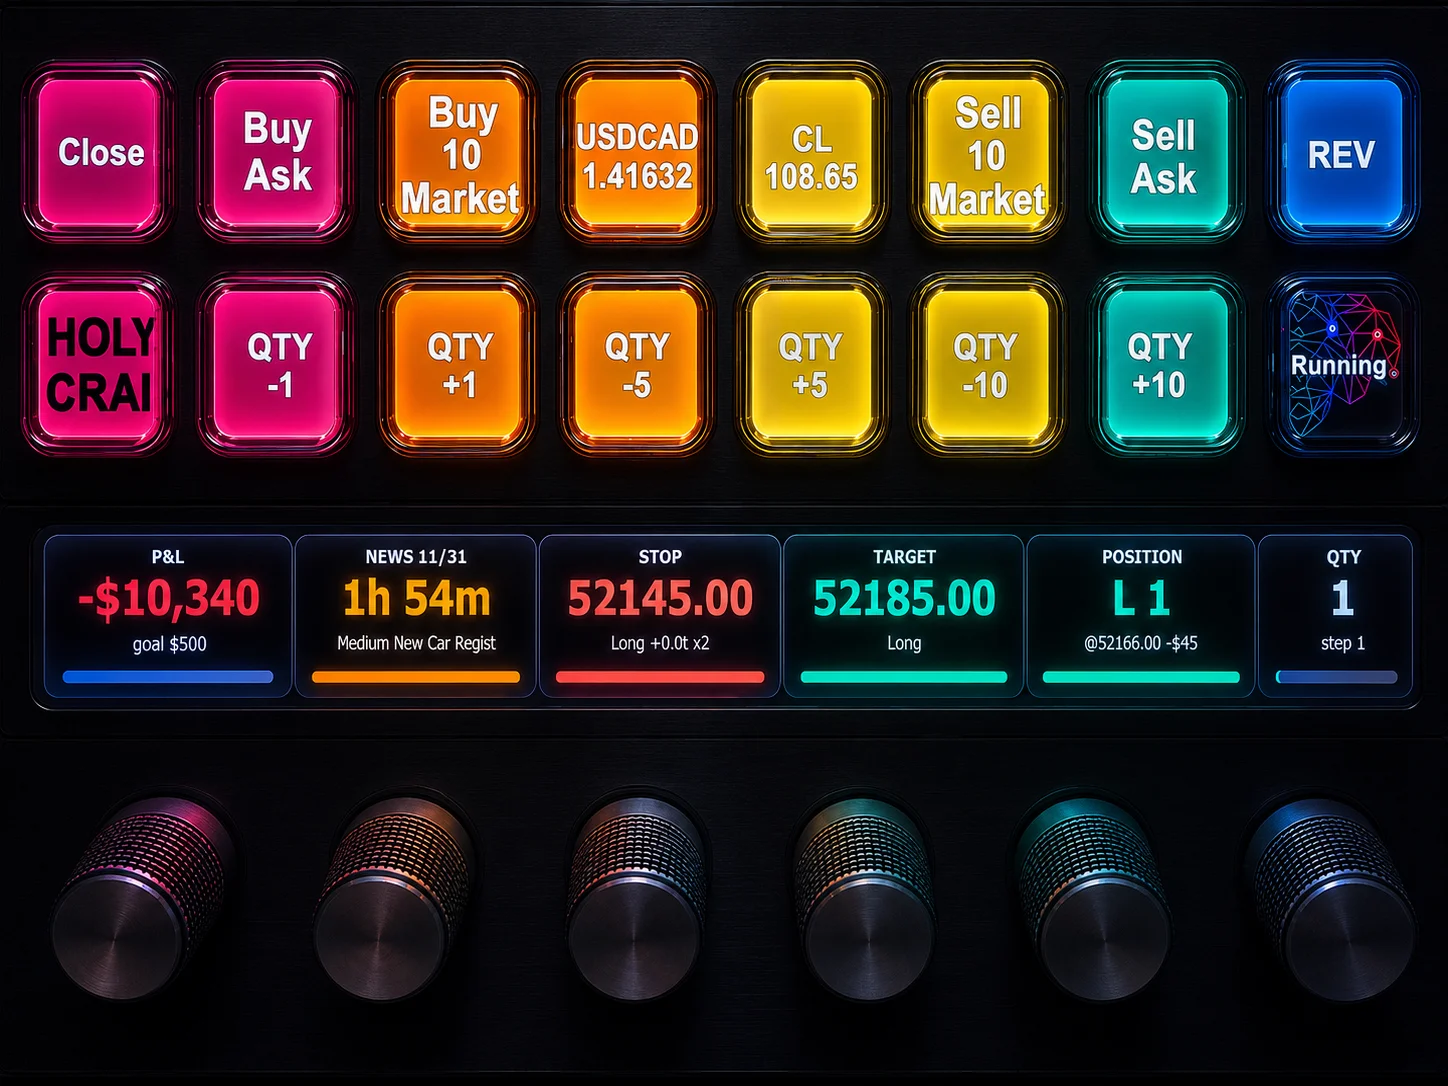
Easy Order Tool
The Strategy


Scanning & Alerting

NinjaTrader Release
XABCD News (Free Version)
XABCD News (Community Edition) is the best free Indicator for NinjaTrader 8. Don't let news sneak up on you again. Puts economic news events on your charts so you can stay informed and move around positions/stops before the news is released. Works in any market.
XABCD Priceline (Free)
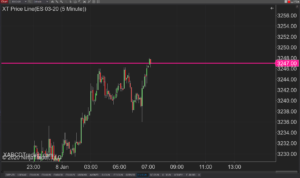
XABCD Price Line tool for NinjaTrader 8 will draw a line at current price and move every time the market changes price. This is useful because it will allow you to easily identify where price is at all times and the exact quoted price.
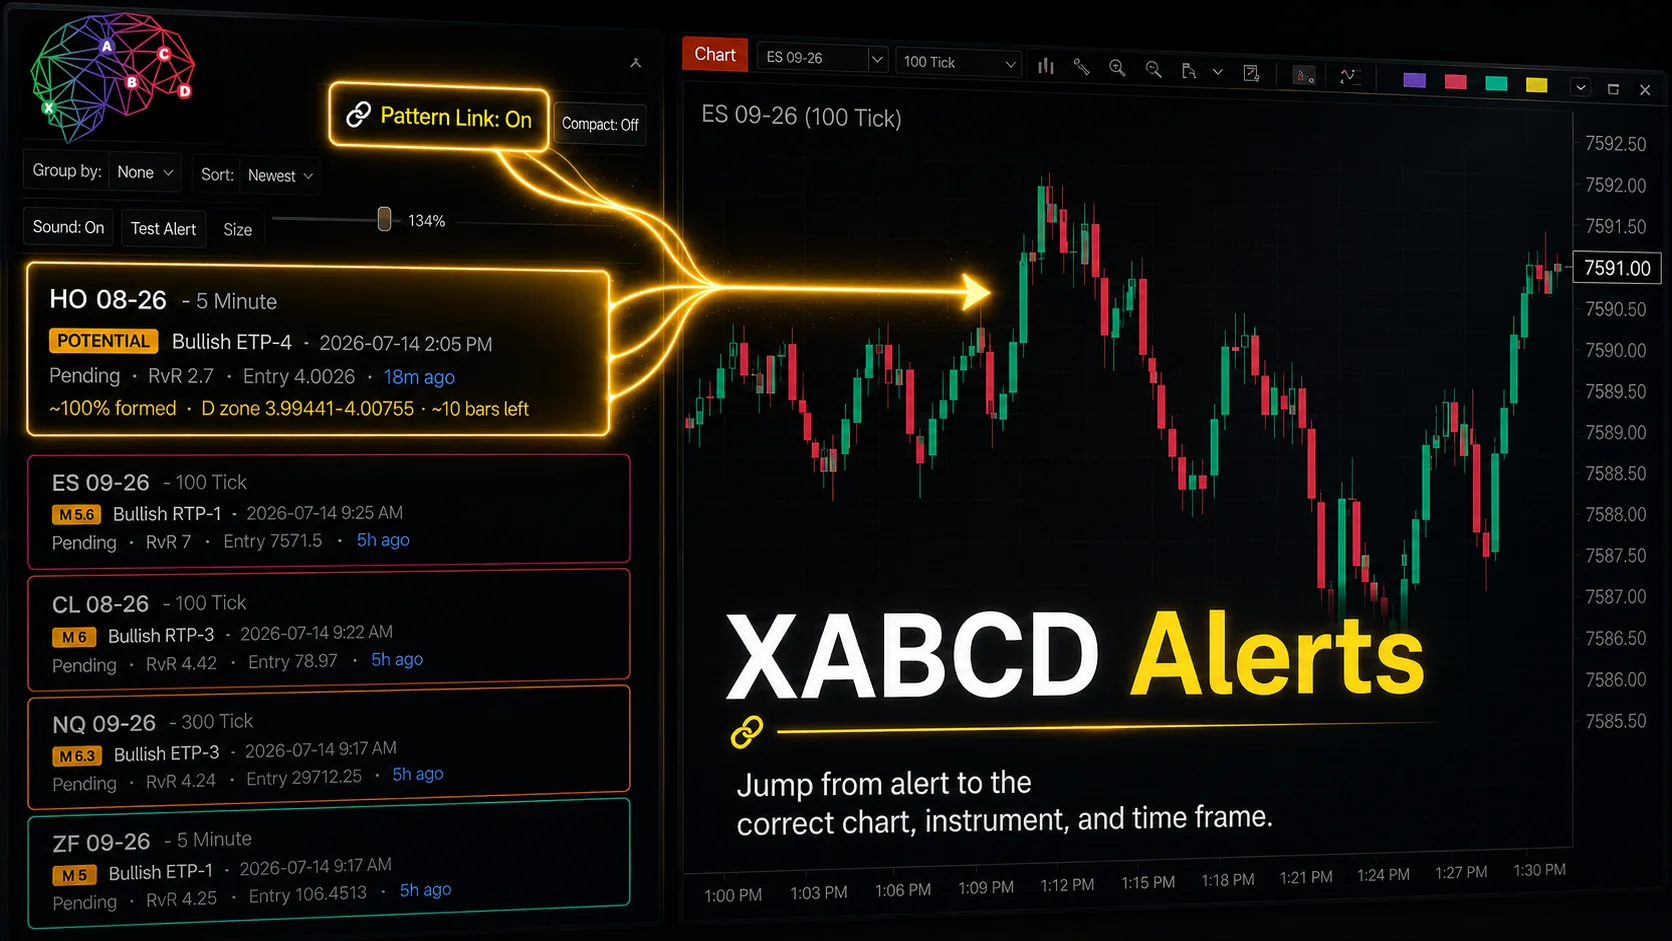
XABCD Pattern Alerts: The Complete Guide for Traders
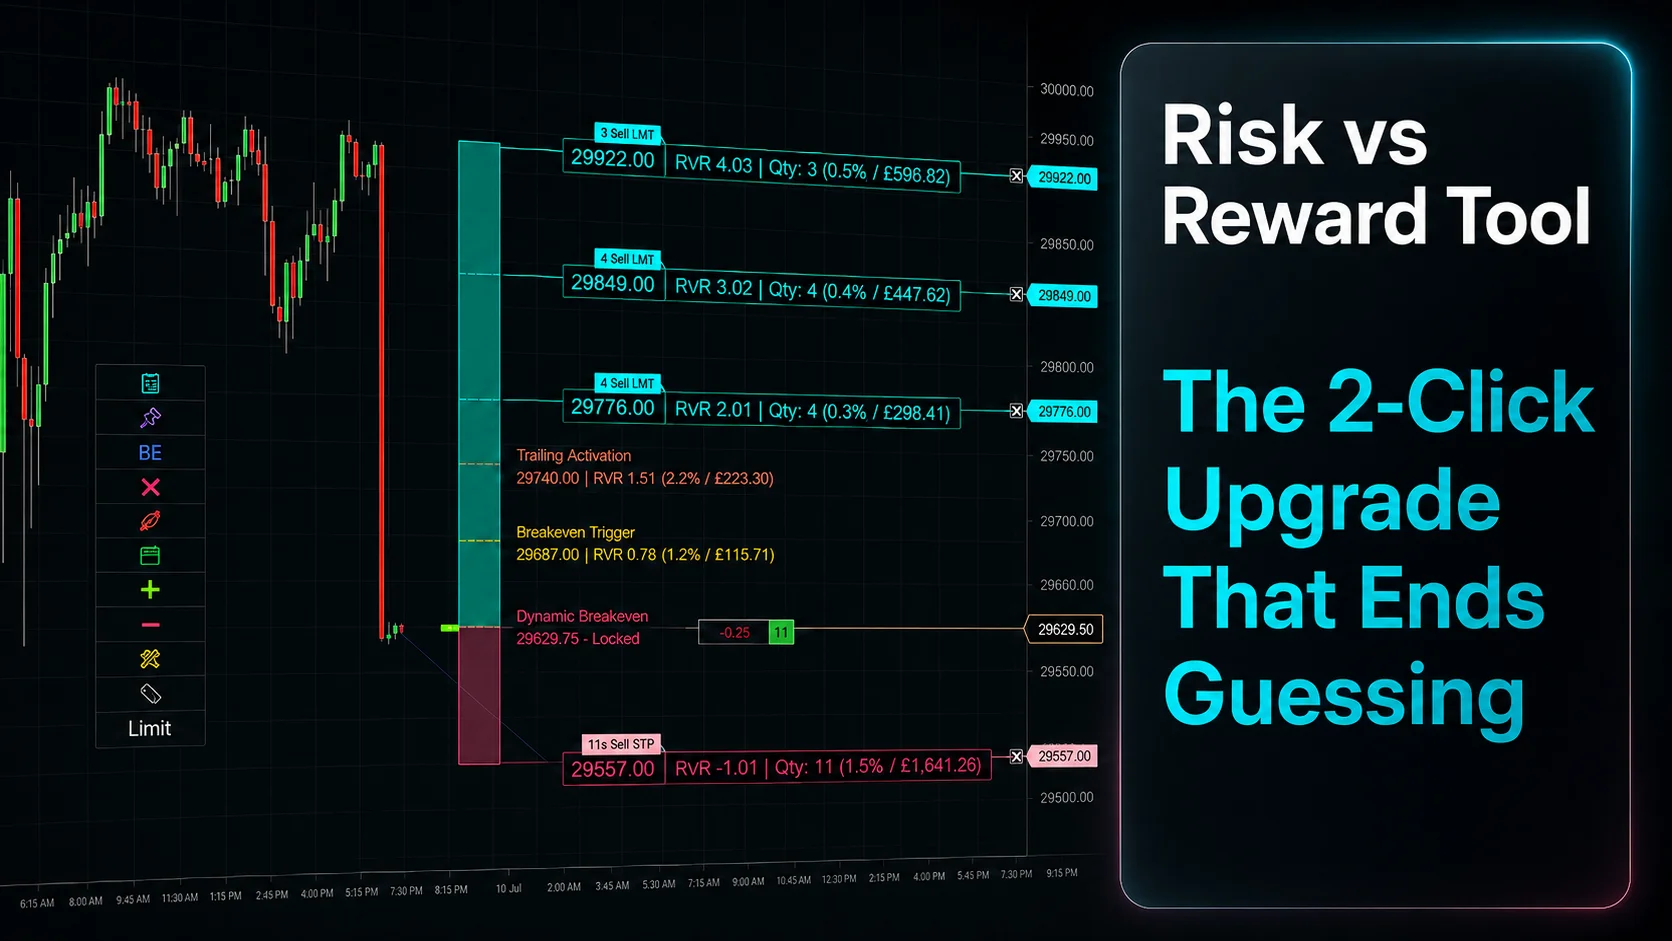
Risk vs Reward Tool: The 2-Click Upgrade That Ends Guessing
NinjaTrader Faster Last Price Updates on Charts Explained
NinjaTrader 8 Hotkeys: Best Shortcuts for Faster Trading
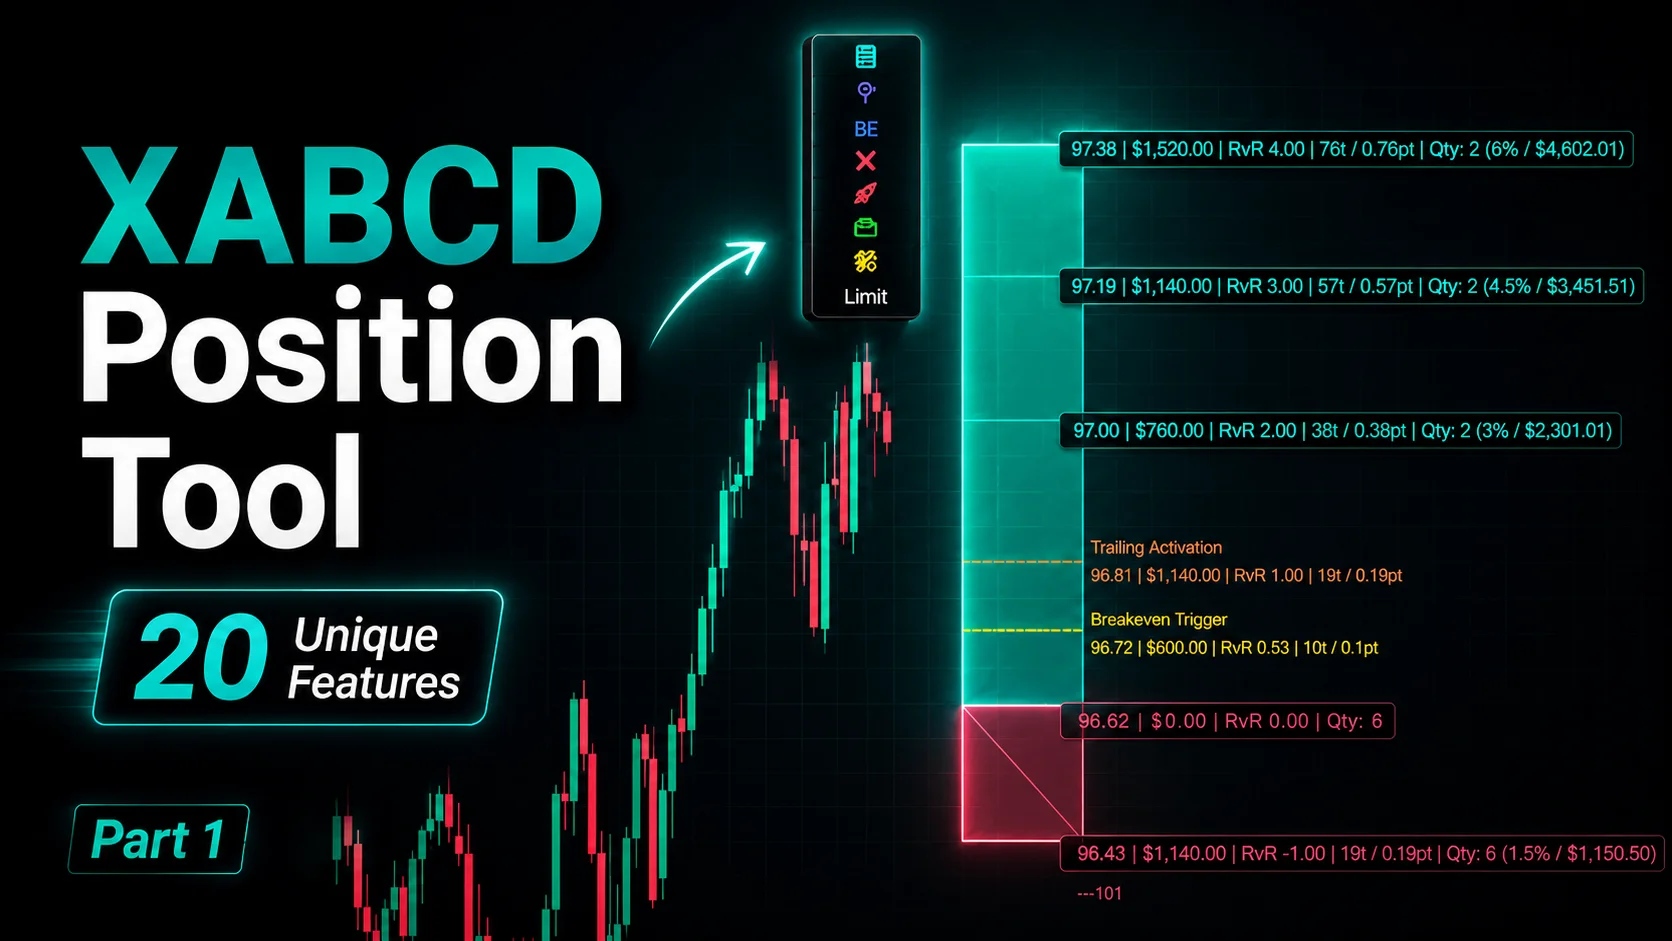
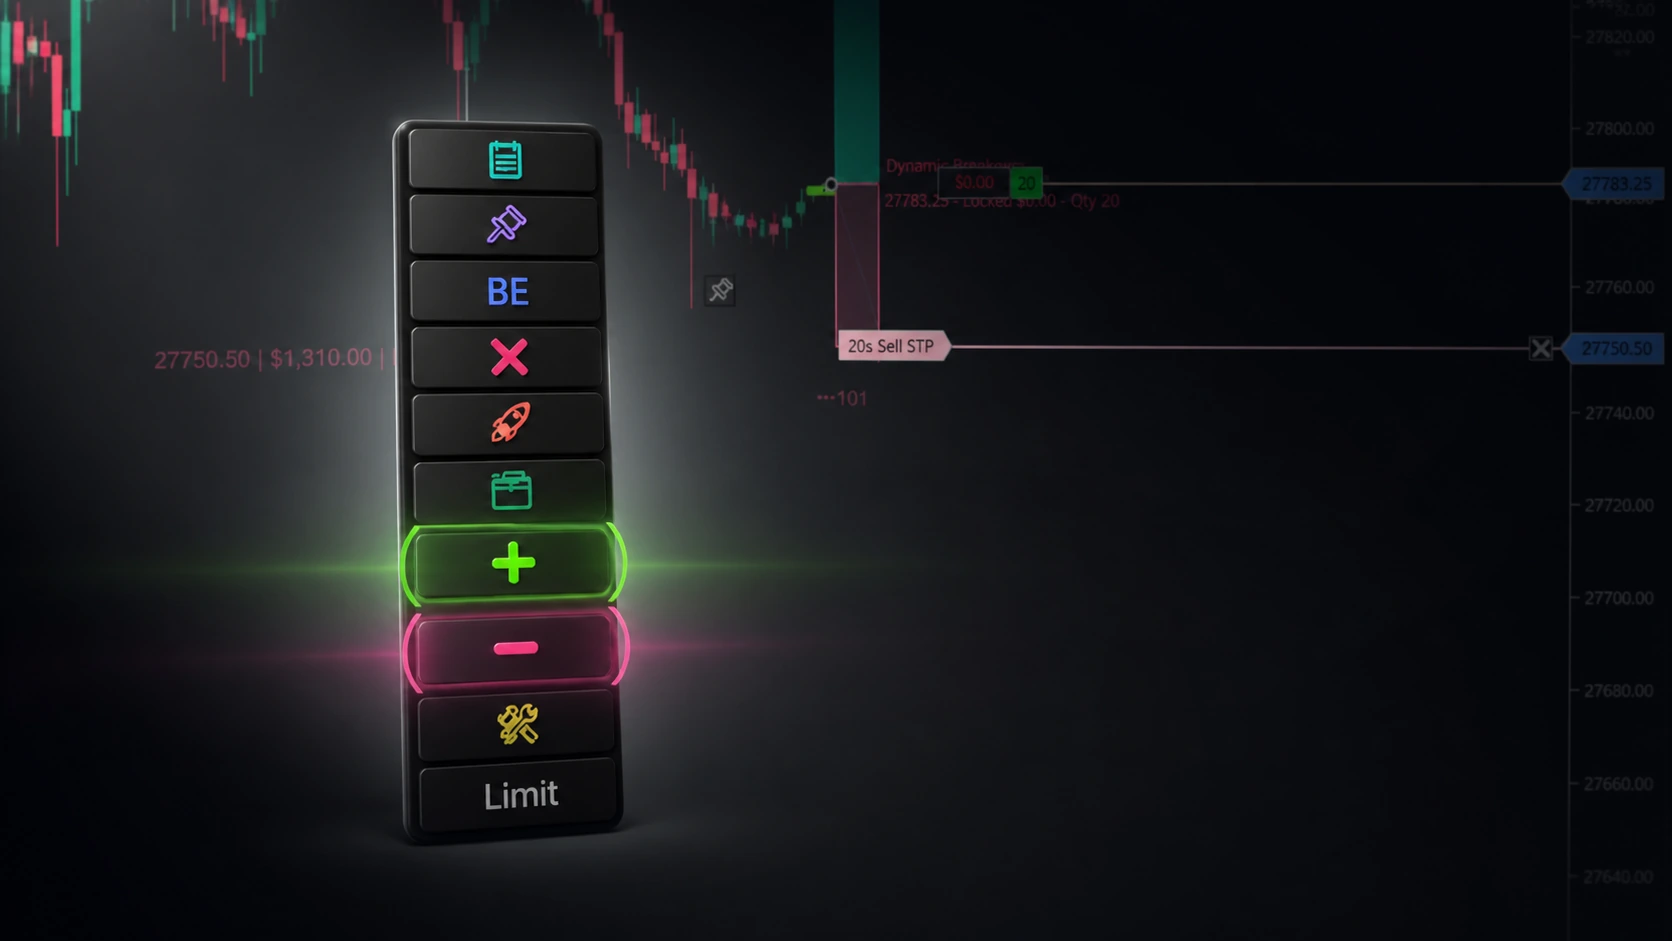
NinjaTrader Position Sizing Tool: 64 Features Stock NT8 Does Not Include
NinjaTrader – Adding to Position: A Field Guide for Active Traders
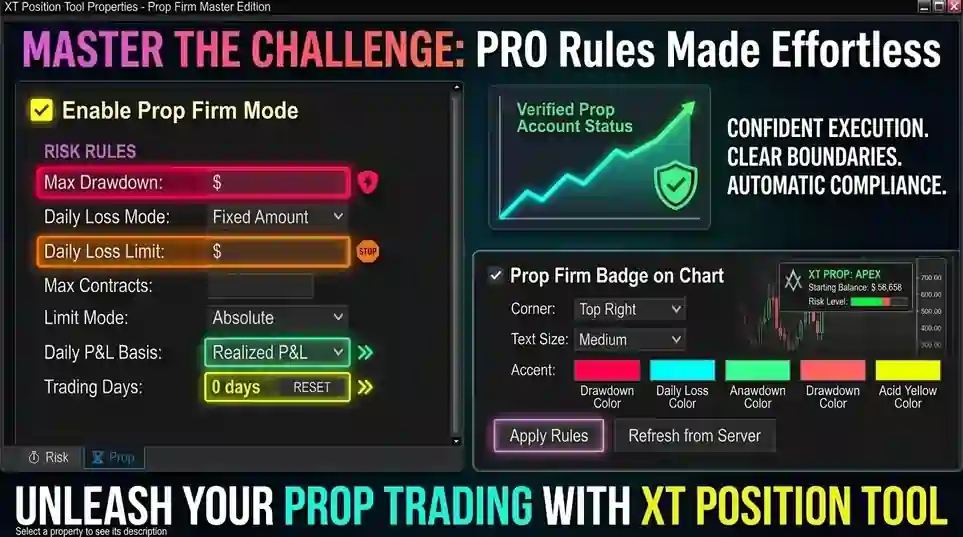
NinjaTrader Prop: The Ultimate Guide to Prop Firm Trading
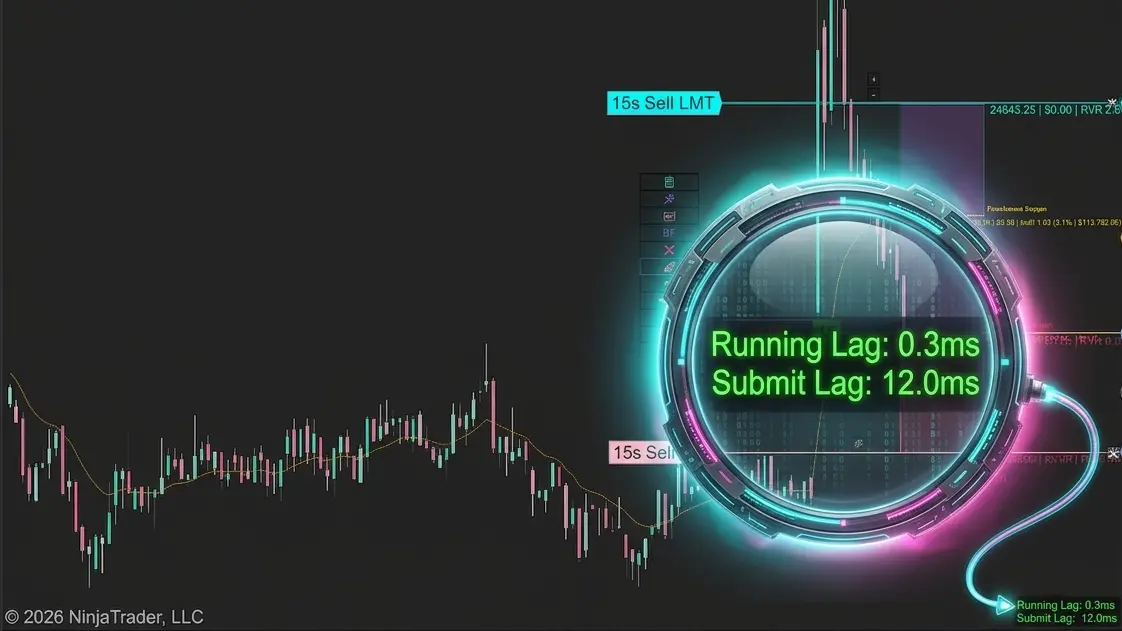
Does the XABCD Position Tool Lag?
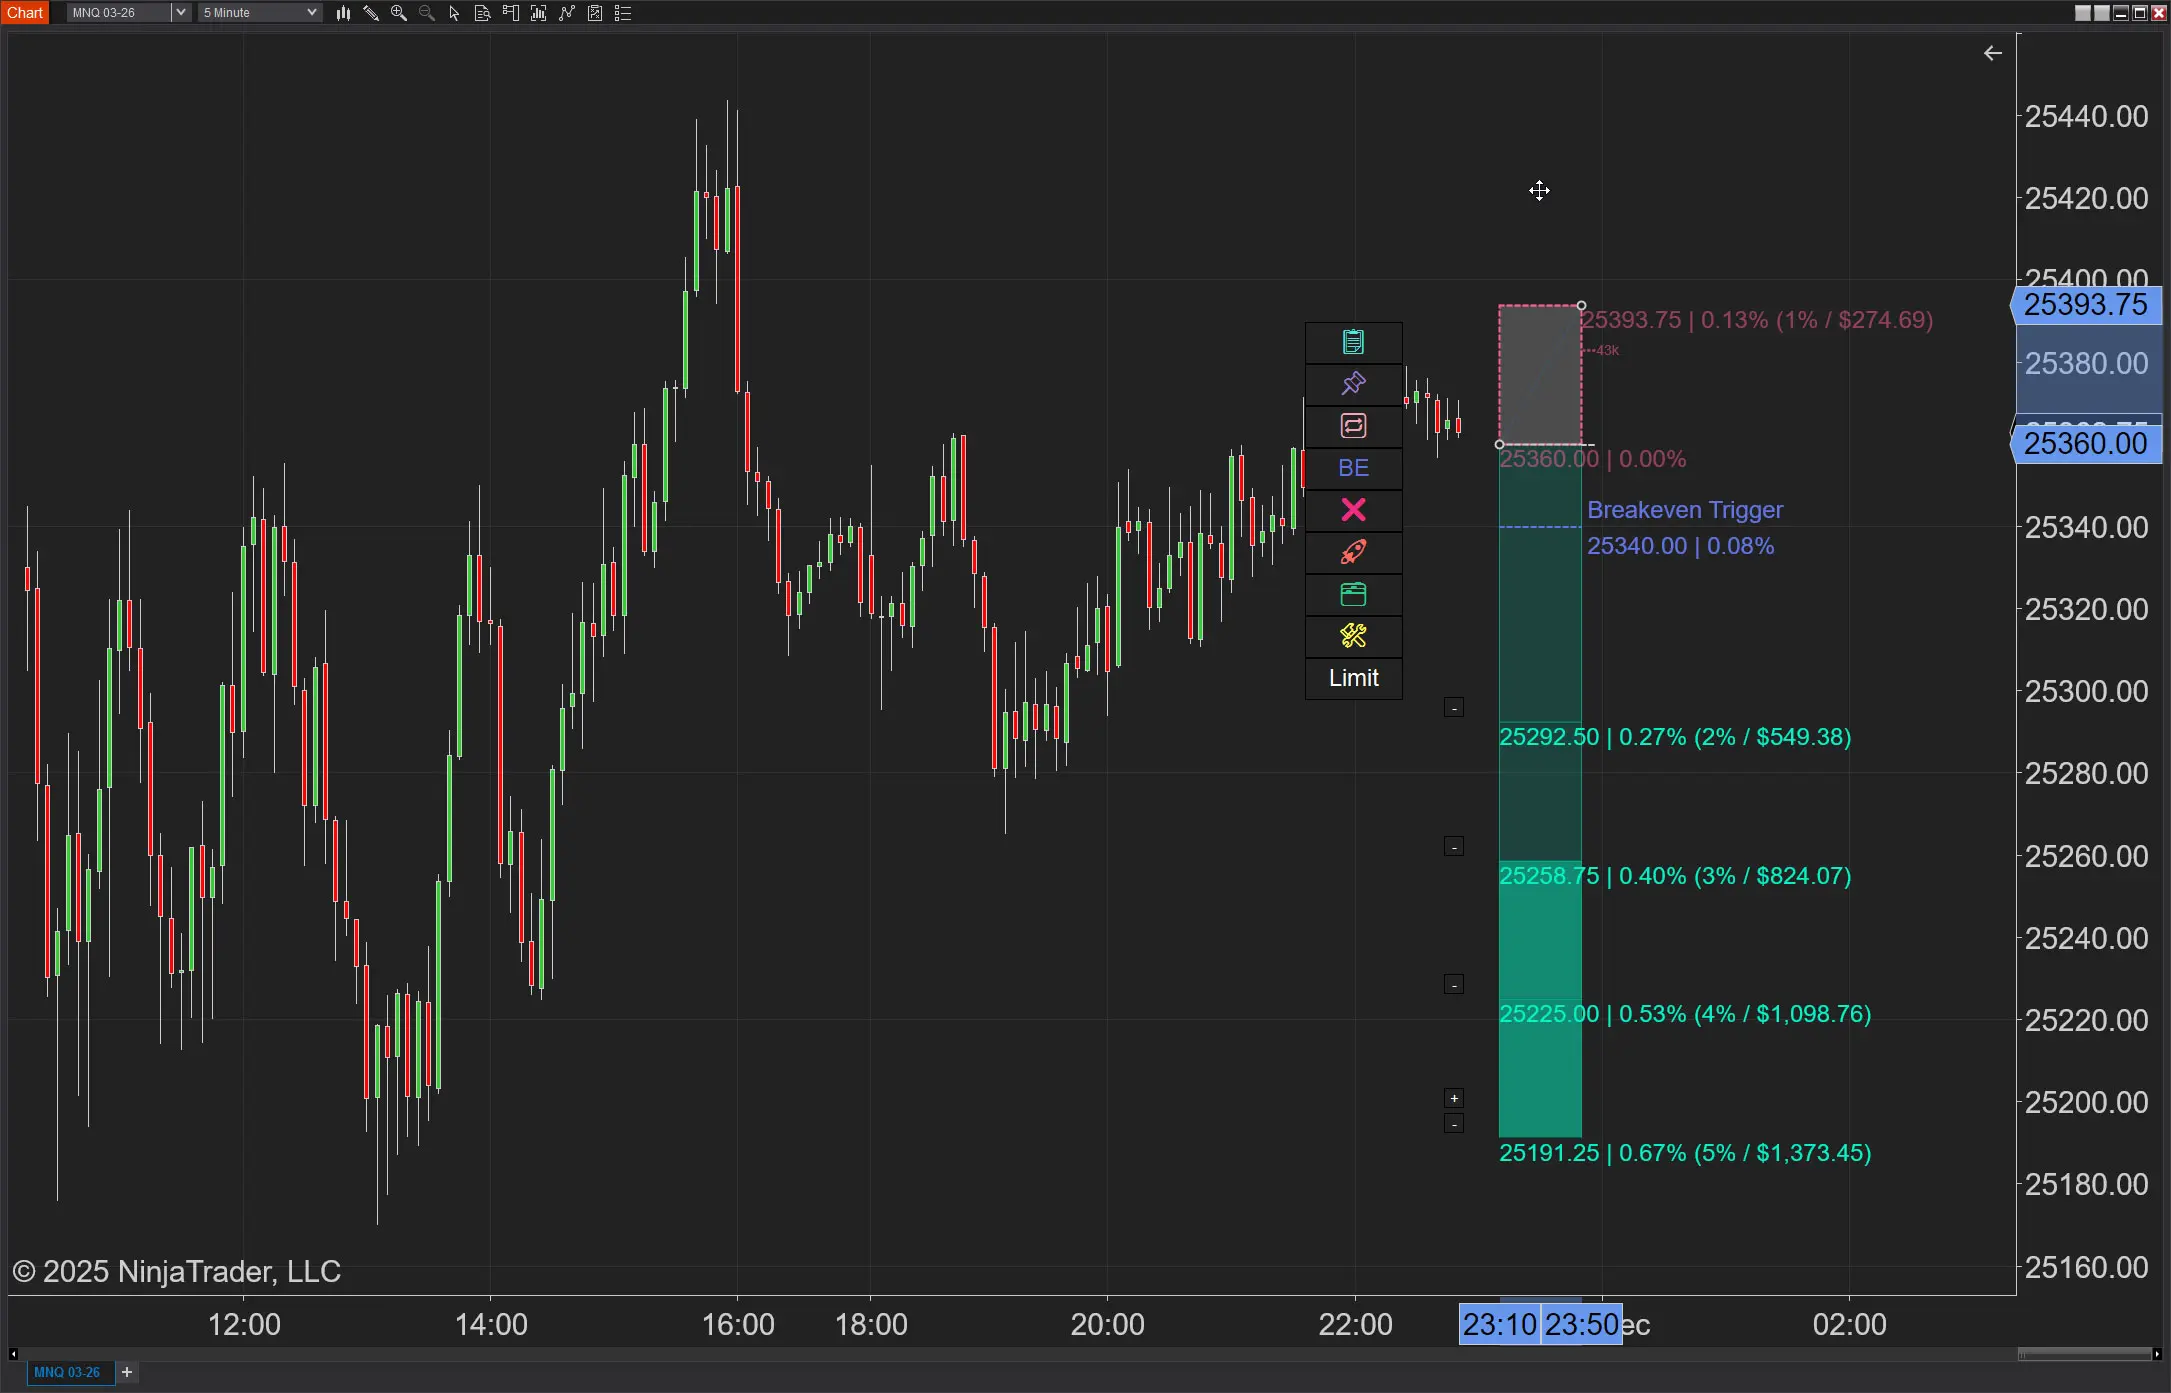
NinjaTrader Position Sizing: What the XABCD Position Tool Can Do That ATM’s Can’t