XABCD TRADING
Candlestick Patterns and Their Biggest Problems
Subscribe
to get alerts to our next blog post!
Biggest Problems with Classic Candlestick Patterns
There are two types of candlestick patterns. The first type is your classic candlestick patterns, the second are our XABCD patterns. When we talk about candlestick patterns that have problems, we're talking about the classic patterns. These are your problem patterns:
- cup with handle
- double bottoms/tops
- saucers
- head and shoulders
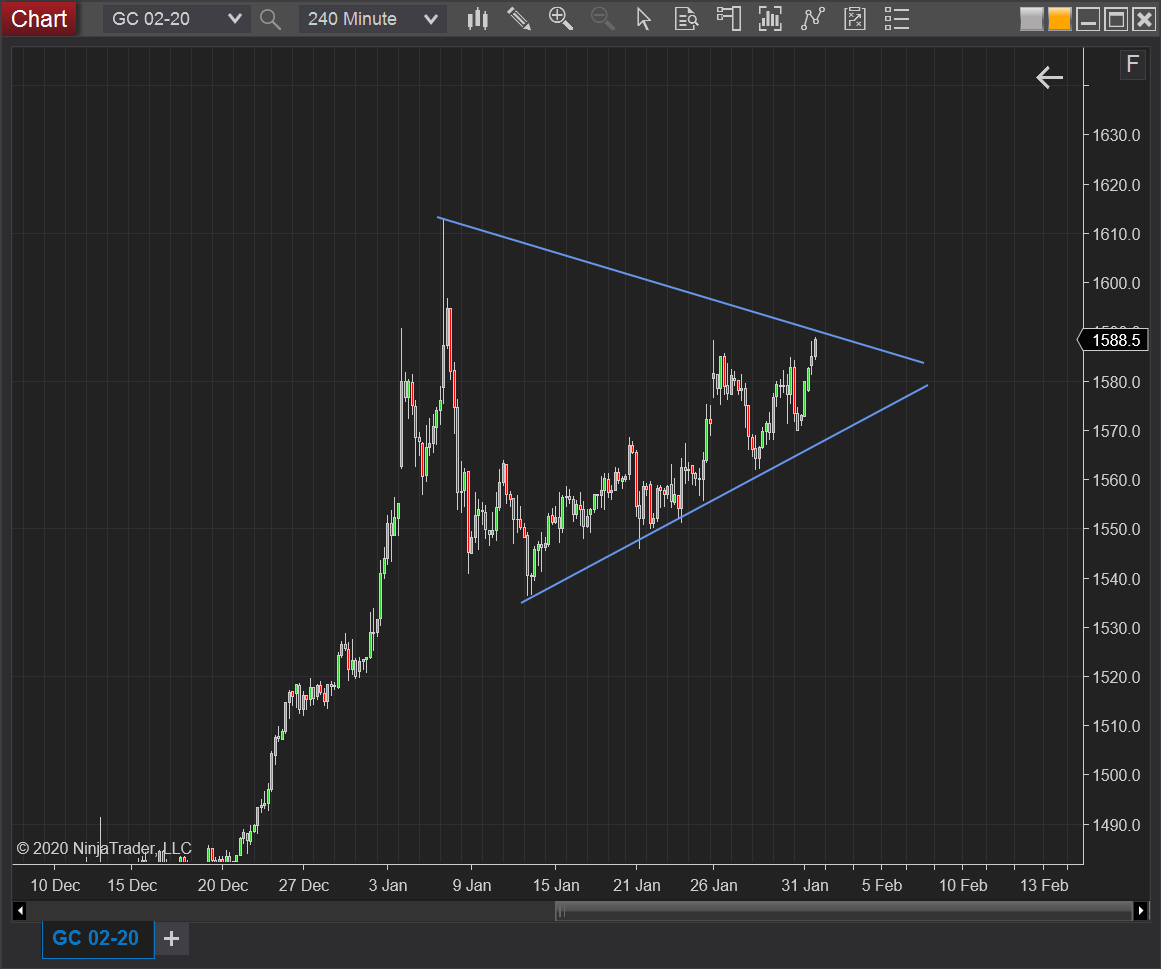
- triangles
- flags
The Problem With Classic Patterns
Very Little Consistency in Shape and Size
When you trade classical chart patterns like the head and shoulders or cup and handle, these patterns have shape but they are not very consistent when most traders find them. That is because there are no measurements that show you which shape is valid vs invalid.
Most charts that do measure patterns do so using price but they fail to use time as a measurement guideline.
The Way XABCD Patterns Fix The Inconsistencies
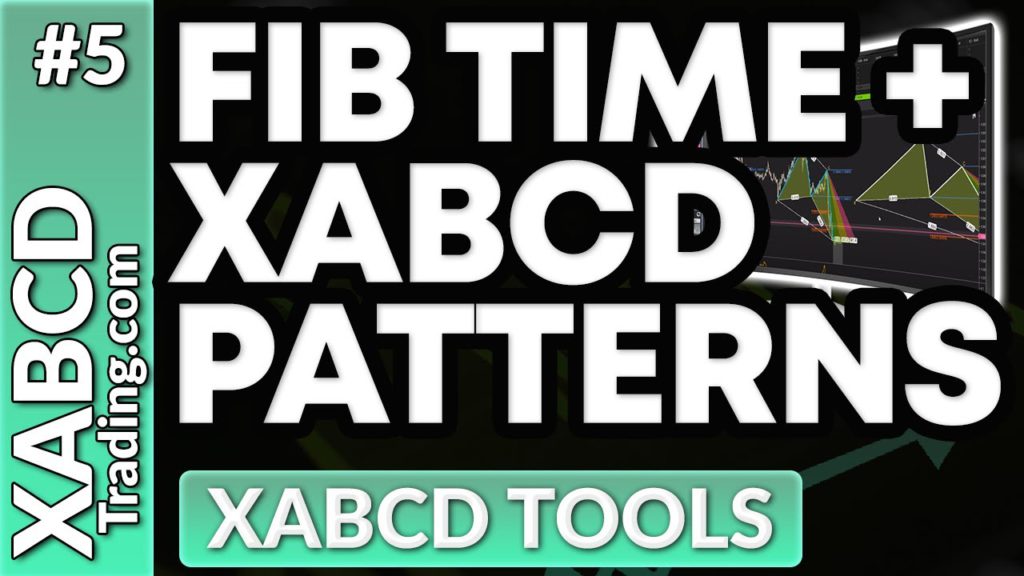
In this video you will see 3 patterns shown, all with the same price ratios - however they do not use "time" measurements.
Most charts that do measure patterns do so using price but they fail to use time as a measurement guideline.
The Classical Chart Problem Demonstrated
 (opens in a new tab)
See More: XABCD Candlestick Patterns
How fast or slow price moves to complete pattern points or the pattern as a whole is critical. Think of an elevator that moves at different speeds and how your emotions would change if your in a controlled decent or free falling. Displaying session break lines on your NinjaTrader 8 charts gives you a simple visual reference for how many days a pattern point took to form.
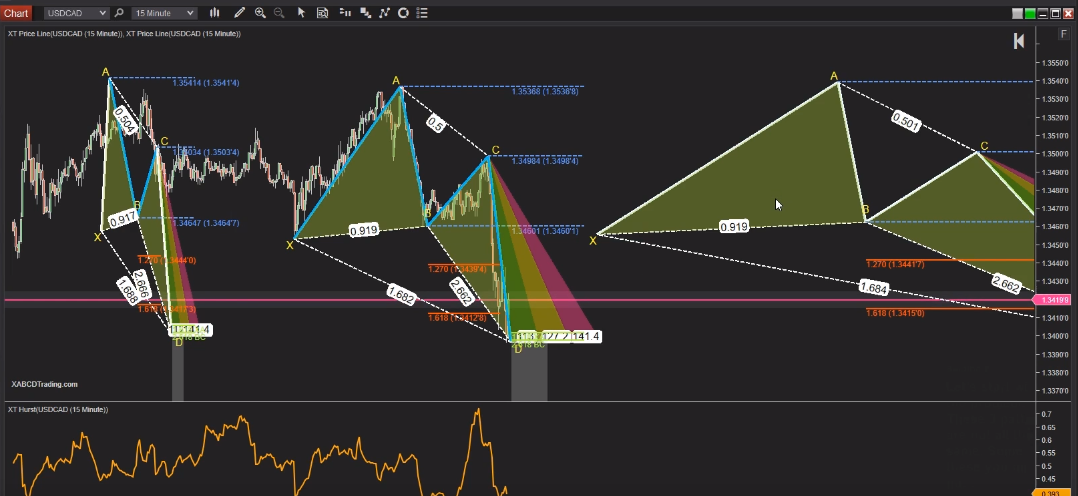
The faster the rise or fall, the stronger the emotions. Being able to measure this and the time it takes will be critical when looking to improve your consistency.
The Blue Edges (Outline) of A "XABCD" Pattern
If you look at the image above you'll notice in our XABCD Patterns the outline of the pattern is made of pure blue outlines or some mix of blue and white outlines. These are the time measurements and you would want the outline of the pattern to be all blue.
When you meet your time ratios and every pattern has all blue outlines you'll benefit from knowing that your patterns are more consistently shaped. This makes it at lot easier to make your adjustments and changes to monitor what sort of effect it has on your trading while keeping your trades as consistent as possible.
The Future of Chart Patterns In The Markets
As awareness of candlestick patterns problems grows, more traders recognize the inconsistencies of classical patterns and look for solutions. XABCD Patterns are positioned to solve this problem by measuring these patterns using both Fibonacci time and price. This has been validated by the breakout growth we've seen in our XABCD Pattern Suite users.
Frequently Asked Questions
What are candlestick patterns and how do they work?
Candlestick patterns chart formations are visual signals on a price chart that traders use to predict future market movements based on past price action. Each candlestick displays the open, high, low, and close price for a given time period, and specific combinations of these candles form patterns that signal potential reversals or continuations in trend.
What is the most reliable candlestick pattern?
The engulfing pattern and the morning/evening star are widely regarded as some of the most reliable candlestick patterns, especially when confirmed by high trading volume and other technical indicators. No single pattern guarantees a result, but these formations tend to have higher accuracy rates when they appear at key support or resistance levels.
How many candlestick patterns are there?
There are over 50 recognized candlestick patterns, ranging from single-candle formations like the doji and hammer to multi-candle patterns like the three white soldiers and three black crows. Most traders focus on mastering 10 to 15 of the most common and reliable patterns rather than memorizing all of them. Some of these formations are candlestick patterns bearish traders watch for, such as the three black crows, which signal potential downward moves.
Can beginners use candlestick patterns for trading?
Yes, candlestick patterns are one of the most beginner-friendly forms of technical analysis because they provide clear visual signals that are relatively easy to identify on a chart. Beginners should start by learning basic patterns like the hammer, doji, and engulfing pattern, and always combine them with other indicators and proper risk management before placing trades. Trading with candlestick patterns becomes more effective as you gain experience reading price action alongside other tools.
What is the difference between bullish and bearish candlestick patterns?
Candlestick patterns bullish in nature signal that buying pressure is increasing and the price is likely to move upward, with examples including the hammer, bullish engulfing, and morning star. Bearish candlestick patterns indicate growing selling pressure and a potential price decline, with common examples being the shooting star, bearish engulfing, and evening star.
Frequently Asked Questions
What are candlestick patterns and how do they work?
Candlestick patterns chart formations are visual signals on a price chart that traders use to predict future market movements based on past price action. Each candlestick displays the open, high, low, and close price for a given time period, and specific combinations of these candles form patterns that signal potential reversals or continuations in trend.
What is the most reliable candlestick pattern?
The engulfing pattern and the morning/evening star are widely regarded as some of the most reliable candlestick patterns, especially when confirmed by high trading volume and other technical indicators. No single pattern guarantees a result, but these formations tend to have higher accuracy rates when they appear at key support or resistance levels.
How many candlestick patterns are there?
There are over 50 recognized candlestick patterns, ranging from single-candle formations like the doji and hammer to multi-candle patterns like the three white soldiers and three black crows. Most traders focus on mastering 10 to 15 of the most common and reliable patterns rather than memorizing all of them. Some of these formations are candlestick patterns bearish traders watch for, such as the three black crows, which signal potential downward moves.
Can beginners use candlestick patterns for trading?
Yes, candlestick patterns are one of the most beginner-friendly forms of technical analysis because they provide clear visual signals that are relatively easy to identify on a chart. Beginners should start by learning basic patterns like the hammer, doji, and engulfing pattern, and always combine them with other indicators and proper risk management before placing trades. Trading with candlestick patterns becomes more effective as you gain experience reading price action alongside other tools.
What is the difference between bullish and bearish candlestick patterns?
Candlestick patterns bullish in nature signal that buying pressure is increasing and the price is likely to move upward, with examples including the hammer, bullish engulfing, and morning star. Bearish candlestick patterns indicate growing selling pressure and a potential price decline, with common examples being the shooting star, bearish engulfing, and evening star.
Still have a question about this?Ask the XABCD team in Live Chat and get help with your setup.Ask in Live Chat →
Be the First to Read New Articles
Free tutorials, fixes and setup guides by email.
Free tutorials, fixes and setup guides by email.
Recommended Tool
XABCD ATM Pack
23 free ATM strategy templates for NinjaTrader 8. Import them and start with your stops and targets already set up.
Get the Free ATM Pack →
Recommended Video
Ditch NinjaTrader ATMs: This Is More Powerful
See how to set your risk and calculate contracts directly on the chart.
Watch Now
Subscribe on YouTube
Related Tool
XABCD ATM Pack
23 free ATM strategy templates for NinjaTrader 8. Import them and start with your stops and targets already set up.
Get the Free ATM Pack
Why XABCD Trading
- Built for NinjaTrader 8 since 2009
- Trusted by 2,000+ traders
- On-chart tools, no ATM templates needed
- Free tools to get started
Get Project Updates
Twice-monthly maximum, we will give you updates on all the projects going here.
Quick Links