XABCD TRADING
3 Useful Ways of Linking Charts in NinjaTrader 8 (2025)
Subscribe
to get alerts to our next blog post!
What is "Linking" in NinjaTrader 8?
Linking charts is a way of connecting different windows within NinjaTrader 8 to other windows also in NinjaTrader. This allows you to click on one chart and have all the other charts change saving you tons of time with your charting. For those who are using our XABCD Pattern Suite for NinjaTrader 8, you will be able to quickly see all the patterns on every time frame with one click.
Possible Use Cases for Linking Charts
- When you change one chart, you want all the other charts to change at the same time. Eg. You have 7 charts all on different time frames. Instead of setting each chart one by one, we can link them all and change the symbol on only 1 chart instead of having to do all 7 one by one.
- You can also link intervals and you could change one chart's interval and have them all change. This is useful if you have a lot of all being the same and as you change one chart, all the others change.
- Using a combination of both interval and instrument linking. It's great when you're grouping charts across multi-monitor setups.
- Use it with your market analyzer so that when your scanner picks up a certain condition in the market, and you select that instrument in the market analyzer all your linking charts connect and pull up that instrument
Linking Charts Using The Squares
In the top of every window you will see 1 or 2 squares that look like this (focus on the red and orange square) for linking charts.
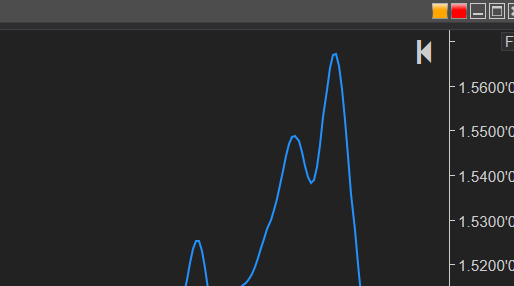
What do the red squares mean?
Right (Red) is for instrument linking Left (Orange) is for interval linking
Right (Red) is for instrument linking Left (Orange) is for interval linking
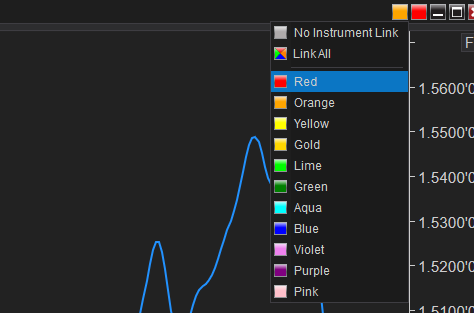
Color Coding Your Links
You can customize the colors when linking charts so that each link is grouped together as a set of charts. This way only certain charts on your screen will change.
You could have the 4 majors of FX up, USDJPY, GBPUSD, EURUSD, USDCHF and color code 3 charts of each one USDJPY 5min, USDJPY 15min and USDJPY 30min so that if you change the symbol to an AUDUSD only the USDJPY pairs will change.
We go over some examples of linking charts in the video at the top of the page or on our youtube channel.
Now its Time to Get Creative!
There is no right or wrong way with how you would want to link charts - it really depends how many charts you want up on your screen and how frequently you will be changing your charts. Some people like to have a fix number of windows up there and every symbol they want to view, they type it in and their workspace gets changed to that symbol. Have fun with it, and get creative.
New NinjaTrader Articles Delivered First

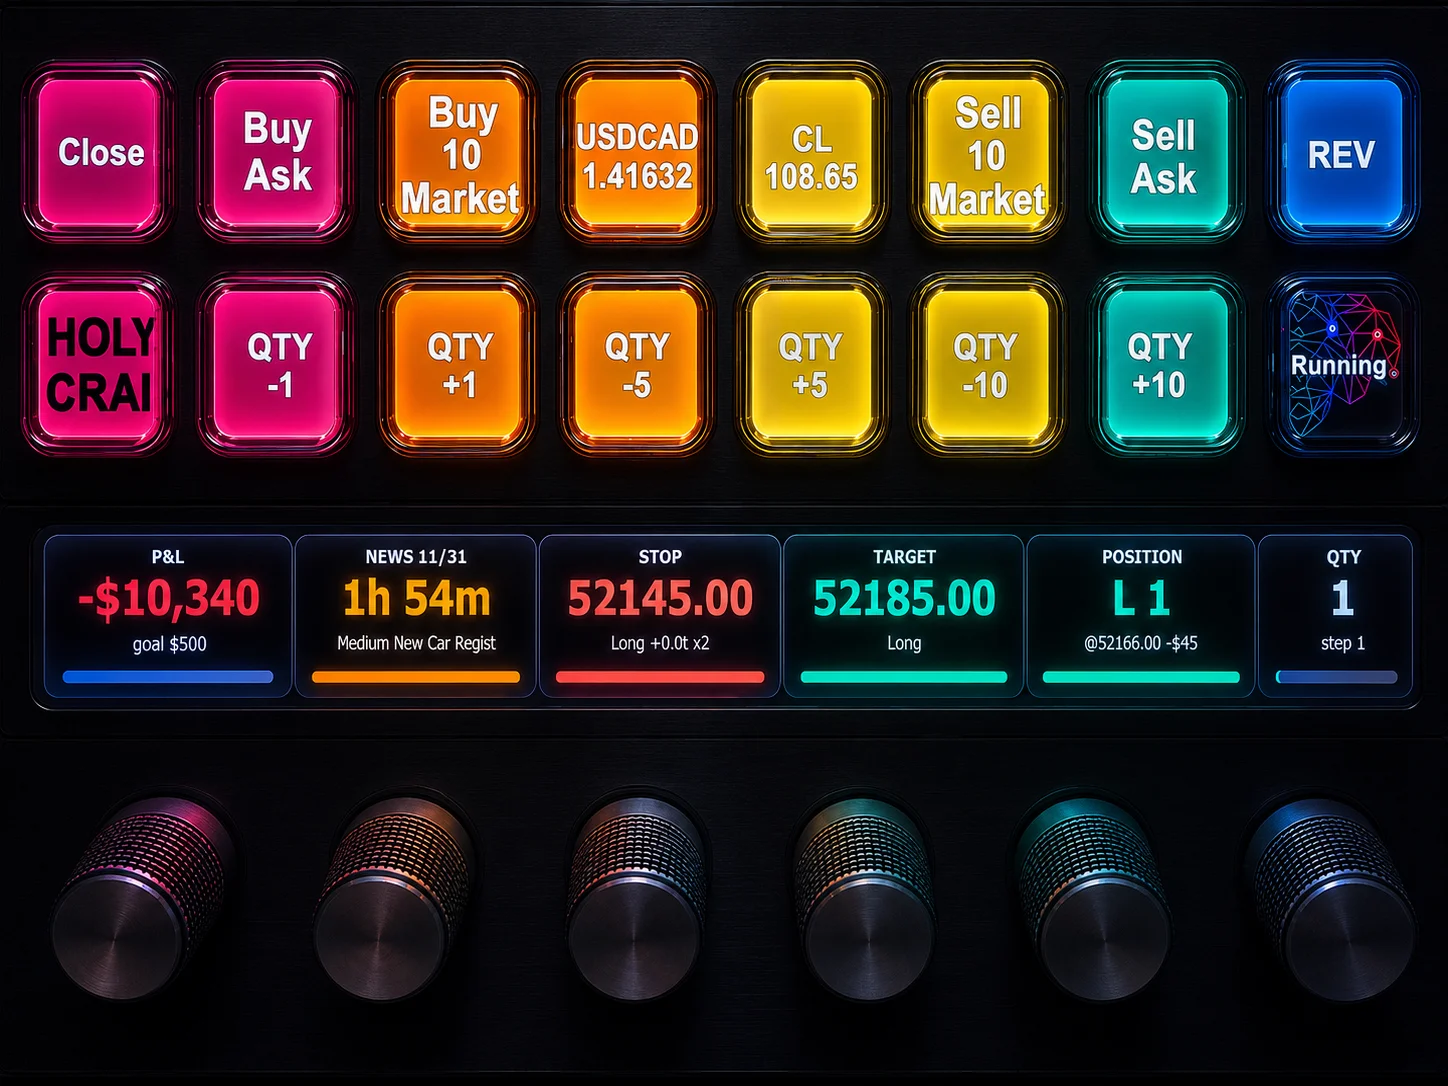
Easy Order Tool
The Strategy


Scanning & Alerting

NinjaTrader Release
XABCD News (Free Version)
XABCD News (Community Edition) is the best free Indicator for NinjaTrader 8. Don't let news sneak up on you again. Puts economic news events on your charts so you can stay informed and move around positions/stops before the news is released. Works in any market.
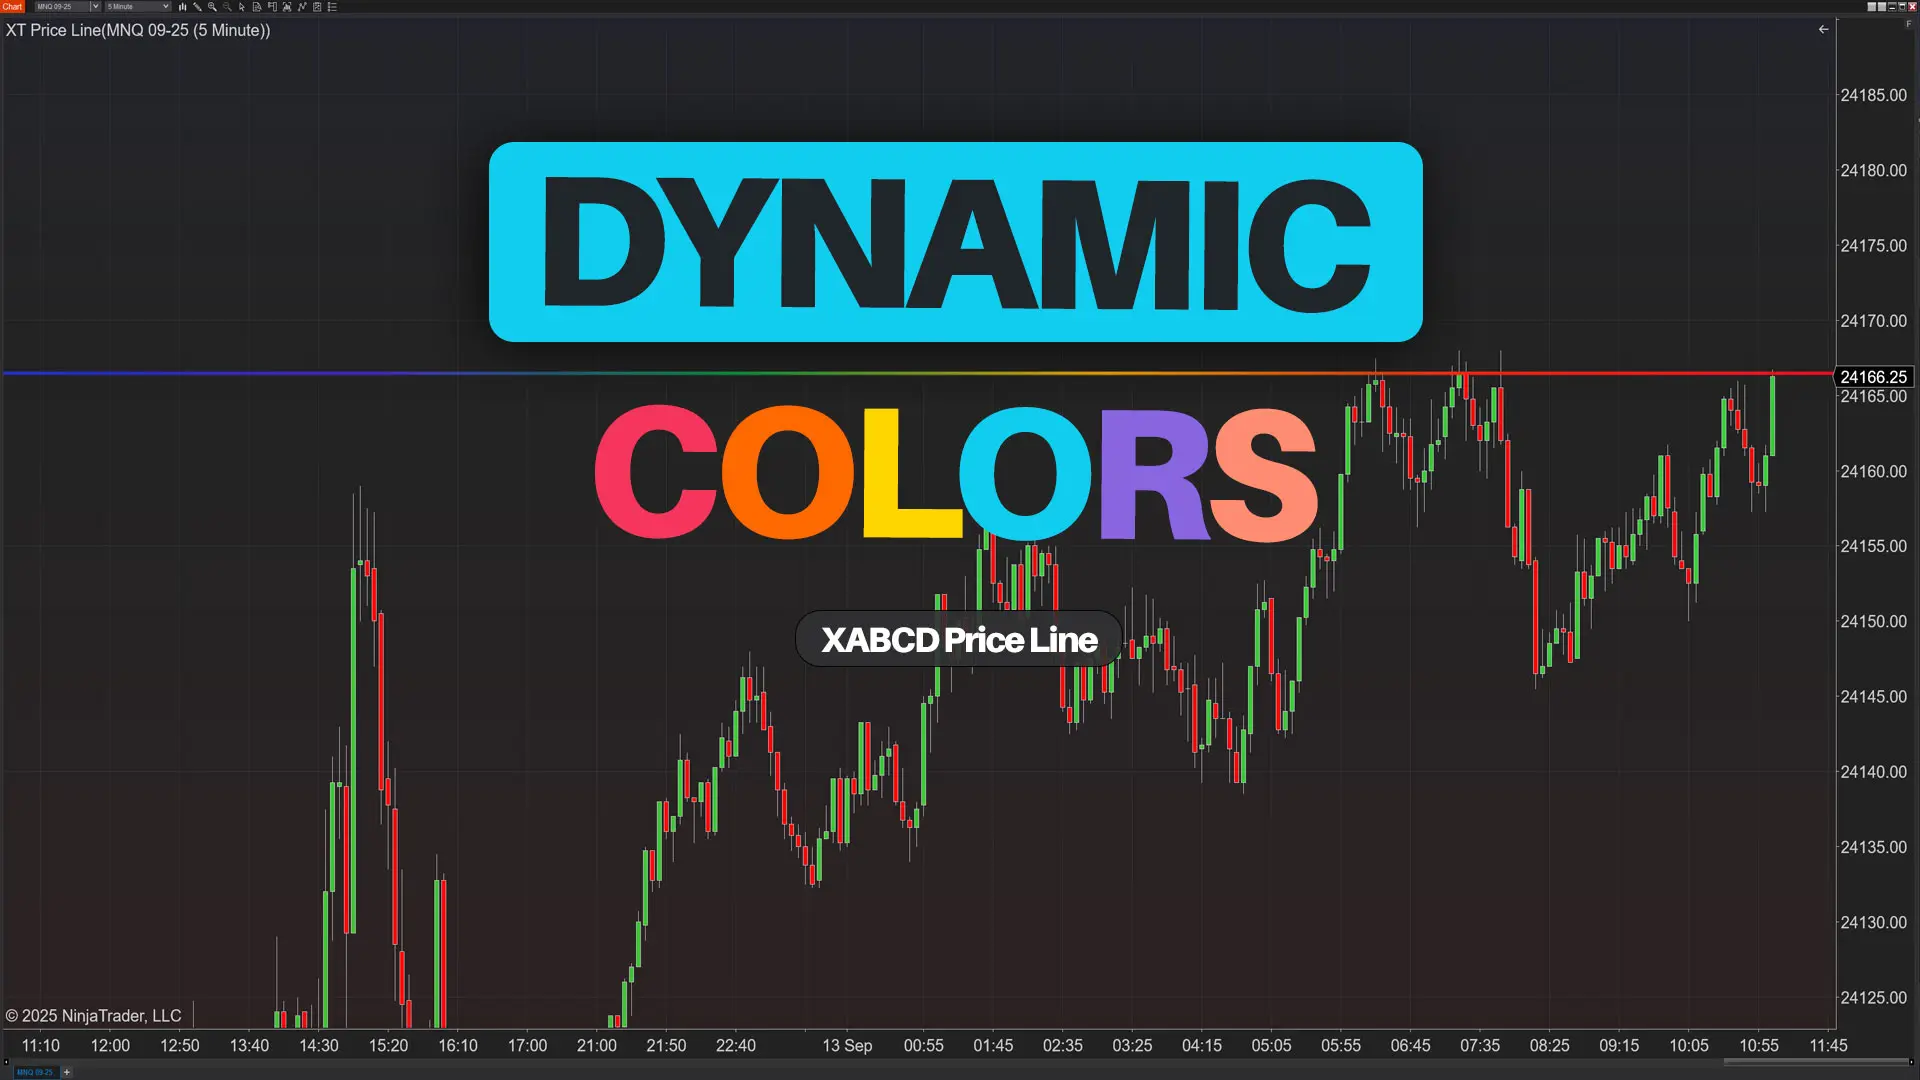
XABCD Priceline (Free)
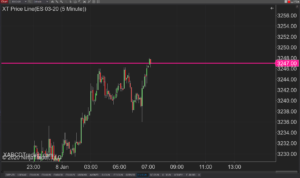
XABCD Price Line tool for NinjaTrader 8 will draw a line at current price and move every time the market changes price. This is useful because it will allow you to easily identify where price is at all times and the exact quoted price.
NinjaTrader 8 Hotkeys: Best Shortcuts for Faster Trading
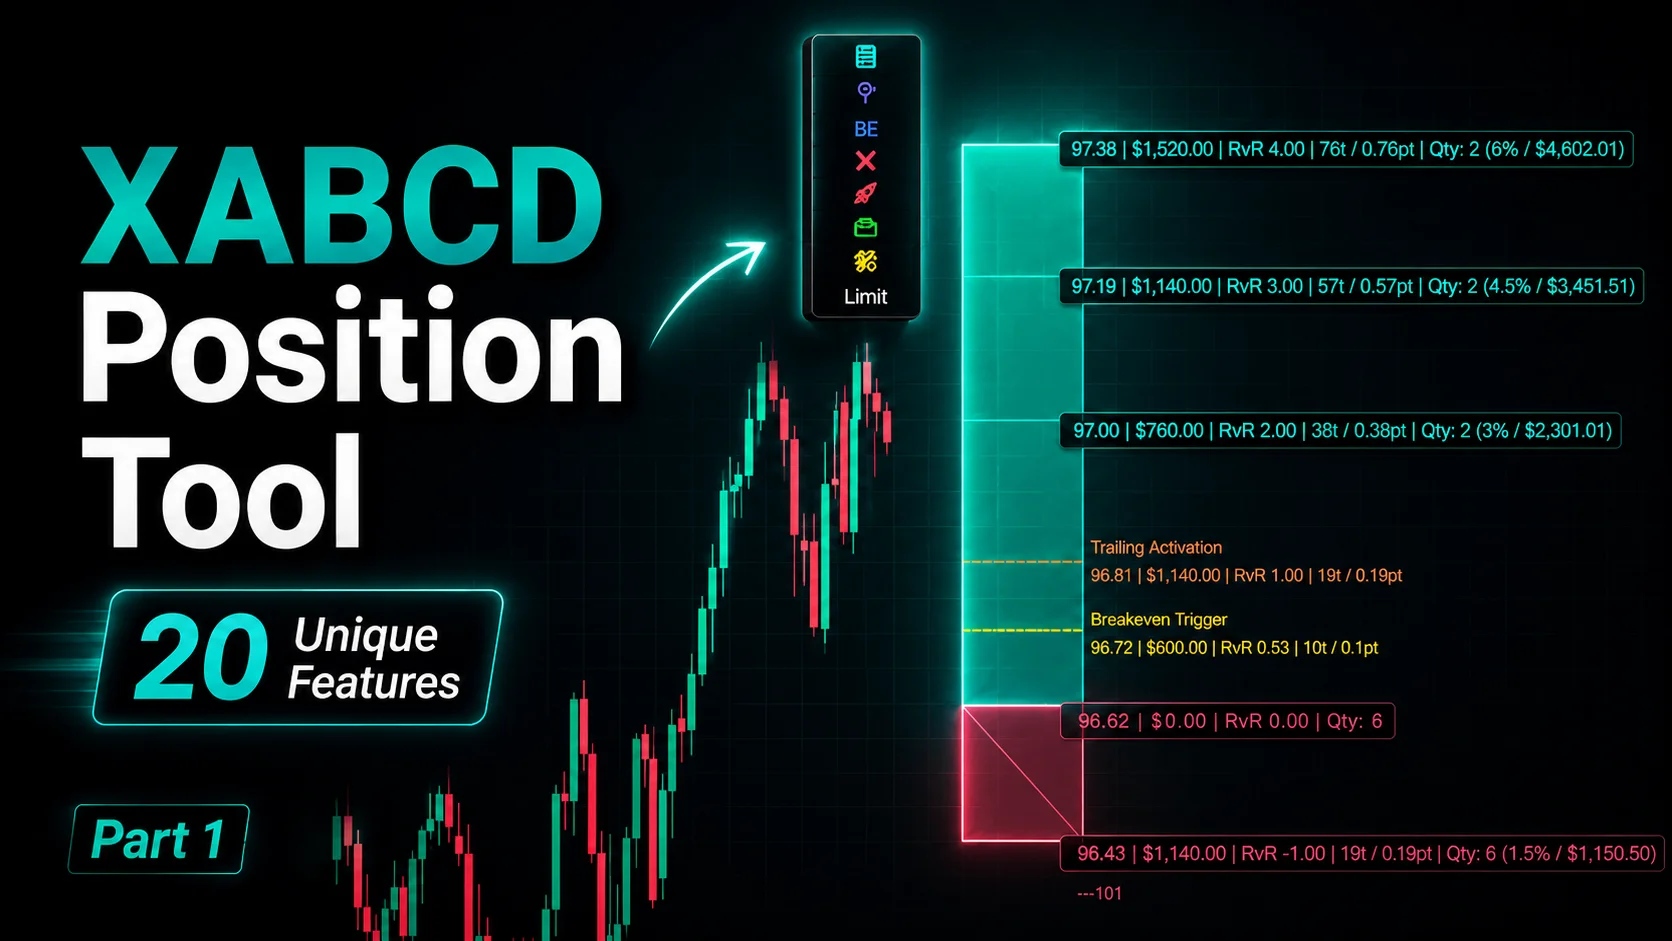
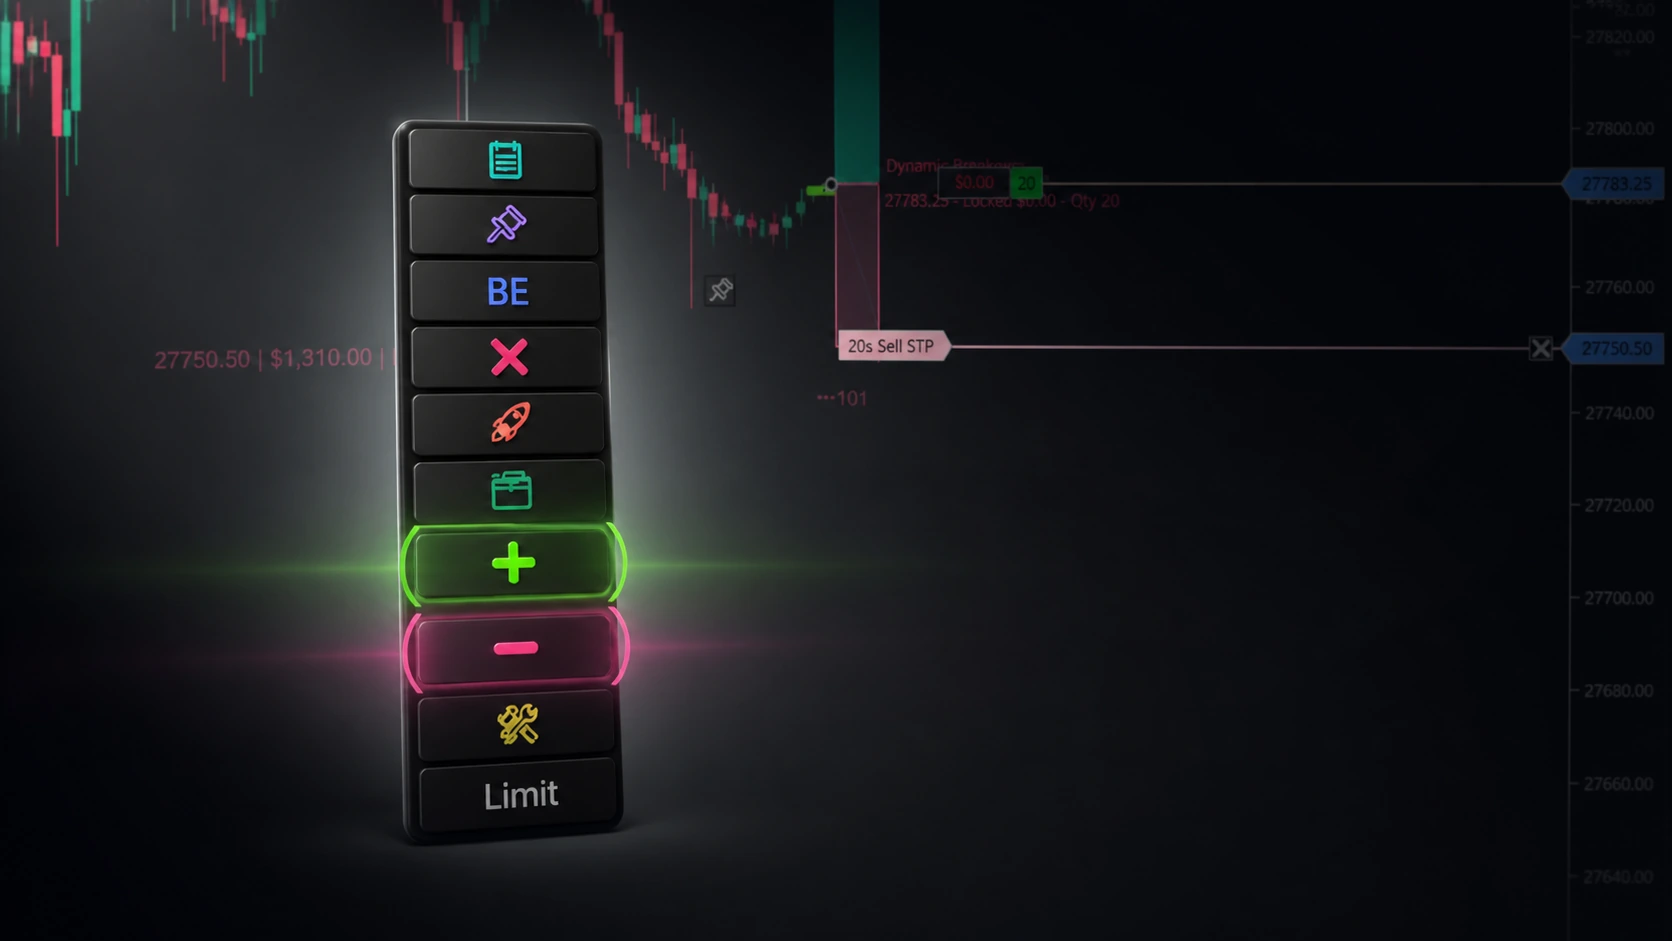
NinjaTrader Position Sizing Tool: 64 Features Stock NT8 Does Not Include
NinjaTrader – Adding to Position: A Field Guide for Active Traders
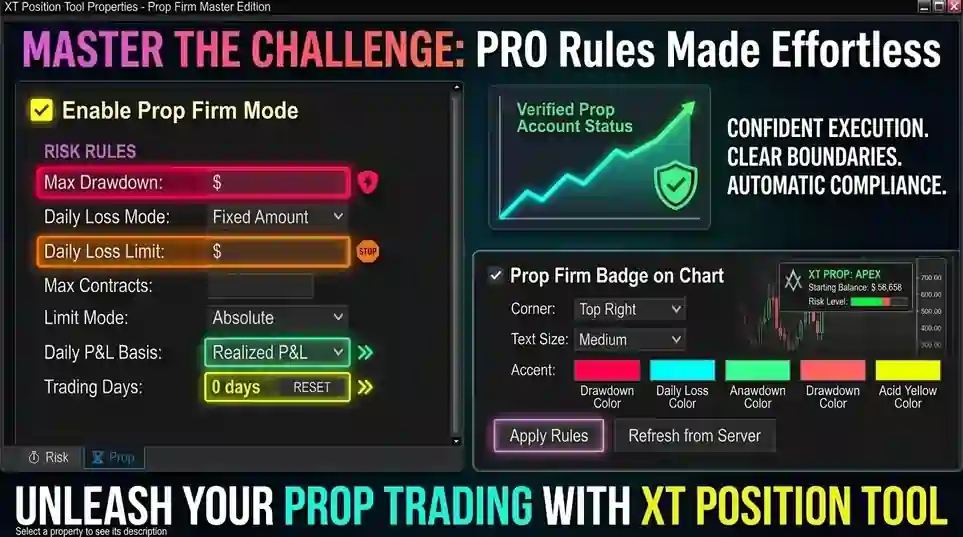
NinjaTrader Prop: The Ultimate Guide to Prop Firm Trading
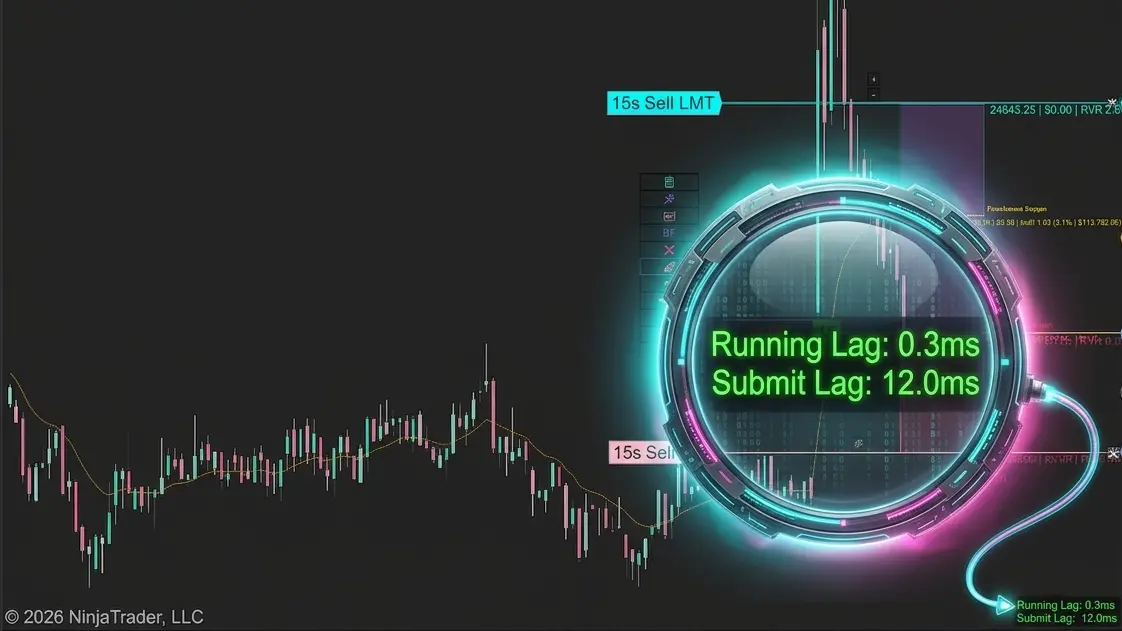
Does the XABCD Position Tool Lag?
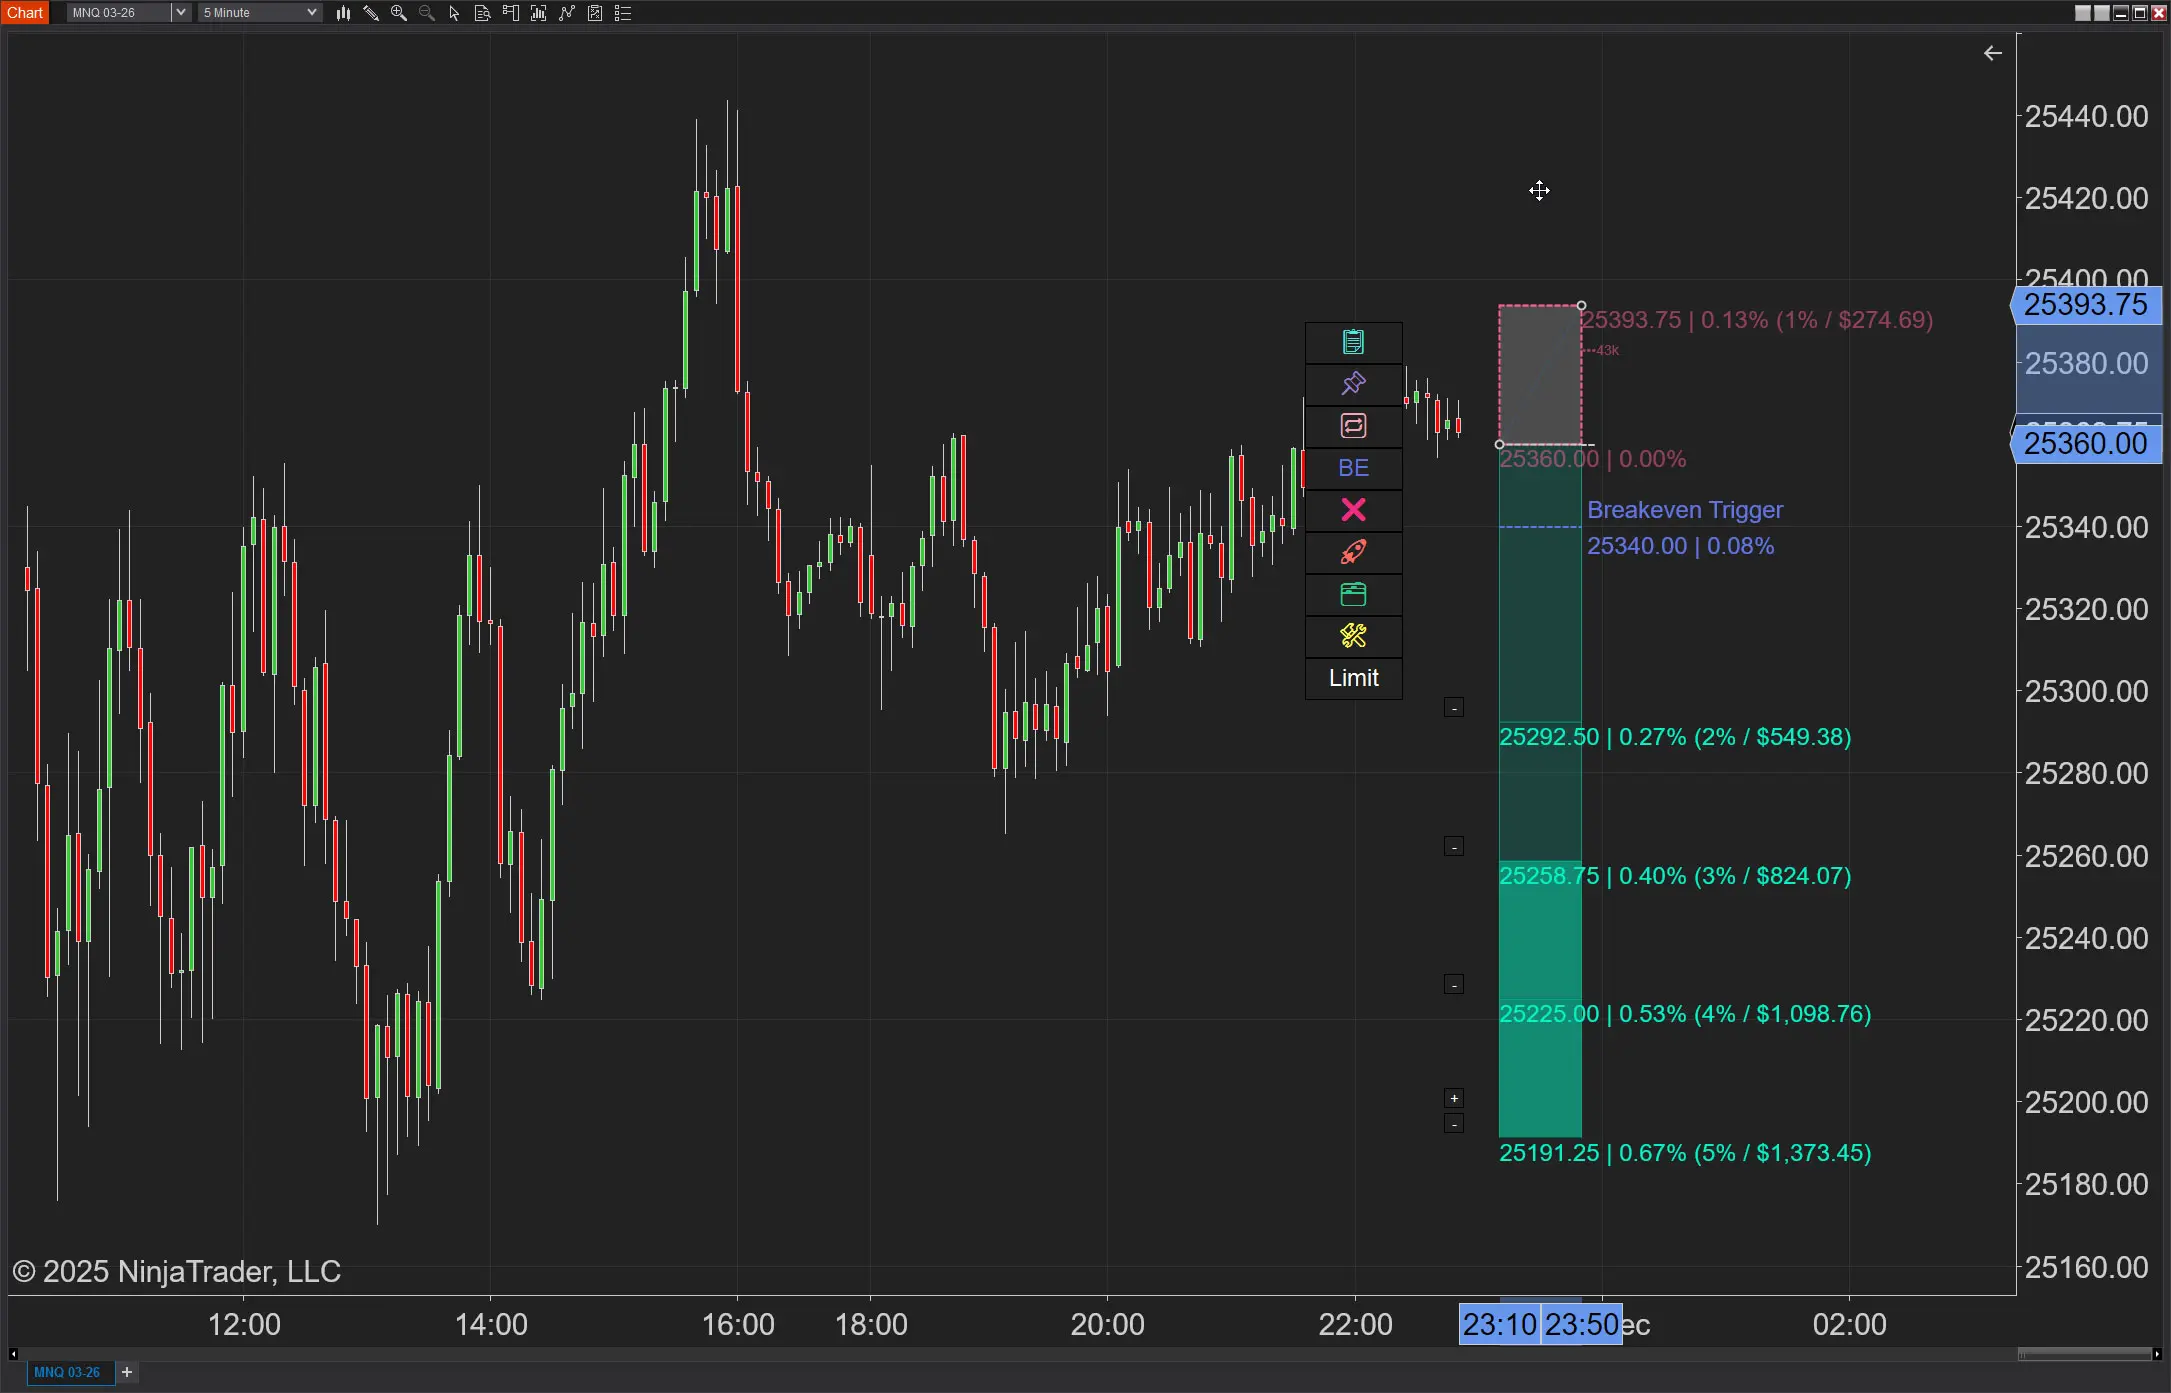
NinjaTrader Position Sizing: What the XABCD Position Tool Can Do That ATM’s Can’t
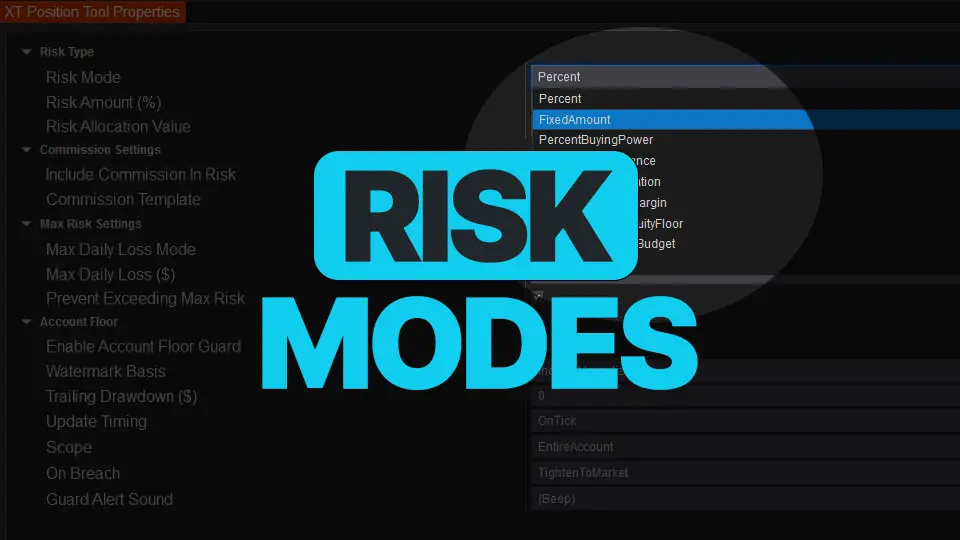
NinjaTrader Risk Management That Actually Moves the Needle
NinjaTrader 8.1.6 — The “No Fluff” Tour (Speed, Clarity, Fewer Clicks)
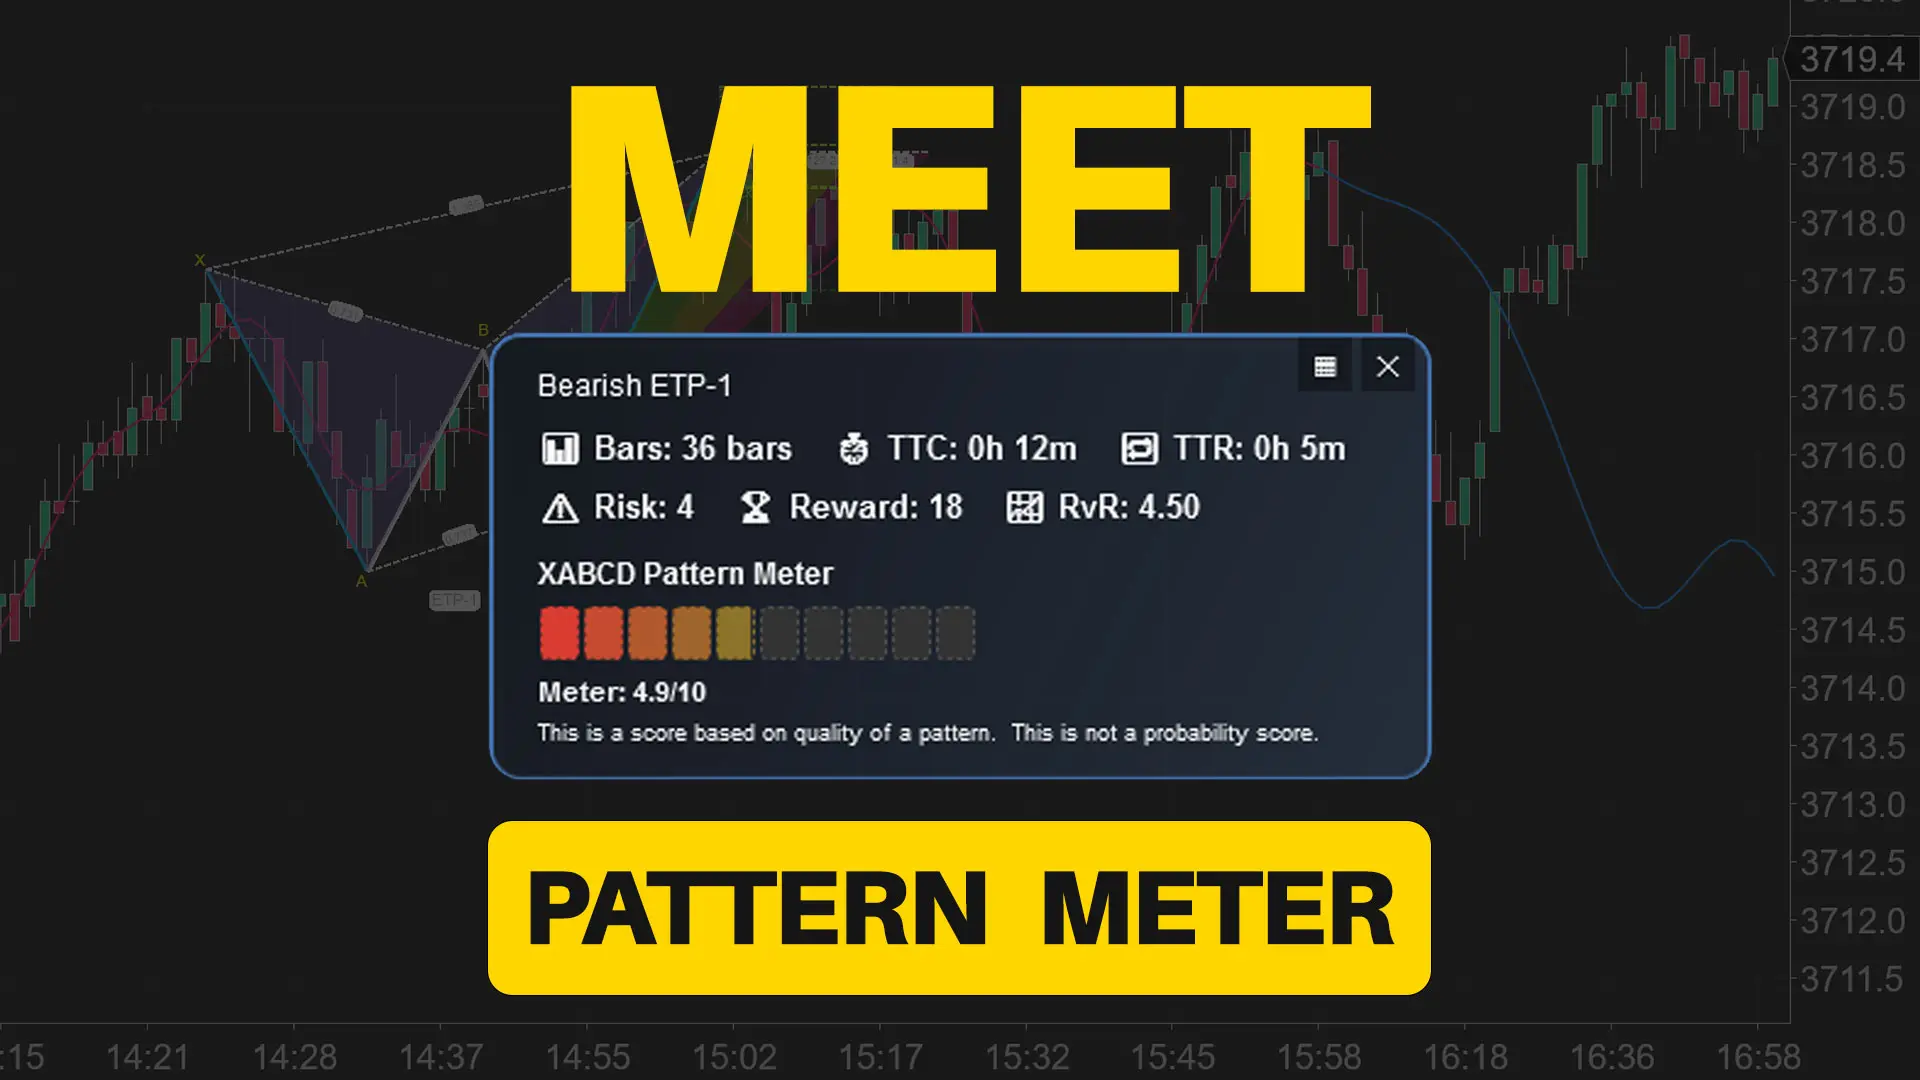
Meet the XABCD Pattern Meter (Real-Time Clarity)