XABCD TRADING
Support and Resistance in NinjaTrader
Subscribe
to get alerts to our next blog post!
How to Correctly Draw Support and Resistance
Indicators or No Indicators?
The problem with support and resistance indicators can be demonstrated by starting out with a blank chart.
- Draw on the support/resistance levels you've identified with your eyes
- Once your done, load up the support and resistance indicator and see if it draws all the lines in the same spot as you.
Indicator Pro's
Indicators Con's
How Should I Draw Support and Resistance?
It doesn't take much at all, you just need to have it explained so you know what to do.
- The first step is to load up a chart and look for levels that reverse in the same area as current price or where you're forecasting price to go.
- Look back at the reversals that line up all close to the same price, the better as it will be more obvious.
- Draw a "Zone" to map in support or resistance. Start from the furthest point out, and highlight to where most of the candlesticks touch.
Video Demonstration
In this video we'll demonstrate how this is done. As you watch the examples, pay attention how this is not a specific line but a zone. Most importantly the zone is going to start from the furthest point out and come in where most of the candlesticks touch that are part of the reversal.
If you're part of our XABCD membership you've probably heard and seen the indicators we developed for support and resistance. We've tried doing it so many ways but time and time again because we thought there might be a way. However, we always went back to drawing it on manually.
More Examples of Support and Resistance Drawings
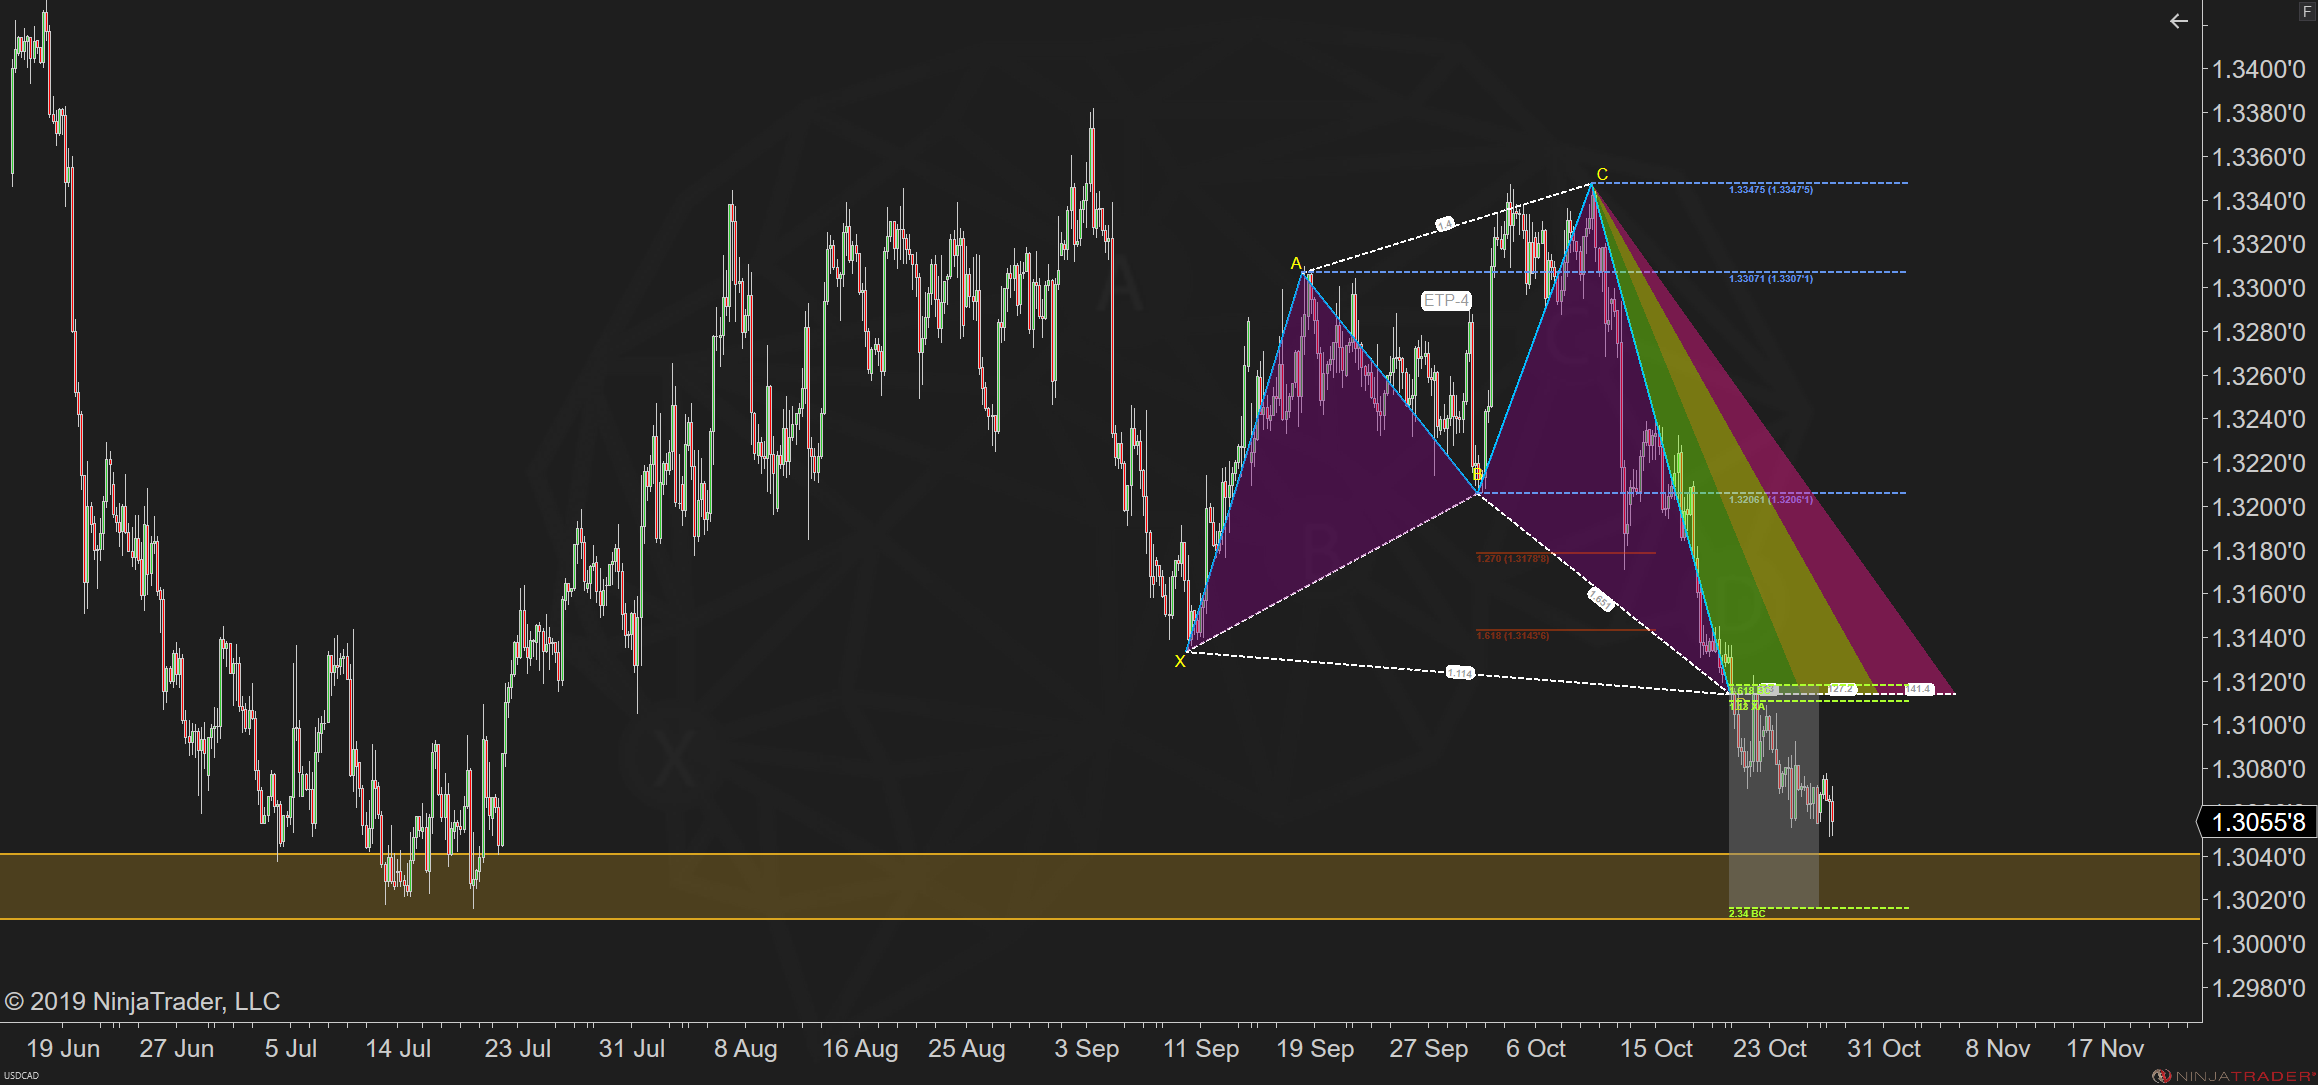
Here we will setup our charts with the levels to give you even greater confidence. You can always start your week the same way by drawing area's of s/r on your own charts.
In the image below you can see that S/R zones can also be drawn on channels and not just ranges. So, again you should be drawing these area's in as a zone.
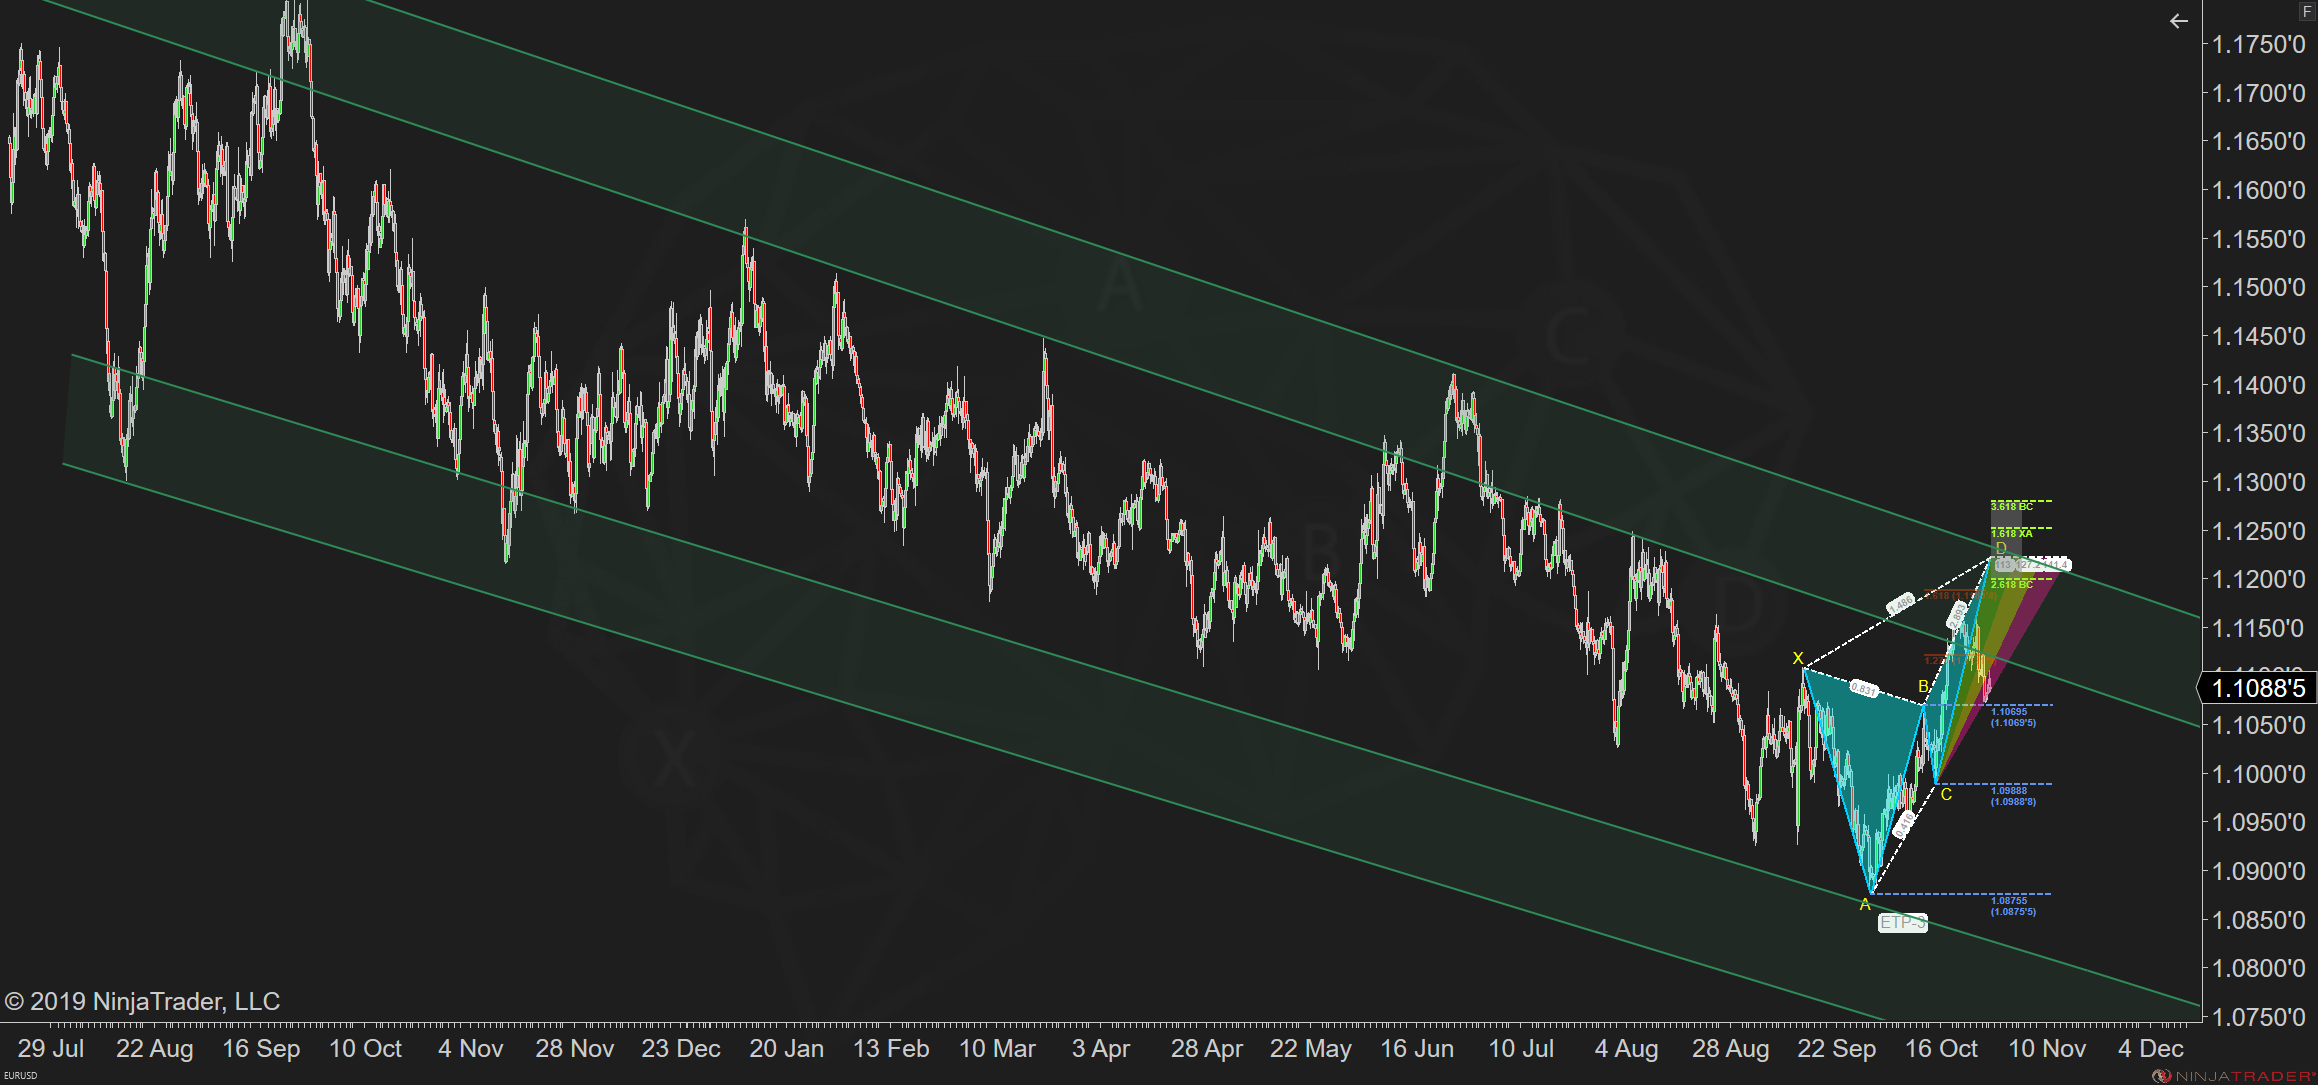
In the video below from our youtube channel you can see more examples of zones being drawn in and how easy it is to do.
We've also been doing live streams where we go over charts and draw in support and resistance levels. You can subscribe to our channel if you want to participate in the next live session. You can also watch the recording for more practices with examples to further practice your technical drawing skills.
Helpful Tips and Tricks
Check out our other helpful tips or tricks videos on our youtube channel, new videos often so might be worth subscribing!
New NinjaTrader Articles Delivered First

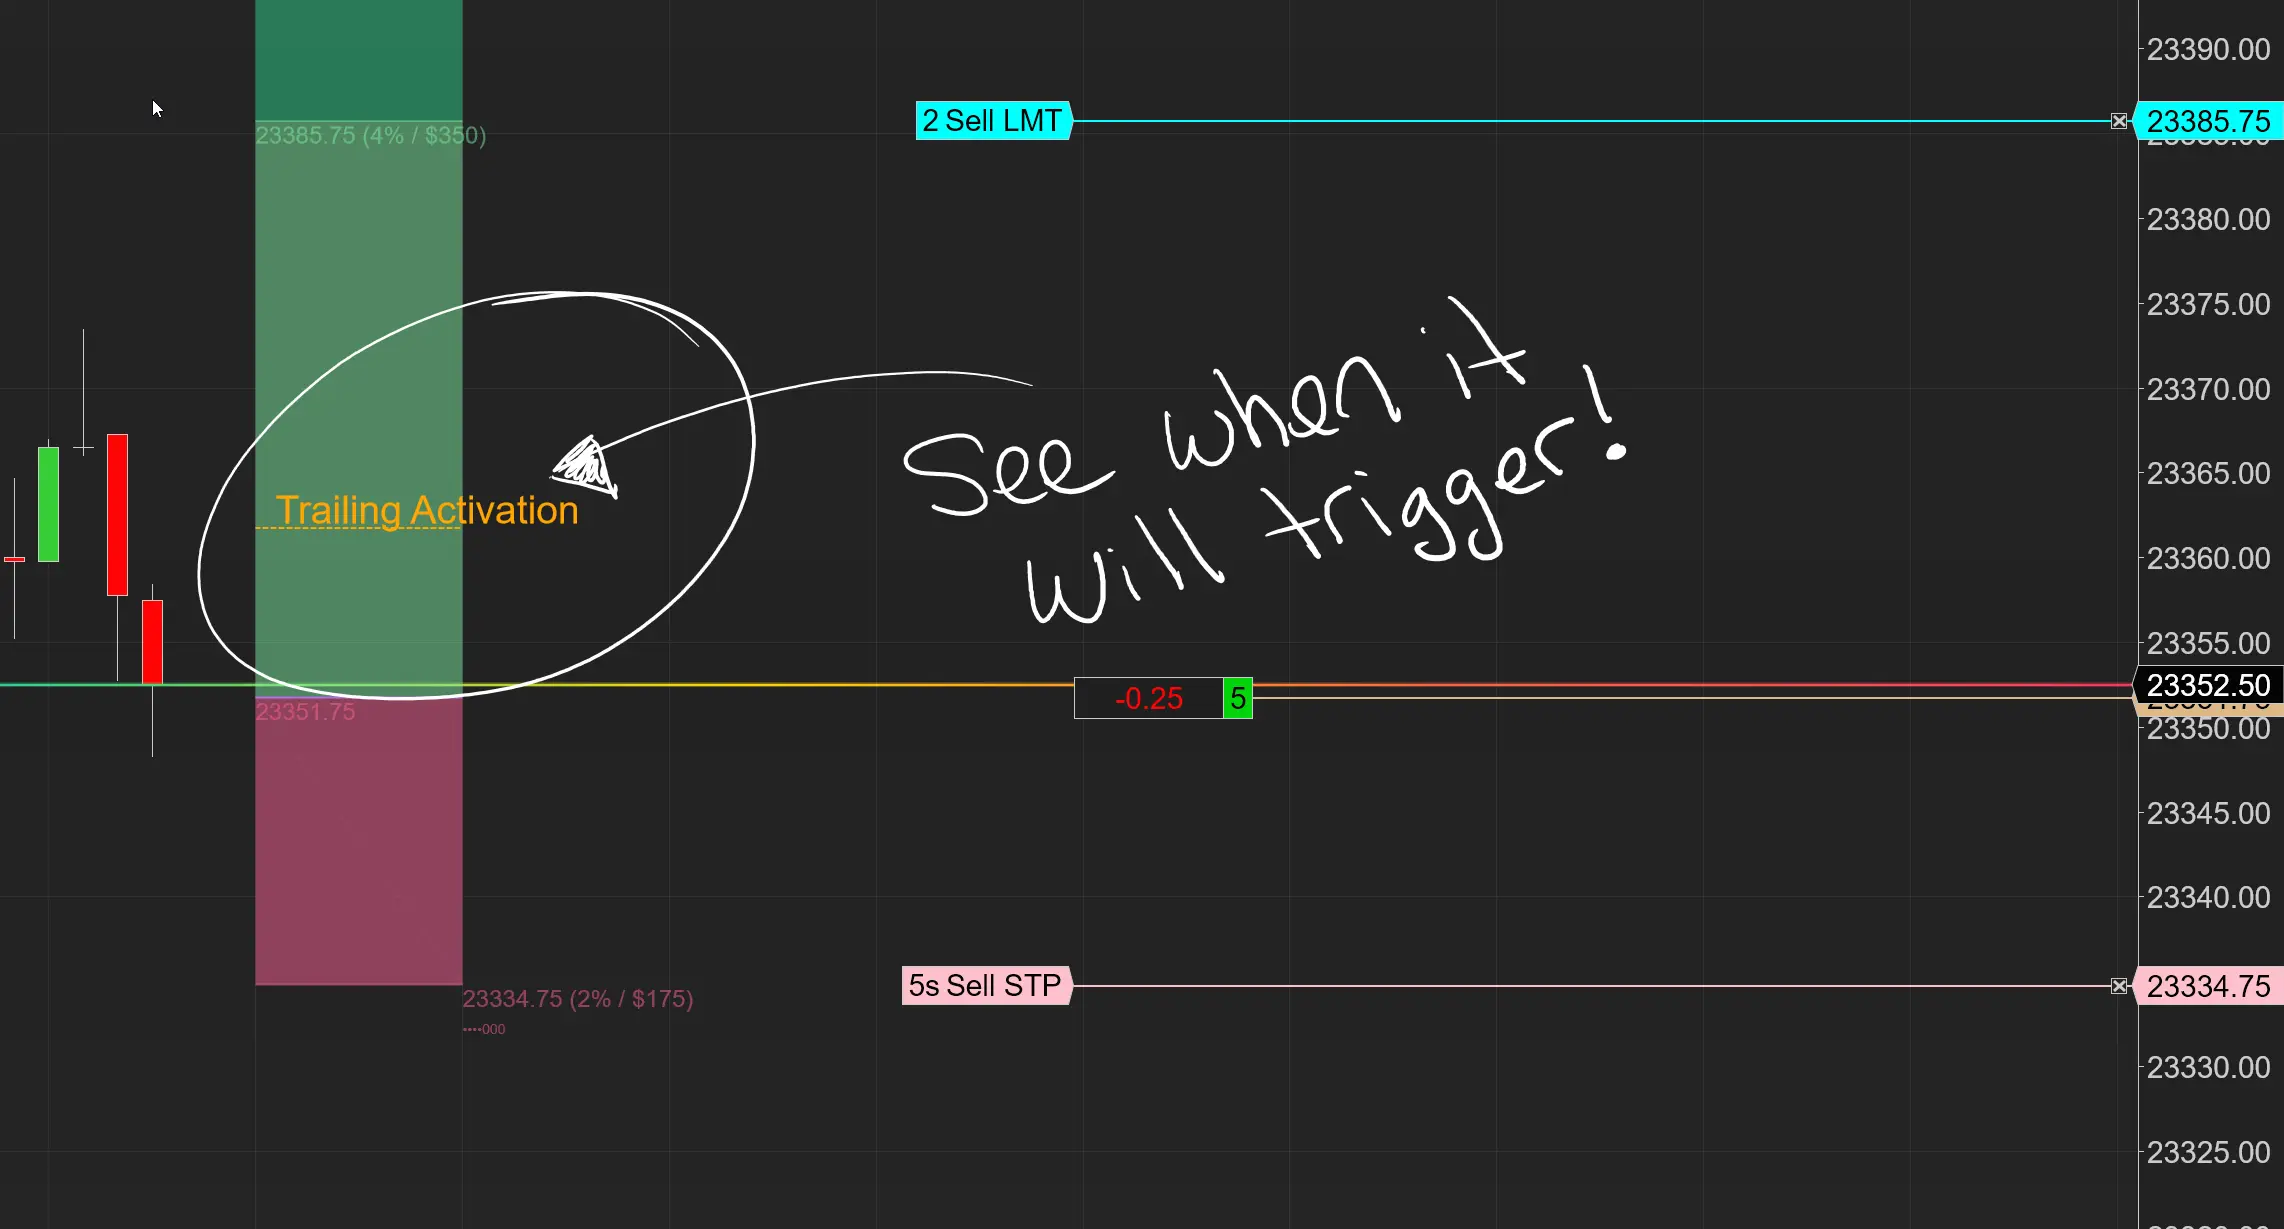
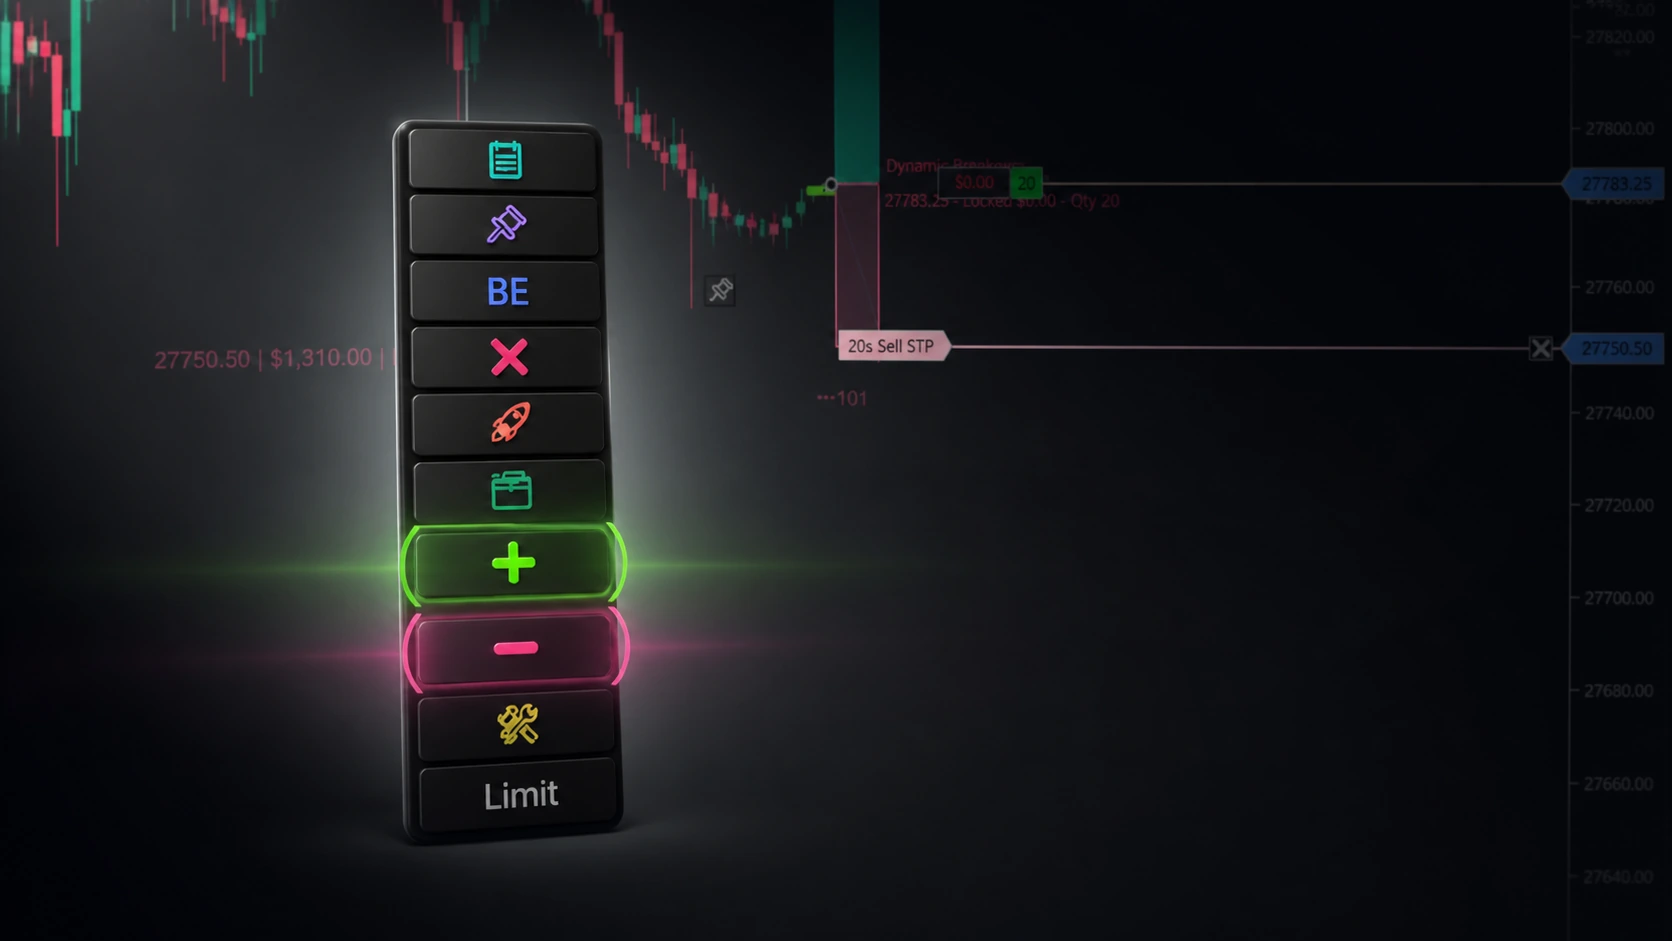
Easy Order Tool
The Strategy


Scanning & Alerting

NinjaTrader Release

XABCD News (Free Version)
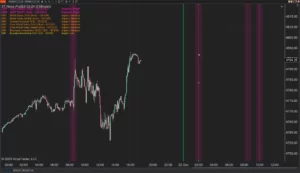
XABCD News (Community Edition) is the best free Indicator for NinjaTrader 8. Don't let news sneak up on you again. Puts economic news events on your charts so you can stay informed and move around positions/stops before the news is released. Works in any market.
XABCD Priceline (Free)
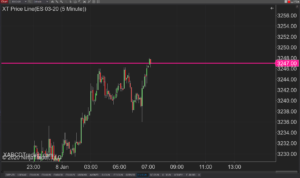
XABCD Price Line tool for NinjaTrader 8 will draw a line at current price and move every time the market changes price. This is useful because it will allow you to easily identify where price is at all times and the exact quoted price.
NinjaTrader Position Sizing Tool: 64 Features Stock NT8 Does Not Include
NinjaTrader – Adding to Position: A Field Guide for Active Traders
NinjaTrader Prop: The Ultimate Guide to Prop Firm Trading
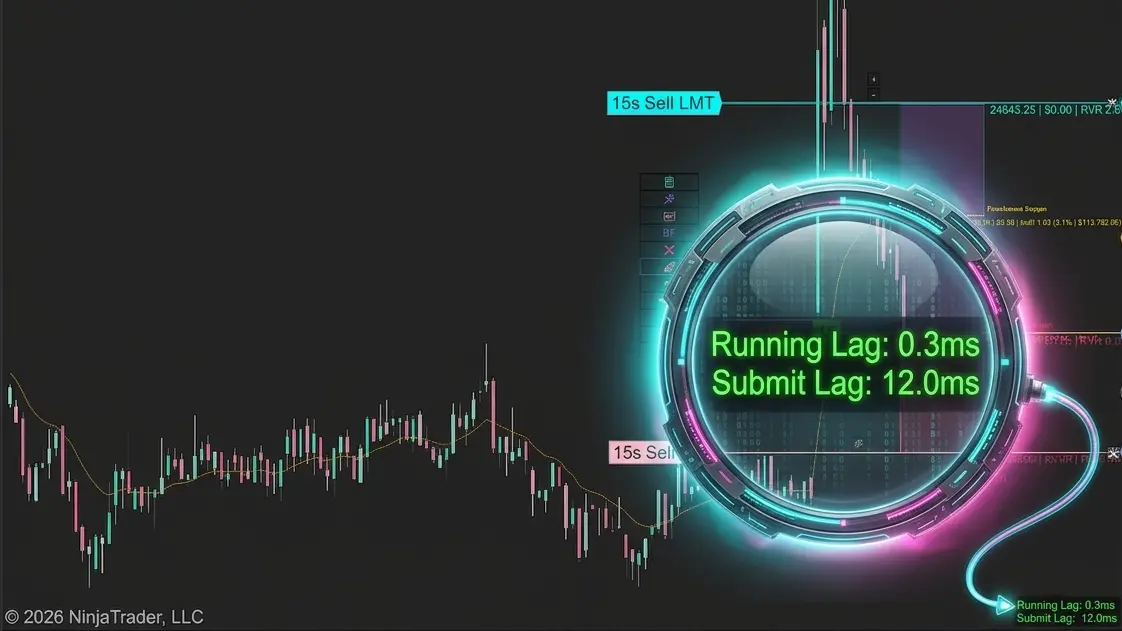
Does the XABCD Position Tool Lag?
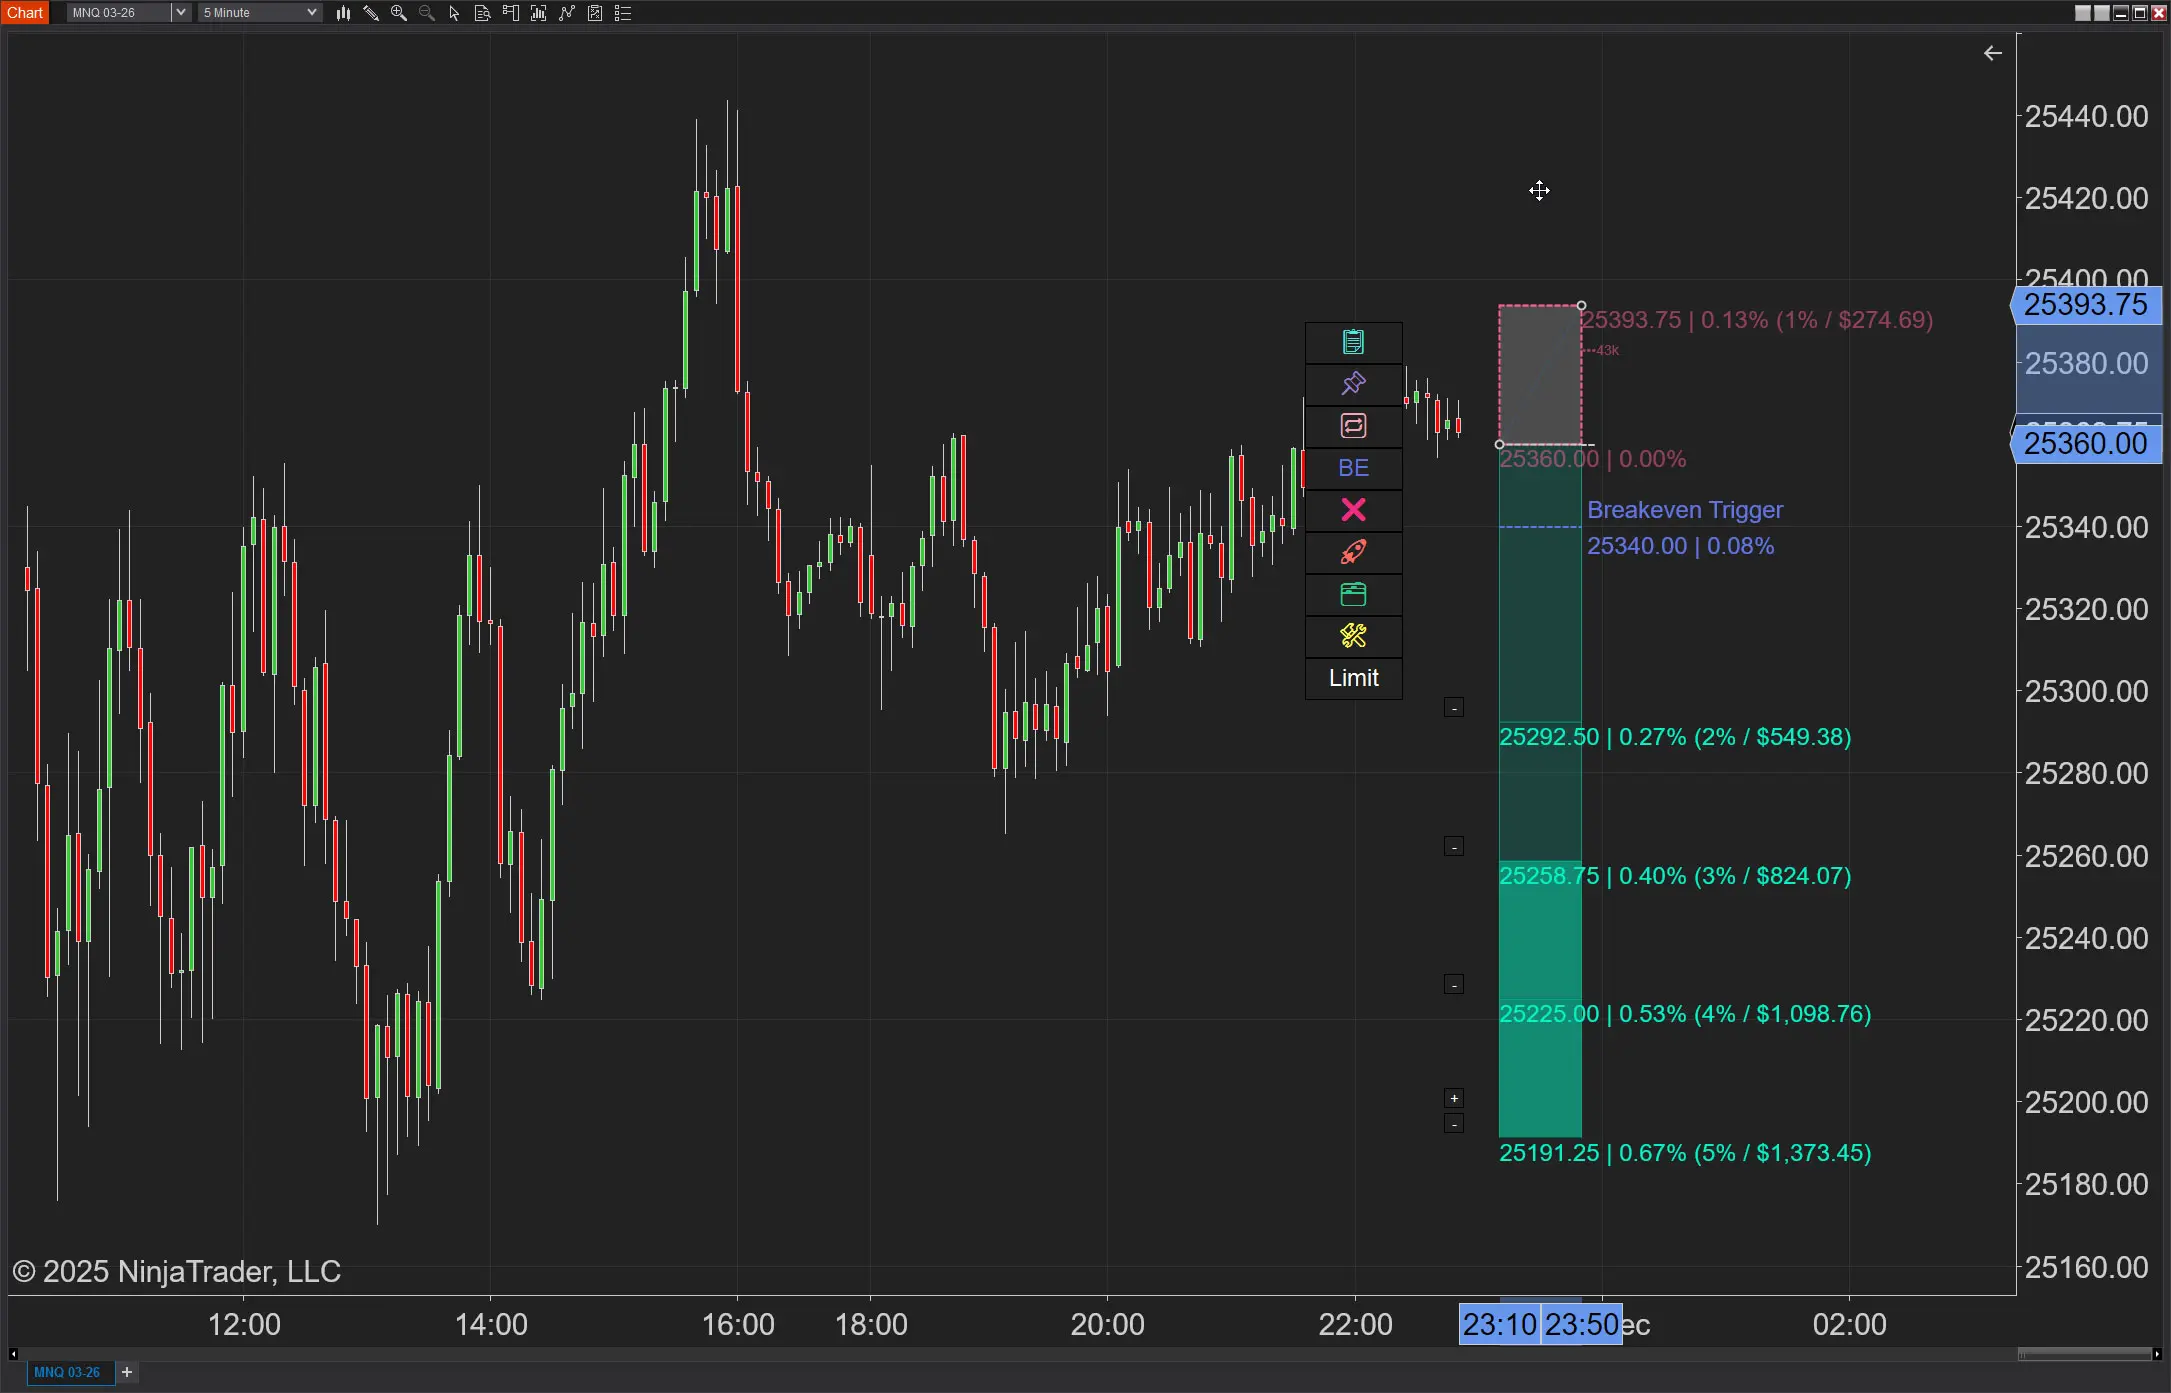
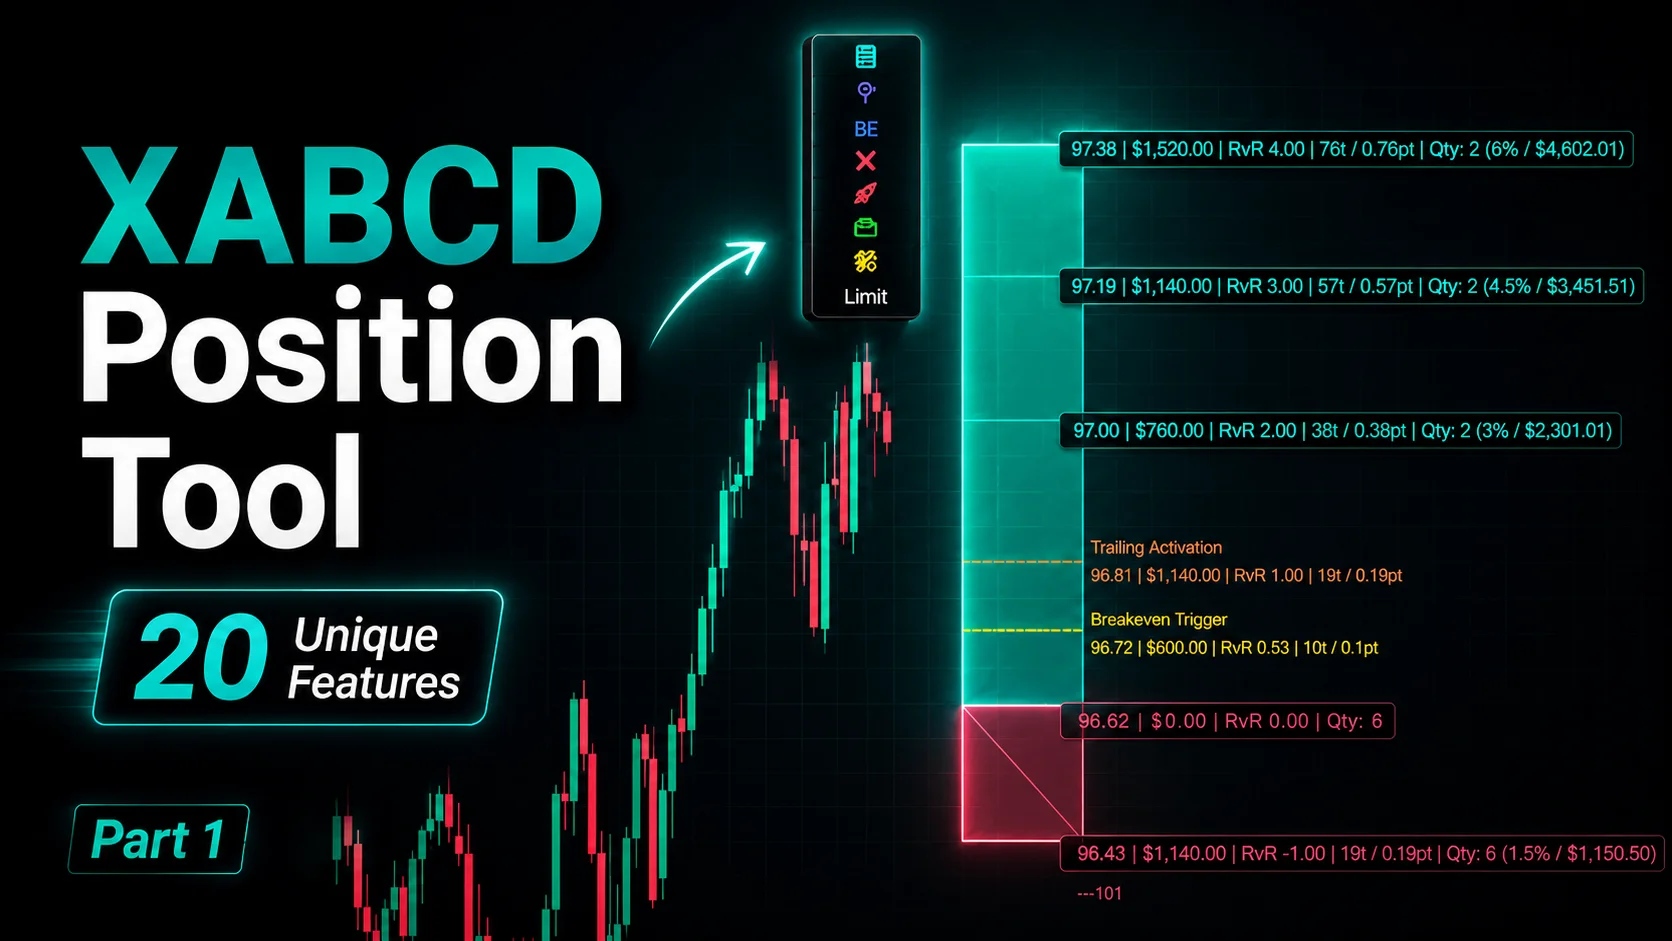
NinjaTrader Position Sizing: What the XABCD Position Tool Can Do That ATM’s Can’t
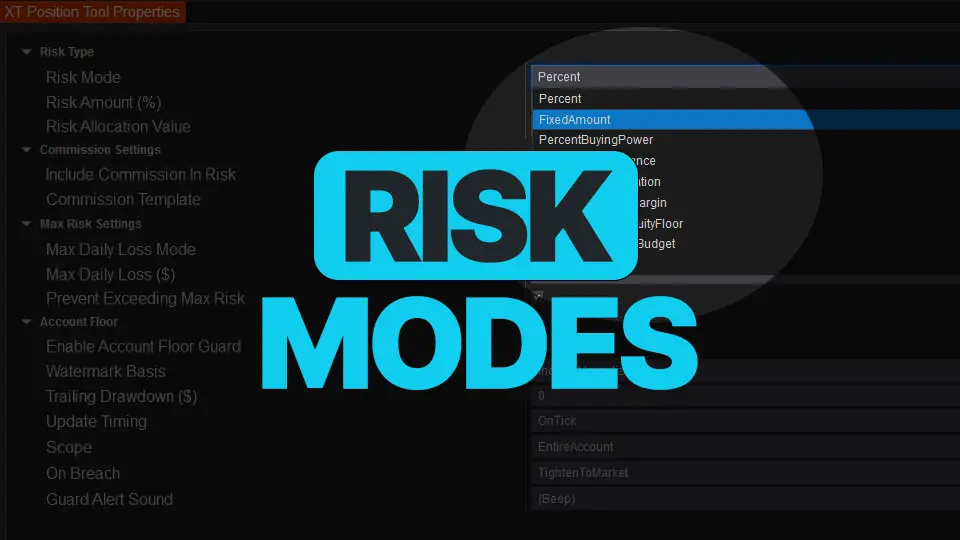
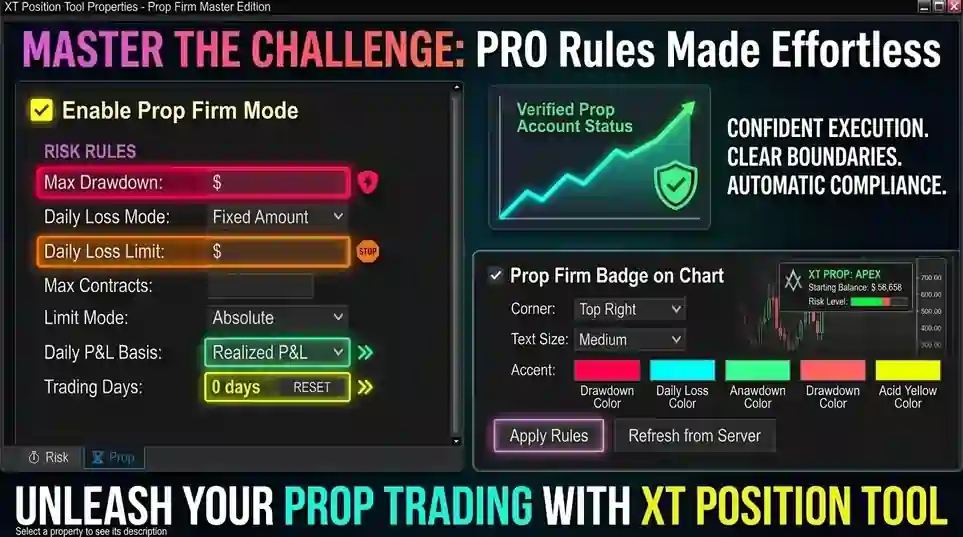
NinjaTrader Risk Management That Actually Moves the Needle
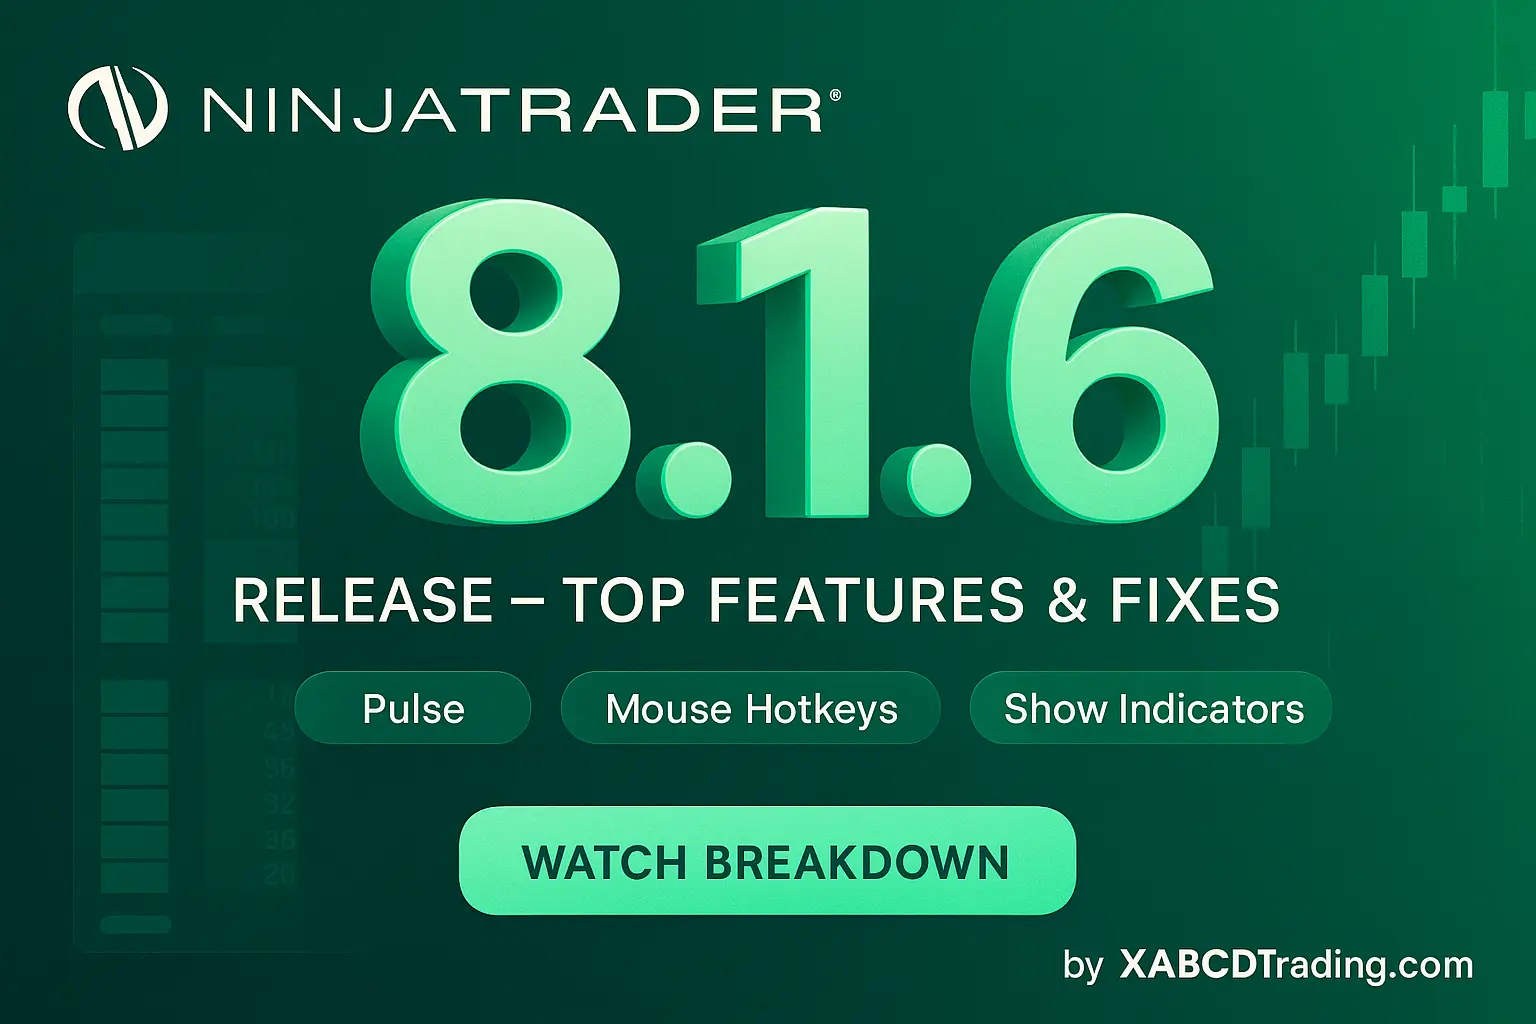
NinjaTrader 8.1.6 — The “No Fluff” Tour (Speed, Clarity, Fewer Clicks)
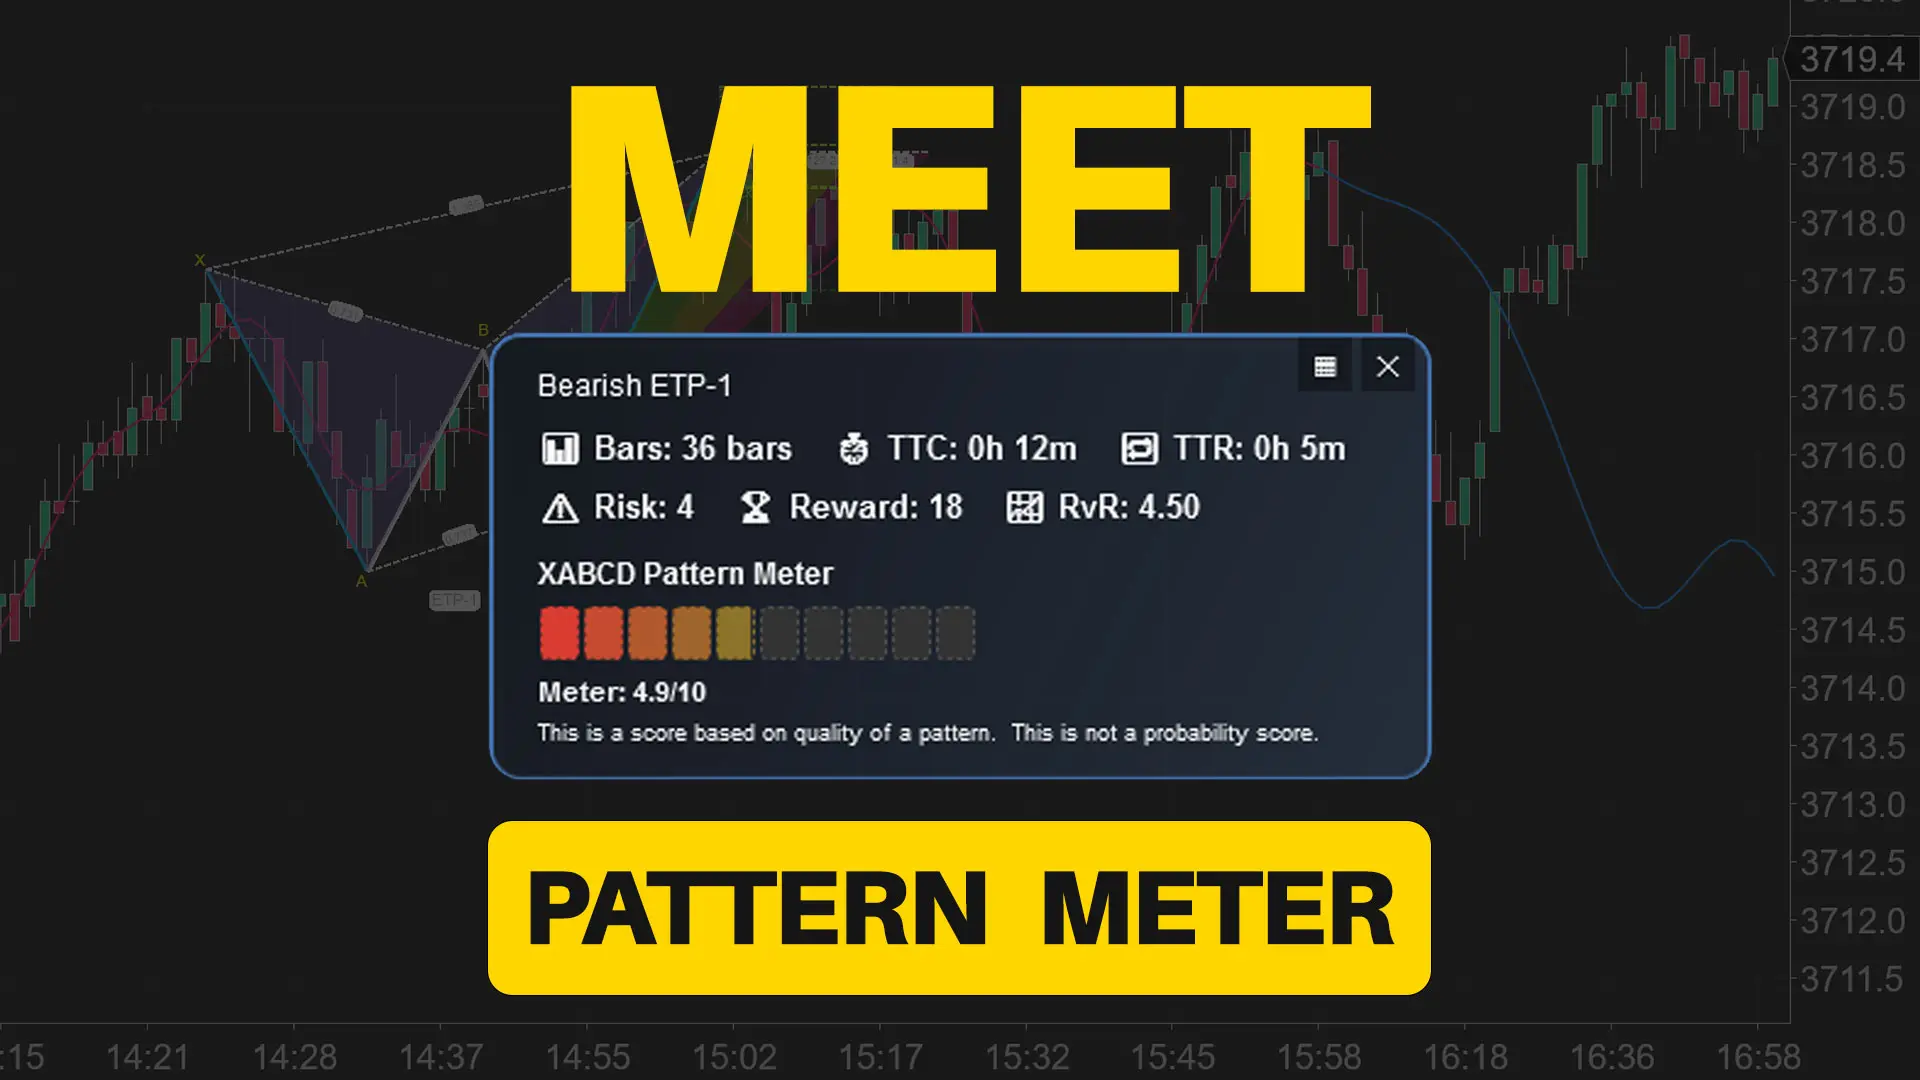
Meet the XABCD Pattern Meter (Real-Time Clarity)
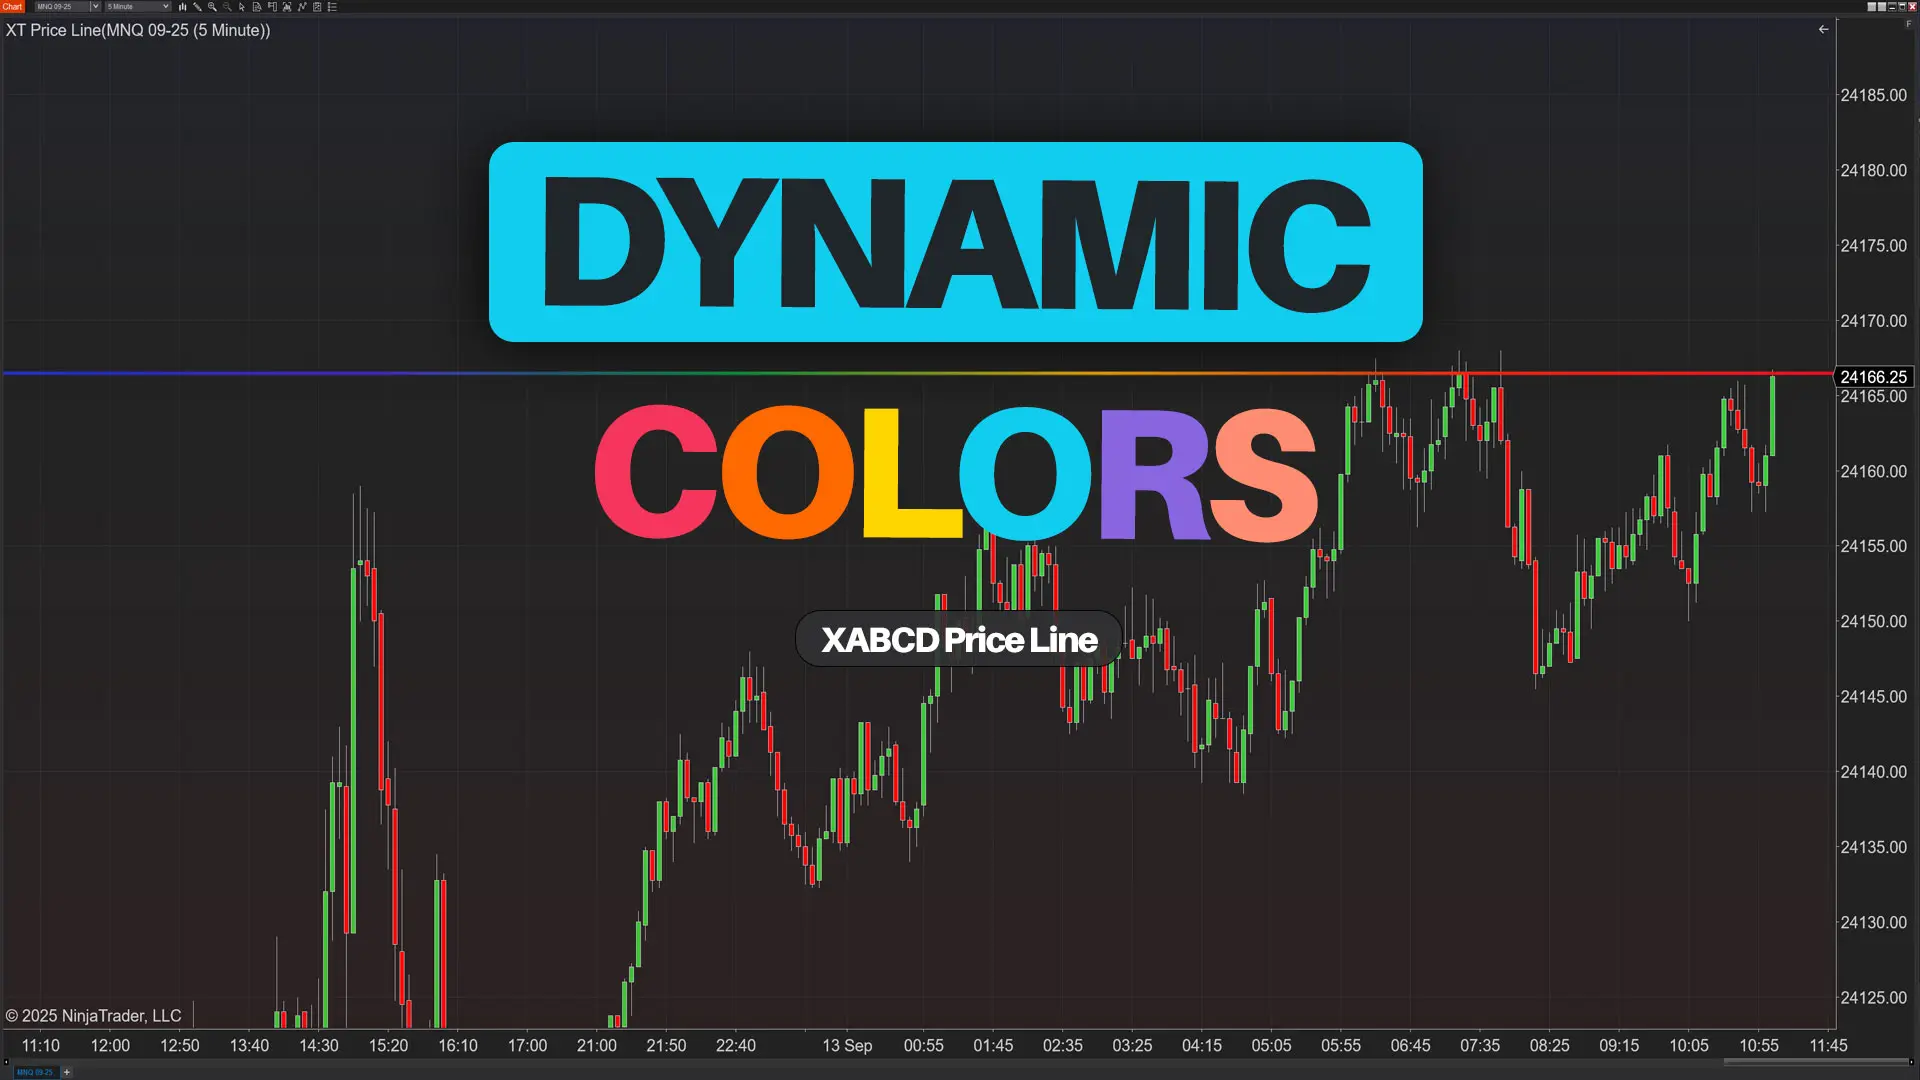
XT PriceLine: Dynamic Colors That Let You See Every Tick