XABCD TRADING
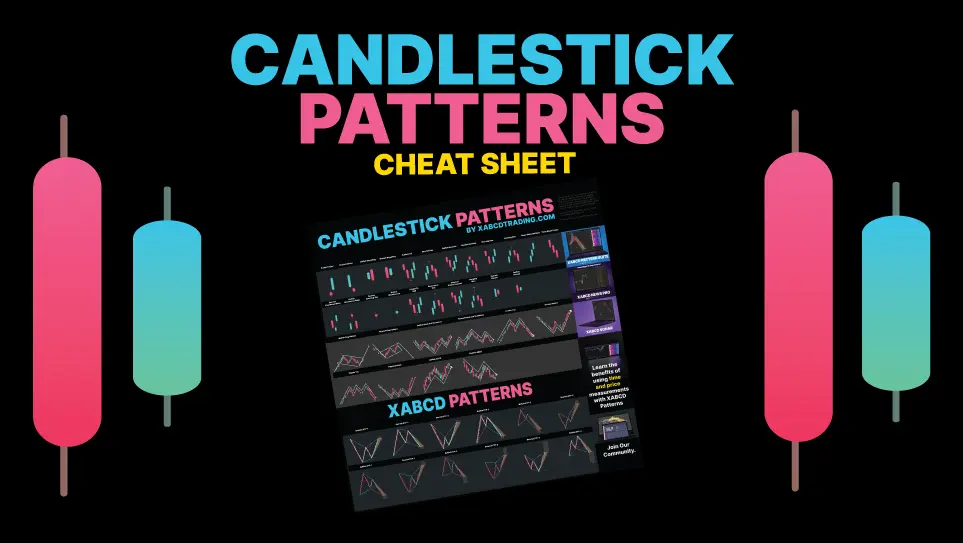
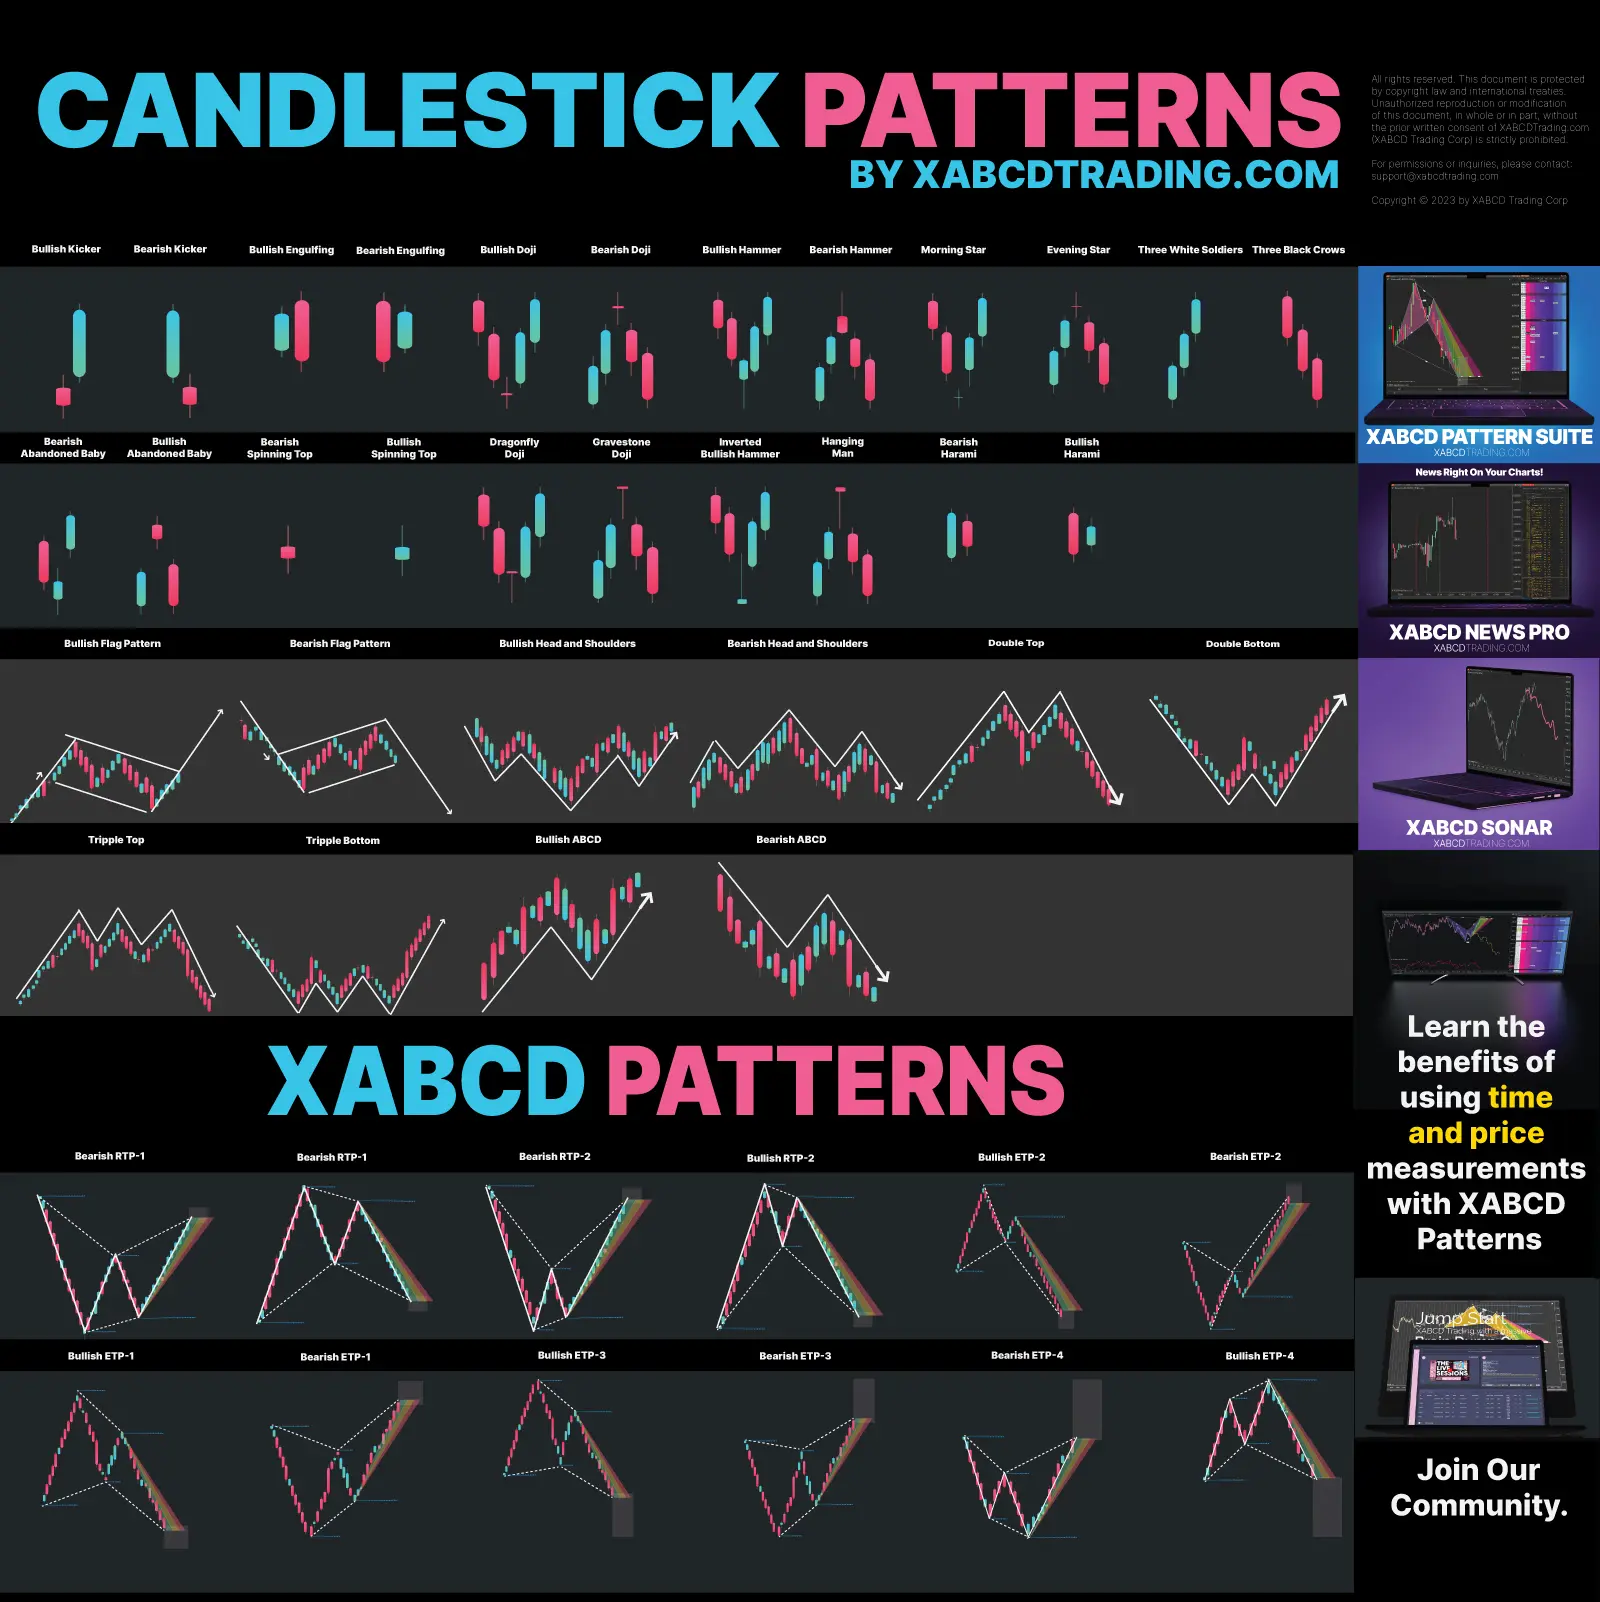
Mastering Candlestick Patterns: Your Ultimate Cheat Sheet
Subscribe
to get alerts to our next blog post!
Using the Candlestick Patterns Cheat Sheet and Guide
Candlestick patterns are the timeless building blocks of technical analysis. They give traders and investors a visual sneak peek into market vibes and price shifts. In the fast-paced financial world, where quick decisions ride on a rollercoaster of factors, becoming a candlestick pattern pro is like having a decoder ring for understanding the intricate dance of prices.
They do come in a few different categories.
- 1, 2 and 3 bar patterns - Based on price
- Multiple Bar Chart Patterns (head and shoulders, flags based on price)
- XABCD Patterns (Which use time and price)
This article serves as your comprehensive guide to understanding and utilizing candlestick patterns as your ultimate cheat sheet with over 35 patterns!
Get Your Free Candlestick Pattern PDF Guide Now!
Understanding Candlestick Charts
Candlestick charts, which first popped up in 18th-century Japan, have become like must-have tools for modern technical analysis. They're way more lively than those old-school line charts. These charts really catch the vibes of each trading stretch, packing in the opening, highest, lowest, and closing prices all in one "candle." The candle's body length spills the beans on the price gap between opening and closing, while the "wicks" or "shadows" stretch out above and below, showing off the highest and lowest prices in that time. It's like seeing price moves in action – you can spot patterns, trends, and turnarounds super clearly.
We're going to break down these candlesticks into patterns and show you how they can be used.
Importance of Candlestick Patterns in Trading
Candlestick patterns transcend their visual elegance to offer traders invaluable insights into market psychology. These patterns aren't just random arrangements of candles; they are collective manifestations of market participants' emotions and actions. By studying the formations, traders can gauge whether the market is bullish, bearish, or indecisive, enabling informed decision-making. Moreover, candlestick patterns serve as leading indicators, offering glimpses into potential reversals, continuations, and trend changes. The ability to predict these shifts grants traders a significant edge, allowing them to position themselves strategically ahead of the curve.
In this journey through the realm of candlestick patterns, we will delve deep into the world of basic, reversal, and continuation patterns, unraveling their meanings, interpreting their implications, and unveiling the stories they narrate about market dynamics. With practical insights, real-life examples, and advanced techniques, this guide empowers you to harness the power of candlestick patterns and elevate your trading acumen to new heights. So, let's embark on this illuminating expedition, where every candle becomes a source of knowledge and every pattern an opportunity waiting to be seized.
How to Read Candlestick Patterns?
A candlestick is a visual representation of price movement over a certain time period, often used in technical analysis of financial markets like stocks, forex, and commodities. Each candlestick provides information about the open, high, low, and close prices for that specific time interval.
Anatomy of a Candlestick
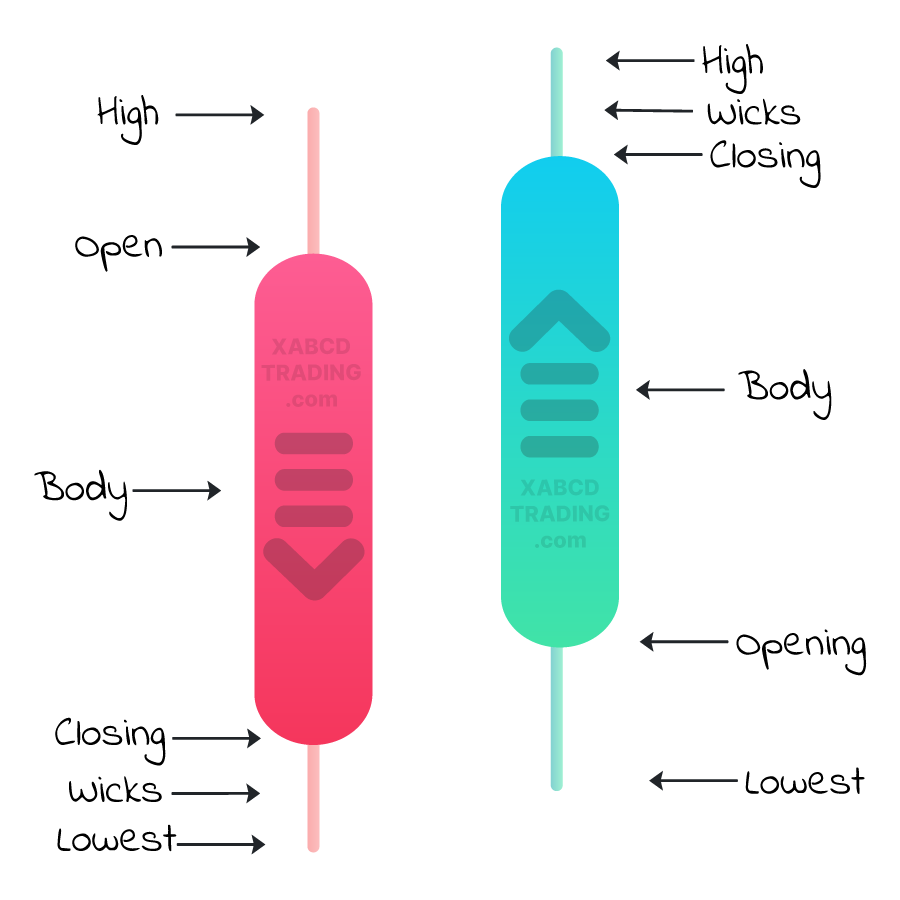
Here's the breakdown of a candlestick's anatomy:
Body: The main part of the candlestick is called the "body." It's like a rectangular box and represents the price range between the opening and closing prices during the chosen time period.
Wicks (or Shadows): The thin lines extending from the top and bottom of the body are called "wicks" or "shadows." They represent the price range between the high and low prices during the time period.
Open Price: The price at which the trading period started is shown by a small horizontal line on the left side of the body. This line is sometimes referred to as the "left wick."
Close Price: The price at which the trading period ended is shown by a small horizontal line on the right side of the body. This line is sometimes referred to as the "right wick."
Putting it all together, the candlestick gives you a quick visual snapshot of how prices behaved during a specific period. You can use candlestick patterns and trends to analyze market sentiment, predict potential price movements, and make trading decisions. Different candlestick patterns and combinations can provide insights into market trends, reversals, and potential entry or exit points for trades.
Body: The main part of the candlestick is called the "body." It's like a rectangular box and represents the price range between the opening and closing prices during the chosen time period.
- If the closing price is higher than the opening price, the body is usually filled with a color (e.g., green or white) to indicate a price increase. This is often referred to as a "bullish" candle.
- If the opening price is higher than the closing price, the body is filled with a different color (e.g., red or black) to indicate a price decrease. This is often referred to as a "bearish" candle.
Wicks (or Shadows): The thin lines extending from the top and bottom of the body are called "wicks" or "shadows." They represent the price range between the high and low prices during the time period.
- The upper wick extends from the top of the body to the high price, showing the highest price reached during the time period.
- The lower wick extends from the bottom of the body to the low price, indicating the lowest price reached.
Open Price: The price at which the trading period started is shown by a small horizontal line on the left side of the body. This line is sometimes referred to as the "left wick."
Close Price: The price at which the trading period ended is shown by a small horizontal line on the right side of the body. This line is sometimes referred to as the "right wick."
Putting it all together, the candlestick gives you a quick visual snapshot of how prices behaved during a specific period. You can use candlestick patterns and trends to analyze market sentiment, predict potential price movements, and make trading decisions. Different candlestick patterns and combinations can provide insights into market trends, reversals, and potential entry or exit points for trades.
Different Timeframes and Their Implications
Different timeframes totally shake up how those candlestick patterns look and what they mean:
Short Timeframes (Fast & Furious):
Bottom Line: The timeframe you choose shapes your style and strategy. Quick timeframes mean quick decisions. Longer timeframes need more patience. Patterns on longer timeframes are like VIP signals – they carry more weight and show stronger trends.
Short Timeframes (Fast & Furious):
- On super short charts, like 5 minutes, candlestick patterns change super fast.
- Patterns might show quick changes in mood, but they don't hold as much weight. They're great for quick trades.
- On hourly or daily charts, things even out a bit.
- Candlestick patterns here matter more and can signal real trend shifts. Good for swing traders.
- Weekly and monthly charts give you the big picture.
- Patterns here are serious indicators of major shifts. Awesome for long-term investors.
Bottom Line: The timeframe you choose shapes your style and strategy. Quick timeframes mean quick decisions. Longer timeframes need more patience. Patterns on longer timeframes are like VIP signals – they carry more weight and show stronger trends.
Single-Candle Reversal Patterns
Input your text here! The text element is intended for longform copy that could potentially include multiple paragraphs.
Hammer and Hanging Man Patterns
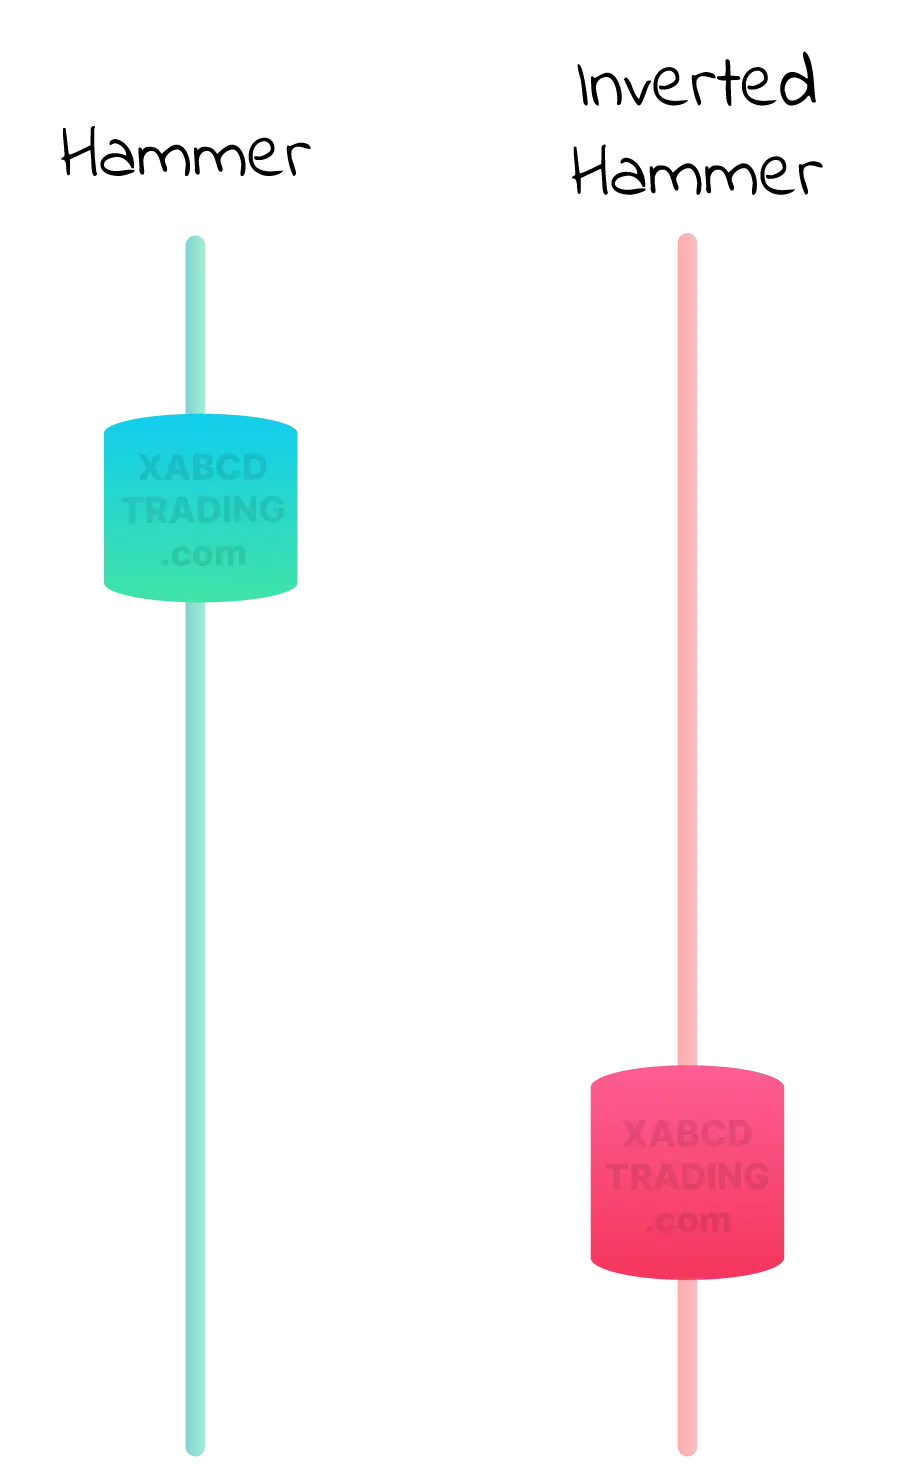
Alright, let's talk about the hammer candlestick pattern! Picture this: you've got a single candle that looks like a hammer. But we're not building anything – we're checking out the markets.
So, this hammer has a short body at the top and a long "handle" (or shadow) hanging down. It's like Thor's hammer, but for traders. What's cool is that the hammer usually shows up after a downtrend, like when prices have been dropping.
Here's what it's saying:
So, this hammer has a short body at the top and a long "handle" (or shadow) hanging down. It's like Thor's hammer, but for traders. What's cool is that the hammer usually shows up after a downtrend, like when prices have been dropping.
Here's what it's saying:
- The short body means the opening and closing prices were close together, often near the top.
- The long handle points down and shows how far the price dipped during that time.
- It's like the market was beaten down but managed to bounce back up by the end of the period.
When you see this hammer after a bunch of drops, it's like a little signal that says, "Hey, maybe things are gonna turn around now." But remember, no signal is foolproof. It's just one of those hints traders use to make their moves. So, next time you spot a hammer, you'll know it's not about construction – it's all about the trading game.
Interpretation and Application
Gotcha! Imagine a chart showing a candlestick that looks like a hammer – not for building, but for trading.
It's got a short top and a long shadow down below, like a lollipop. Here's the scoop:
Short top: Opening and closing prices were close, usually at the top.
Long stick down: Price fell but bounced back by the end.
Now, if this hammer shows up after prices have been dropping, it's like a little signal saying, "Hey, trend might be turning around."
But remember, it's not a guarantee. Traders use it as a hint, not a magic wand. So, when you see a hammer after a slump, it's like the market saying, "Watch out, things could shift."
Two-Candle Reversal Patterns
What is A Bullish and Bearish Engulfing Pattern?
Let's talk about bullish and bearish engulfing patterns – they're like the "plot twists" of trading.
Bullish Engulfing Pattern: Imagine a tiny red (or black) candle followed by a big green (or white) one that completely covers it. It's like the market suddenly going, "I've got this!"
Bullish Engulfing Pattern: Imagine a tiny red (or black) candle followed by a big green (or white) one that completely covers it. It's like the market suddenly going, "I've got this!"
- The small red candle shows a dip in prices.
- Then, bam! The big green one swoops in, not only erasing the dip but going higher.
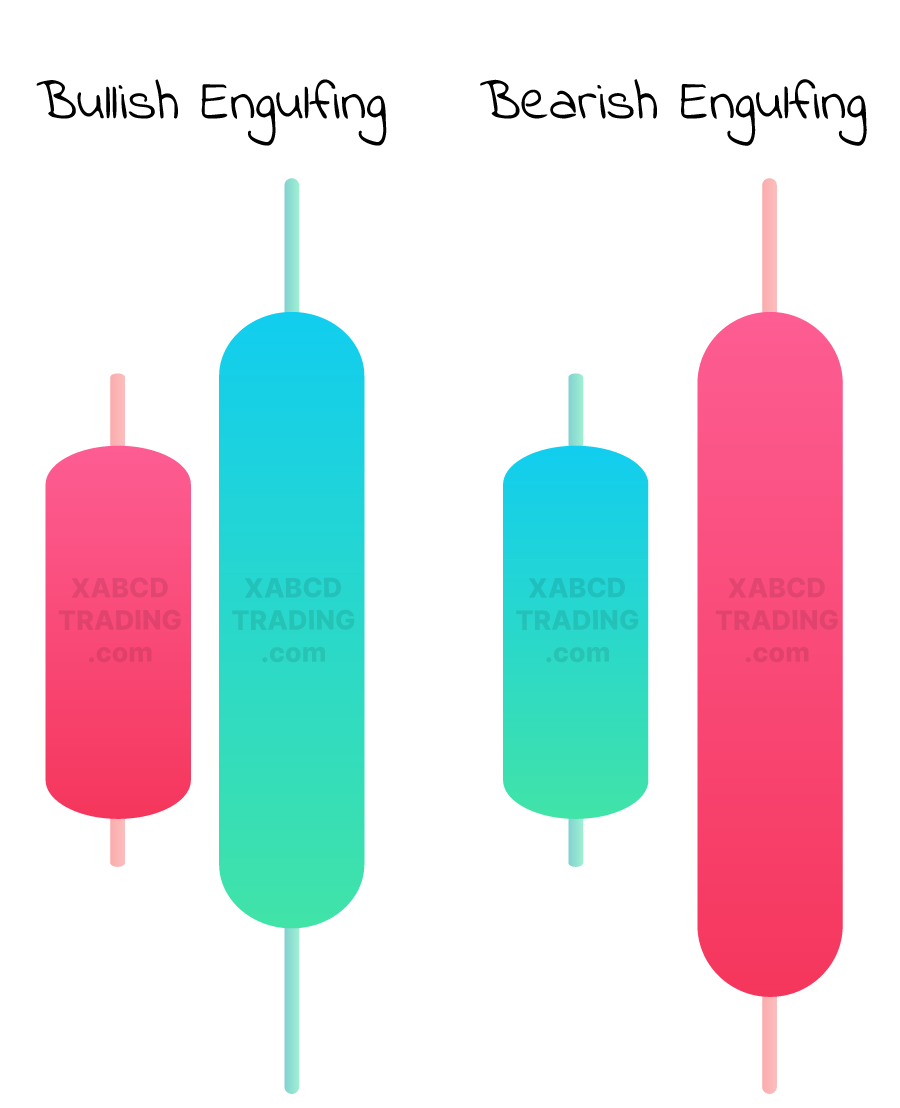
Bearish Engulfing Pattern:
Flip the script: a small green (or white) candle followed by a larger red (or black) one that engulfs it. Think of it as the market saying, "Hold up, it's not all sunshine!"
Just remember, these patterns aren't crystal balls. They're more like clues, so keep your trading radar on – surprises are part of the fun!
- The small green candle shows prices rising a bit.
- Then, bam! The big red one shows up, wiping out gains and diving lower.
Just remember, these patterns aren't crystal balls. They're more like clues, so keep your trading radar on – surprises are part of the fun!
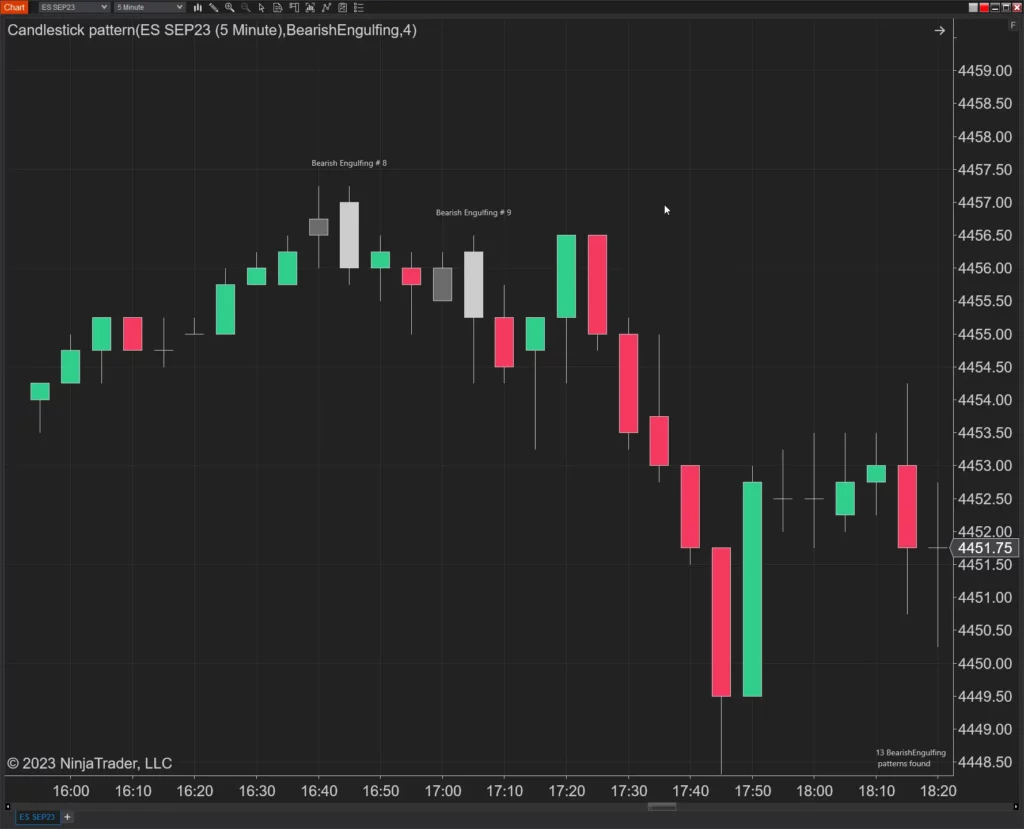
Real-Life Examples and Their Analysis
The candlesticks in grey will show you the real life example of these patterns. NinjaTrader has a candlestick pattern tool built in that does the 1, 2 and 3 bar reversals. The way we use these is in combination with our XABCD Patterns where once we're in a reversal area we can look for these engulfing patterns to be presented.
Three-Candle Reversal Patterns
Input your text here! The text element is intended for longform copy that could potentially include multiple paragraphs.
Morning Star and Morning Doji Star
Imagine you're watching a movie about the stock market. Suddenly, a scene comes up – it's the "Morning Star" pattern!
Here's how it goes:
But remember, just like in the movies, it's not always a happy ending. Patterns are like hints, not guarantees. So, when you spot a Morning Star, consider it a little wink from the market, hinting at a possible turnaround.
Here's how it goes:
- First, you see a big red "down" day, where prices drop.
- Then, there's a small candle, not sure if it wants to go up or down – it's like a pause button.
- And here comes the hero – a big green "up" day that shoots way up, closing above the midpoint of the first red day.
- Think of it as a signal that the bad times might be changing. It's like the market saying, "Hey, things were rough, but maybe the sun's coming out now!"
But remember, just like in the movies, it's not always a happy ending. Patterns are like hints, not guarantees. So, when you spot a Morning Star, consider it a little wink from the market, hinting at a possible turnaround.
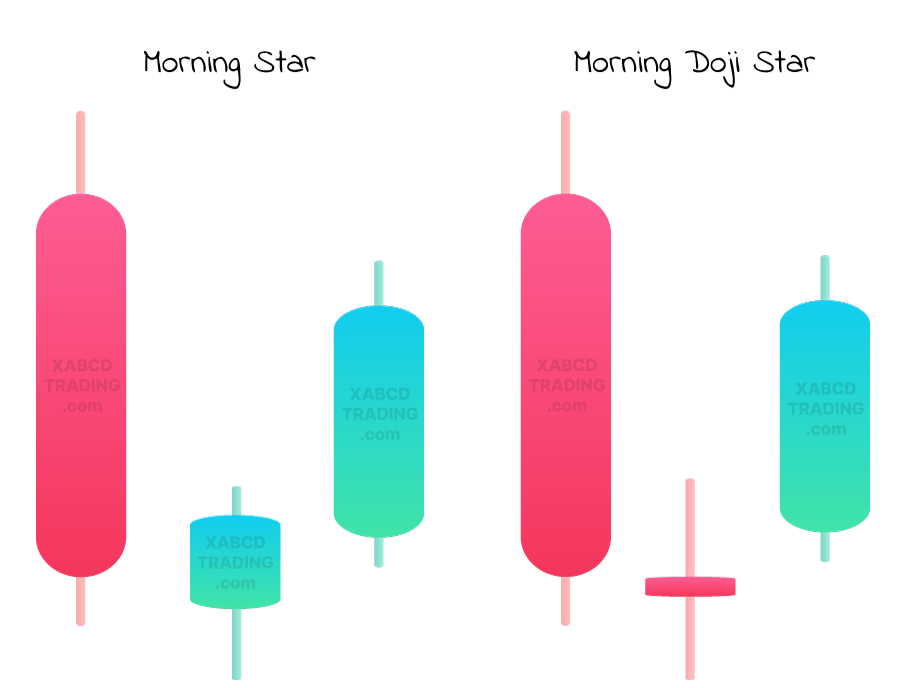
The "Morning Doji Star" is like a twist on the regular Morning Star pattern – it's like a spicy variation in the trading plot.
Remember, these patterns are like clues for traders, not magic answers. When you spot a Morning Doji Star, it's like the market leaving you a riddle to solve. Keep your trading detective hat on and use other tools to piece together the whole story!
- First, you've got a big red "down" day, where prices take a tumble.
- Then, there's a small candle that's like, "Hmm, can't decide which way to go." This is the doji candle, where the open and close are pretty much the same, showing indecision.
- Now comes the twist – a big green "up" day that shoots up, closing above the midpoint of the first red day.
Remember, these patterns are like clues for traders, not magic answers. When you spot a Morning Doji Star, it's like the market leaving you a riddle to solve. Keep your trading detective hat on and use other tools to piece together the whole story!
Advanced Candlestick Patterns
Fibonacci and XABCD Patterns
An XABCD pattern is a specific type of technical analysis pattern that traders use to identify potential price reversals in financial markets. These patterns are based on the principles of Fibonacci ratios and involve both price and time considerations. The XABCD pattern consists of a series of price movements that follow specific ratios, helping traders predict where price trends might change direction.
The key points in an XABCD pattern are labeled X, A, B, C, and D:
The uniqueness of XABCD patterns is that they incorporate both specific price ratios and time ratios for each leg of the pattern. This combination of price and time analysis aims to identify potential turning points in the market, aiding traders in making informed decisions about entry, exit, and trade management.
The key points in an XABCD pattern are labeled X, A, B, C, and D:
- X: This is the starting point of the pattern. It marks the beginning of a price move, which can be an uptrend or a downtrend.
- A: The first significant reversal point after the initial move (XA). This point marks the beginning of a corrective move (AB).
- B: The retracement point of the initial move (XA). It's where the price retraces a certain percentage of the XA leg.
- C: The second reversal point in the pattern. It marks the end of the corrective move (AB) and the beginning of the CD leg.
- D: The completion point of the pattern. It's where the CD leg reaches a Fibonacci extension level of the XA leg. Traders look for potential reversal signals at this point.
The uniqueness of XABCD patterns is that they incorporate both specific price ratios and time ratios for each leg of the pattern. This combination of price and time analysis aims to identify potential turning points in the market, aiding traders in making informed decisions about entry, exit, and trade management.
Integrating Candlesticks into Complex Strategies
Yes, you can certainly incorporate XABCD patterns into your existing trading strategy. Many traders use XABCD patterns as a supplementary tool alongside other technical indicators, fundamental analysis, and risk management techniques. Here's how you might integrate XABCD patterns into your strategy:
| Aspect | Integration of XABCD Patterns |
|---|---|
| Confirmation & Confluence | Align with other technical analysis to strengthen trade setups. |
| Entry & Exit Points | Utilize pattern completion (D point) for potential entries/exits. |
| Trade Management | Guide decisions on adjusting stop loss, taking partial profits. |
| Time Frames | Identify patterns on different time frames for trend alignment. |
| Risk Management | Set stop-loss orders around critical pattern points for risk control. |
| Pattern Failure | Be prepared to adjust strategy if patterns fail to confirm. |
| Backtesting | Test patterns on historical data to assess effectiveness. |
| Continuous Learning | Incorporate patterns as part of ongoing trading education. |
Continuation Patterns
Input your text here! The text element is intended for longform copy that could potentially include multiple paragraphs.
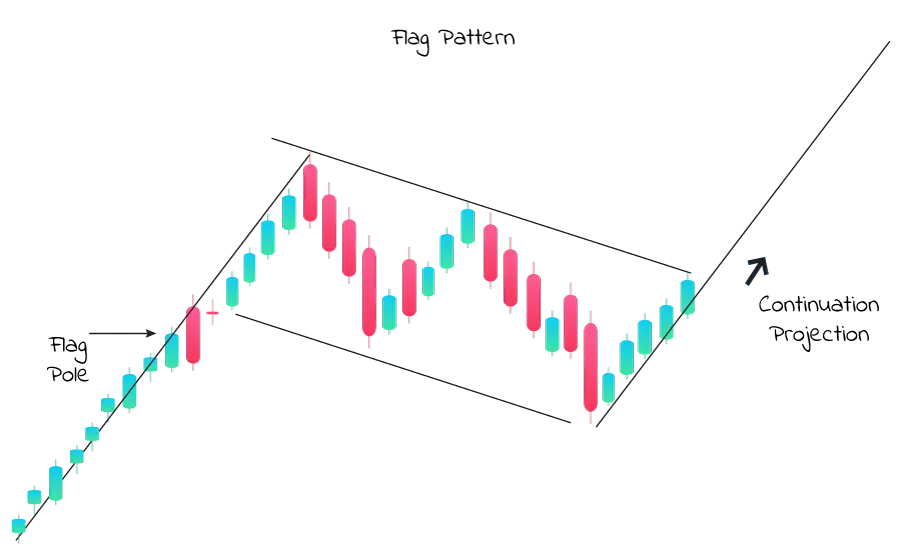
Flag Pattern
Imagine you're watching a race, and the runner suddenly takes a little break, catching their breath before sprinting again. That's what a flag pattern is like in the trading world.
The Flag Pattern Breakdown:
After this little break, the price usually continues running in the same direction as before. It's like the runner got their energy back and goes on with the race. So, why's it a continuation pattern? Well, it's like a quick pit stop for the trend. The market's taking a breather but doesn't change its mind about where it's headed. Traders spot flag patterns to anticipate that the trend is gonna keep on trucking after the short pause.
Just remember, while it often works out, nothing's set in stone in trading. It's more like reading the signs and making informed guesses. So, when you see that flag waving in the charts, get ready for the race to continue!
The Flag Pattern Breakdown:
- First, there's this big exciting price move in one direction – like the runner taking off.
- Then, instead of going wild, the price takes a chill pill. It kinda moves sideways or makes a small zigzag, like the runner catching their breath.
- This sideways move looks like a flag hanging off a pole, hence the name "flag pattern."
After this little break, the price usually continues running in the same direction as before. It's like the runner got their energy back and goes on with the race. So, why's it a continuation pattern? Well, it's like a quick pit stop for the trend. The market's taking a breather but doesn't change its mind about where it's headed. Traders spot flag patterns to anticipate that the trend is gonna keep on trucking after the short pause.
Just remember, while it often works out, nothing's set in stone in trading. It's more like reading the signs and making informed guesses. So, when you see that flag waving in the charts, get ready for the race to continue!
How to Incorporate Flags and Pennants into Your Strategy
Incorporating flag patterns into your trading strategy involves a mix of observation, timing, and risk management. Here's a casual breakdown of how to do it:
Spotting Flags: Keep an eye out for a strong price move, like a rally or a drop. Look for a period of consolidation afterward, where the price moves sideways or slightly retraces. This is your flag.
Confirm the Trend: Before acting, make sure the flag is in line with the existing trend. Flags are continuation patterns, so they should match the trend's direction.
Entry and Exit: Plan your entry point for when the price breaks out of the flag pattern in the same direction as the initial strong move. Set a target based on the size of the initial move. The distance the price traveled before forming the flag can be a guide.
Risk Management: Place a stop-loss order below the low (for bullish flags) or above the high (for bearish flags) of the flag pattern. This helps limit potential losses if the trade doesn't go as planned.
Confirmation: Use other indicators or tools to confirm your trade. This might include support/resistance levels, moving averages, or momentum indicators.
Time Frame: Flags can appear on various timeframes, so adjust your strategy to your preferred trading horizon. Shorter timeframes may lead to quicker trades, while longer timeframes might require more patience.
Practice and Learning: Practice identifying and trading flag patterns on historical charts before committing real money. This helps you refine your skills and gain confidence.
Flexibility: Not all flag patterns work out perfectly. Be prepared for occasional false breakouts or reversals.
Risk-Reward Ratio: Ensure that your potential reward justifies the risk you're taking. Ideally, your potential profit should be larger than your potential loss.
Mastering Candlestick Patterns Using the Cheat Sheet
A Quick Reference for Key Patterns
Having candlestick patterns laid out in front of you when trading is like having a treasure map in your hands while searching for hidden gems.
Why Does Everyone Need A Pattern Cheat Sheet?
There are many reasons why having patterns on a cheat sheet in front of you while trading can be beneficial for several reasons:
#1Quick Reference: Cheat sheets containing patterns provide a quick and easy reference to different chart patterns, indicators, and technical analysis concepts. This can save you time during trading, especially when you need to make split-second decisions.
#2Pattern Recognition: Trading involves identifying patterns in price charts and market data. Cheat sheets help you become more proficient at recognizing these patterns, which can enhance your ability to spot potential trading opportunities or trends.
#3Avoiding Mistakes: Mistakes can be costly in trading. Having a visual guide of patterns on your cheat sheet can help you avoid misidentifying patterns or making incorrect trading decisions based on incomplete information.
#4Consistency: Trading patterns often have specific criteria that need to be met for a valid signal. A cheat sheet can help you stay consistent in your analysis by reminding you of the key elements to look for in each pattern.
#5Enhanced Confidence: Confidence in trading comes from understanding and experience. Having a cheat sheet in front of you can boost your confidence by providing a visual aid to support your trading decisions.
Risk Management and Trading Strategy
Using candlestick patterns to assist with risk management can be helpful in several ways for traders. While patterns themselves don't directly determine risk, they can provide valuable insights that enhance your overall risk management strategy. Here's how patterns can contribute to effective risk management:
Setting Entry and Exit Points
Patterns can help you identify optimal entry and exit points for trades. Having clear entry and exit signals based on pattern formations can assist in setting precise stop-loss and take-profit levels, helping you manage risk more effectively.
Calculating Optimal Position Sizes
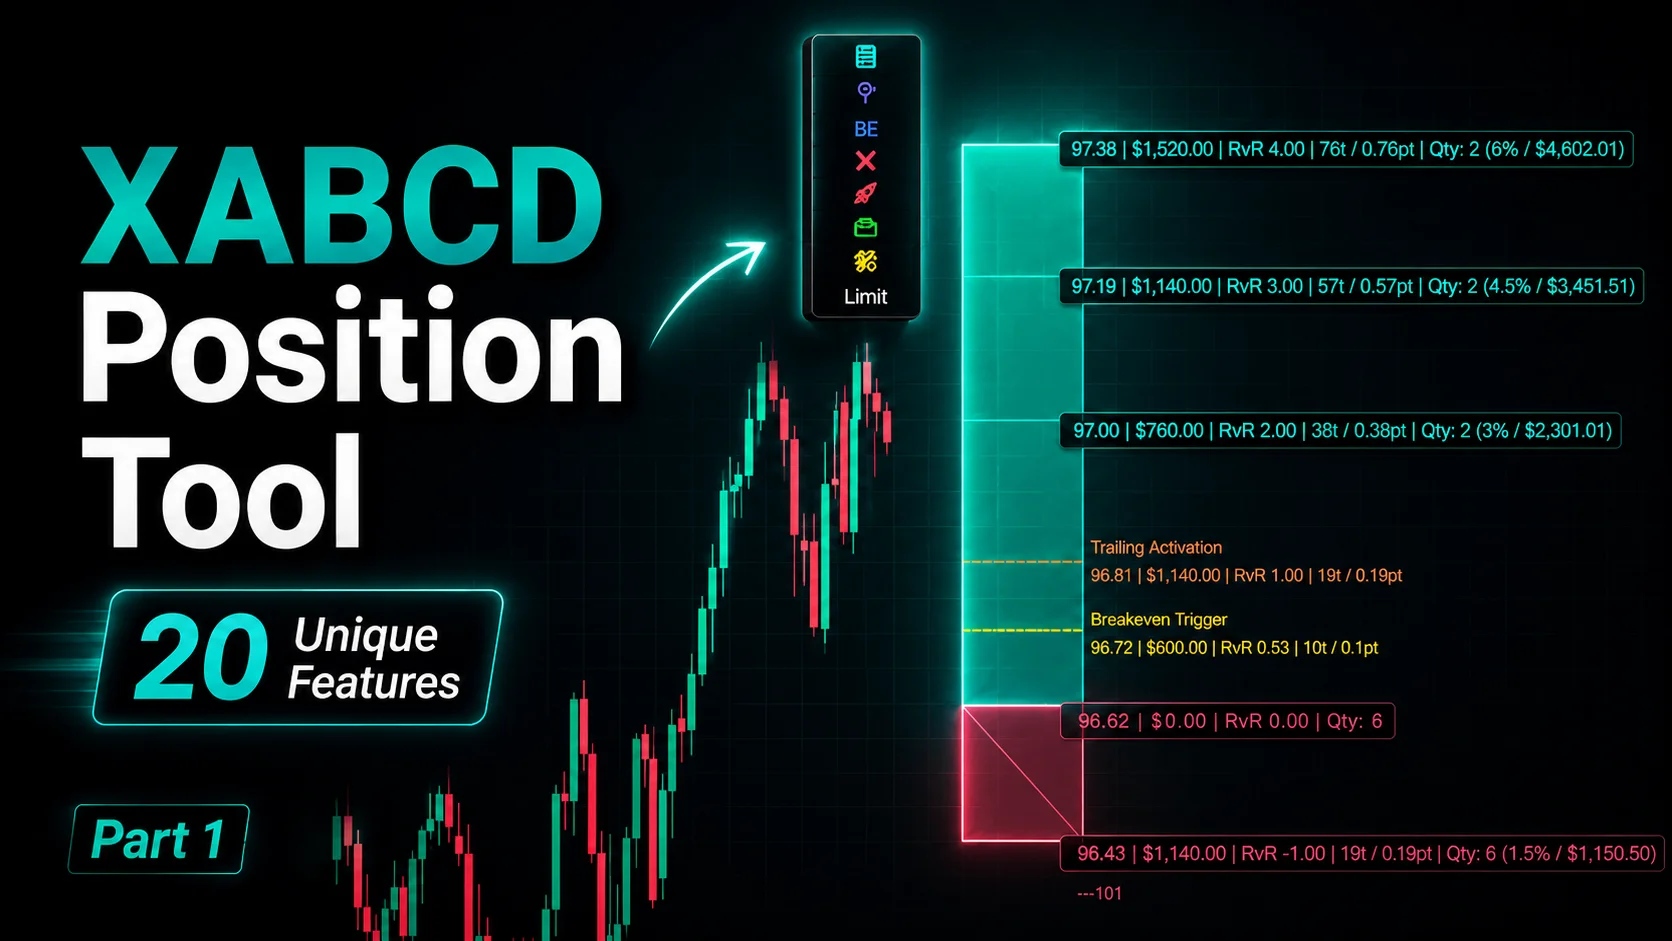
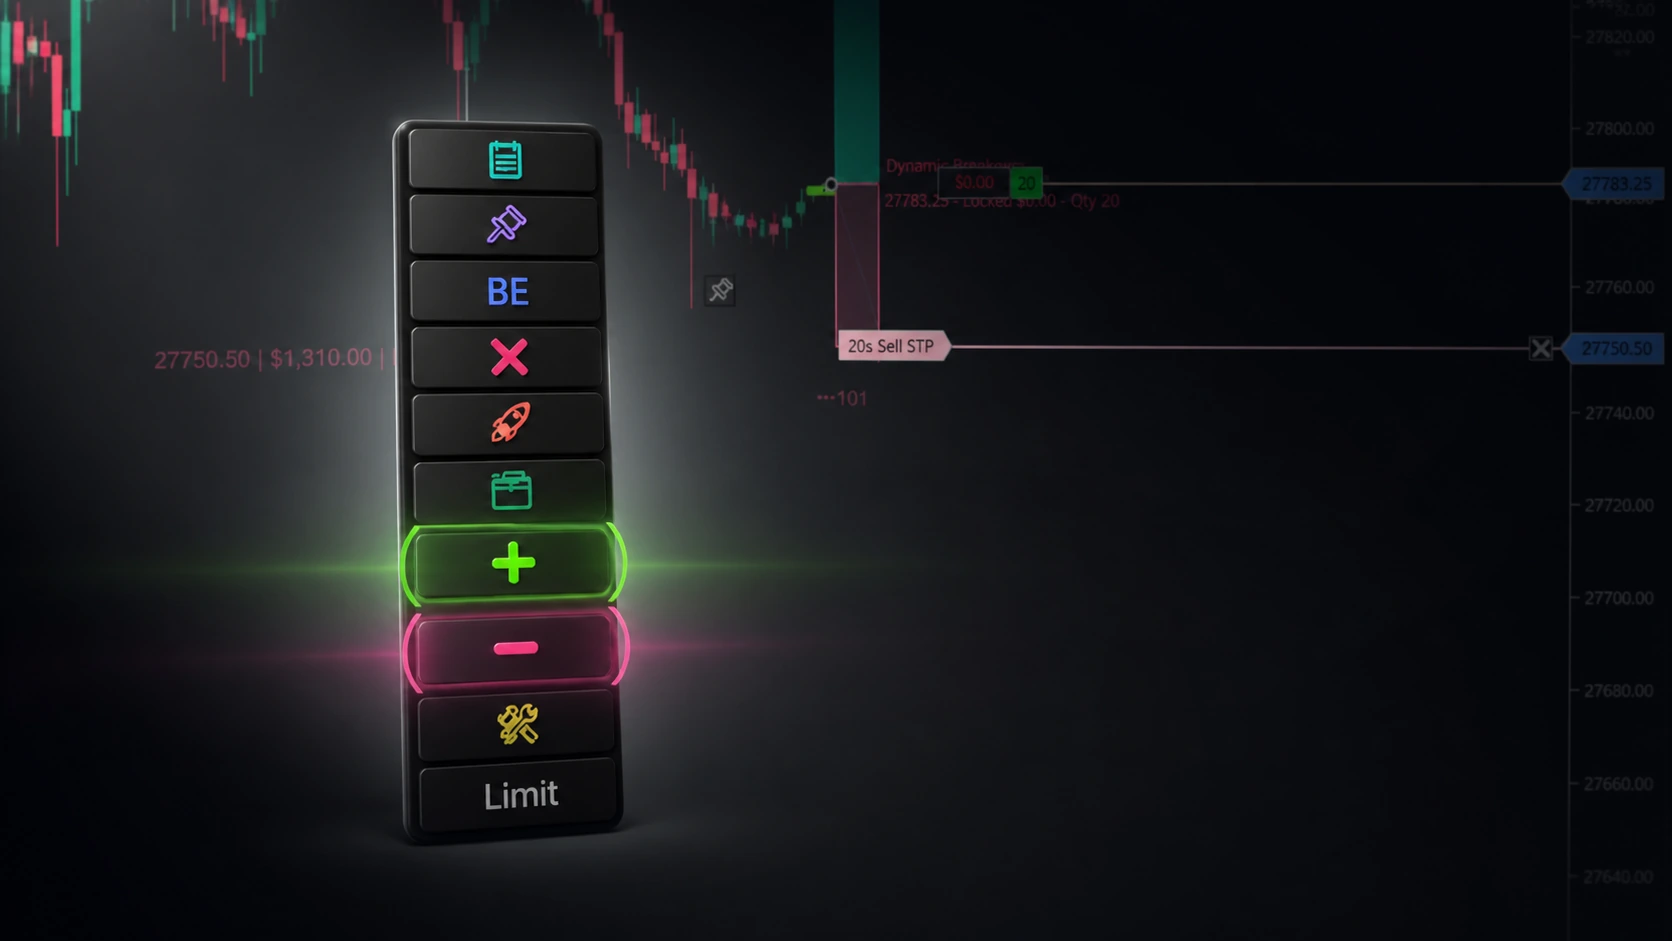
Patterns can help you allocate your risk capital more effectively. If you identify multiple valid patterns, you can distribute your risk capital among different trades rather than concentrating it all in one position. Our XABCD Position Sizing Indicator for NinjaTrader can help you manage all these positions and your over all risk.
- Defining Stop-Loss Levels: Patterns often have well-defined points where the pattern's validity is confirmed or invalidated. Placing stop-loss orders just beyond these critical levels can help limit potential losses if the trade doesn't go as anticipated.
- Volatility Consideration: Some patterns, such as triangles or wedges, can indicate decreasing volatility and potential breakout points. Adjusting your position size or stop-loss distance based on the expected breakout can help you adapt to market conditions and control risk.
- Pattern Failure Analysis: If a pattern fails to materialize as expected, it can indicate a potential change in market sentiment. Recognizing pattern failures early can prompt you to exit or adjust your trade, preventing larger losses.
- Reward-to-Risk Ratio: Patterns can provide insight into potential price targets based on their projected completion. By calculating the potential reward and comparing it to your chosen stop-loss distance, you can assess the reward-to-risk ratio before entering a trade.
- Confirmation from Multiple Patterns: If multiple patterns across different timeframes or correlated assets confirm a similar price action, it can reinforce the strength of a potential trade setup. This confirmation can give you more confidence in your risk management decisions.
- Adapting to Market Conditions: Different patterns are suitable for different market conditions (trending, ranging, volatile, etc.). Choosing the right pattern for the current market environment can help you tailor your risk management strategy accordingly.
- Avoiding Overtrading: Waiting for valid patterns before entering trades can help you avoid impulsive or emotional decisions. This disciplined approach can prevent you from taking unnecessary risks.
Common Mistakes to Avoid
Candlestick pattern trading presents a multifaceted challenge due to its reliance on interpreting price action within a confined timeframe. While these patterns offer insights into market sentiment, their interpretation can be subjective, as traders might perceive the same formation differently.
However, if you wish to mitigate subjectivity, we highly recommend steering clear of classical chart patterns such as dojis, flags, morning stars, or head and shoulders. Instead, focus solely on XABCD Patterns, which involve less subjectivity as they incorporate both price and time. This approach minimizes room for interpretation. This is why we also recommend printing out the candlestick patterns cheat sheet to be your guide right on your desk.
Overtrading: Recognizing and Preventing It
One of the best ways to prevent overtrading is by using an XABCD Pattern scanner which will take out a lot of the leg work for you. If you find your taking too many trades and find it difficult to mange them, this could be a sign that your suffering from overtrading. The use of a scanner can pre-filter the patterns too, reducing you workload and saving the best.
Misinterpreting Patterns: Learning from Errors
Creating these drawings manually can prove to be challenging and, furthermore, a rather monotonous task. Moreover, it opens the door to a plethora of potential human errors, underscoring the rationale behind our strong recommendation for the utilization of our XABCD Pattern Indicators. By doing so, you not only sidestep these difficulties effortlessly but also substantially minimize the likelihood of inaccuracies, ensuring a smoother and more reliable trading experience.
Candlestick Patterns in Different Markets
Forex, Stocks, Commodities, and Cryptocurrencies
Patterns are rooted in human emotions, and across all types of markets, individuals universally possess two eyes and a nose. Regardless of the market they are engaged in, the emotions evoked remain consistent. This presents a substantial advantage since, in the context of our XABCD Patterns, the approach remains consistent irrespective of whether one engages with a tick chart or a time chart. Each trade is executed in an identical manner.
Conclusion
Recap of Key Takeaways
In the trading realm, candlestick patterns are like handy tools that help us gauge market sentiment and potential price shifts. But with all these patterns around, it's key to zoom in on what really matters. That's where the XABCD patterns come in, standing out for their smart blend of time and price factors. These patterns cut through the noise, using both human emotion and real market dynamics. So, while there's a whole array of candlestick patterns out there, focusing on the XABCD ones that sync time and price could be your winning move for a smoother trading journey—whether you're new to the game or a seasoned pro.
Next Steps in Trading Patterns
Alright, so you've got the basics down for trading with XABCD patterns. Now, let's talk about what's next on the learning journey. You should definitely check out the YouTube channel youtube.com/@xabcdtrading. They've got some seriously cool stuff that can help you step up your game.
Start off by watching their video tutorials. They break down real examples of XABCD patterns in action. It's like pattern spotting in the wild, and it'll give you a solid feel for how these things play out in different markets and timeframes. They walk you through when to get in and when to get out, plus they dive into the psychology behind each pattern.
Oh, and if you're into using charting tools and software (who isn't?), they might have tutorials on that too. Learning how to spot these patterns faster can seriously save you some precious time when the markets are moving quick.
Here's the deal: don't just watch the videos and call it a day. Roll up your sleeves and practice what you learn. Grab some historical charts and start hunting for those XABCD patterns like a pro. The more you do it, the better you'll get.
And hey, don't be shy about joining the trading community around the channel. Drop your questions, share your insights, and learn from others who are on the same journey. It's like having a bunch of trading buddies who've got your back.
New NinjaTrader Articles Delivered First

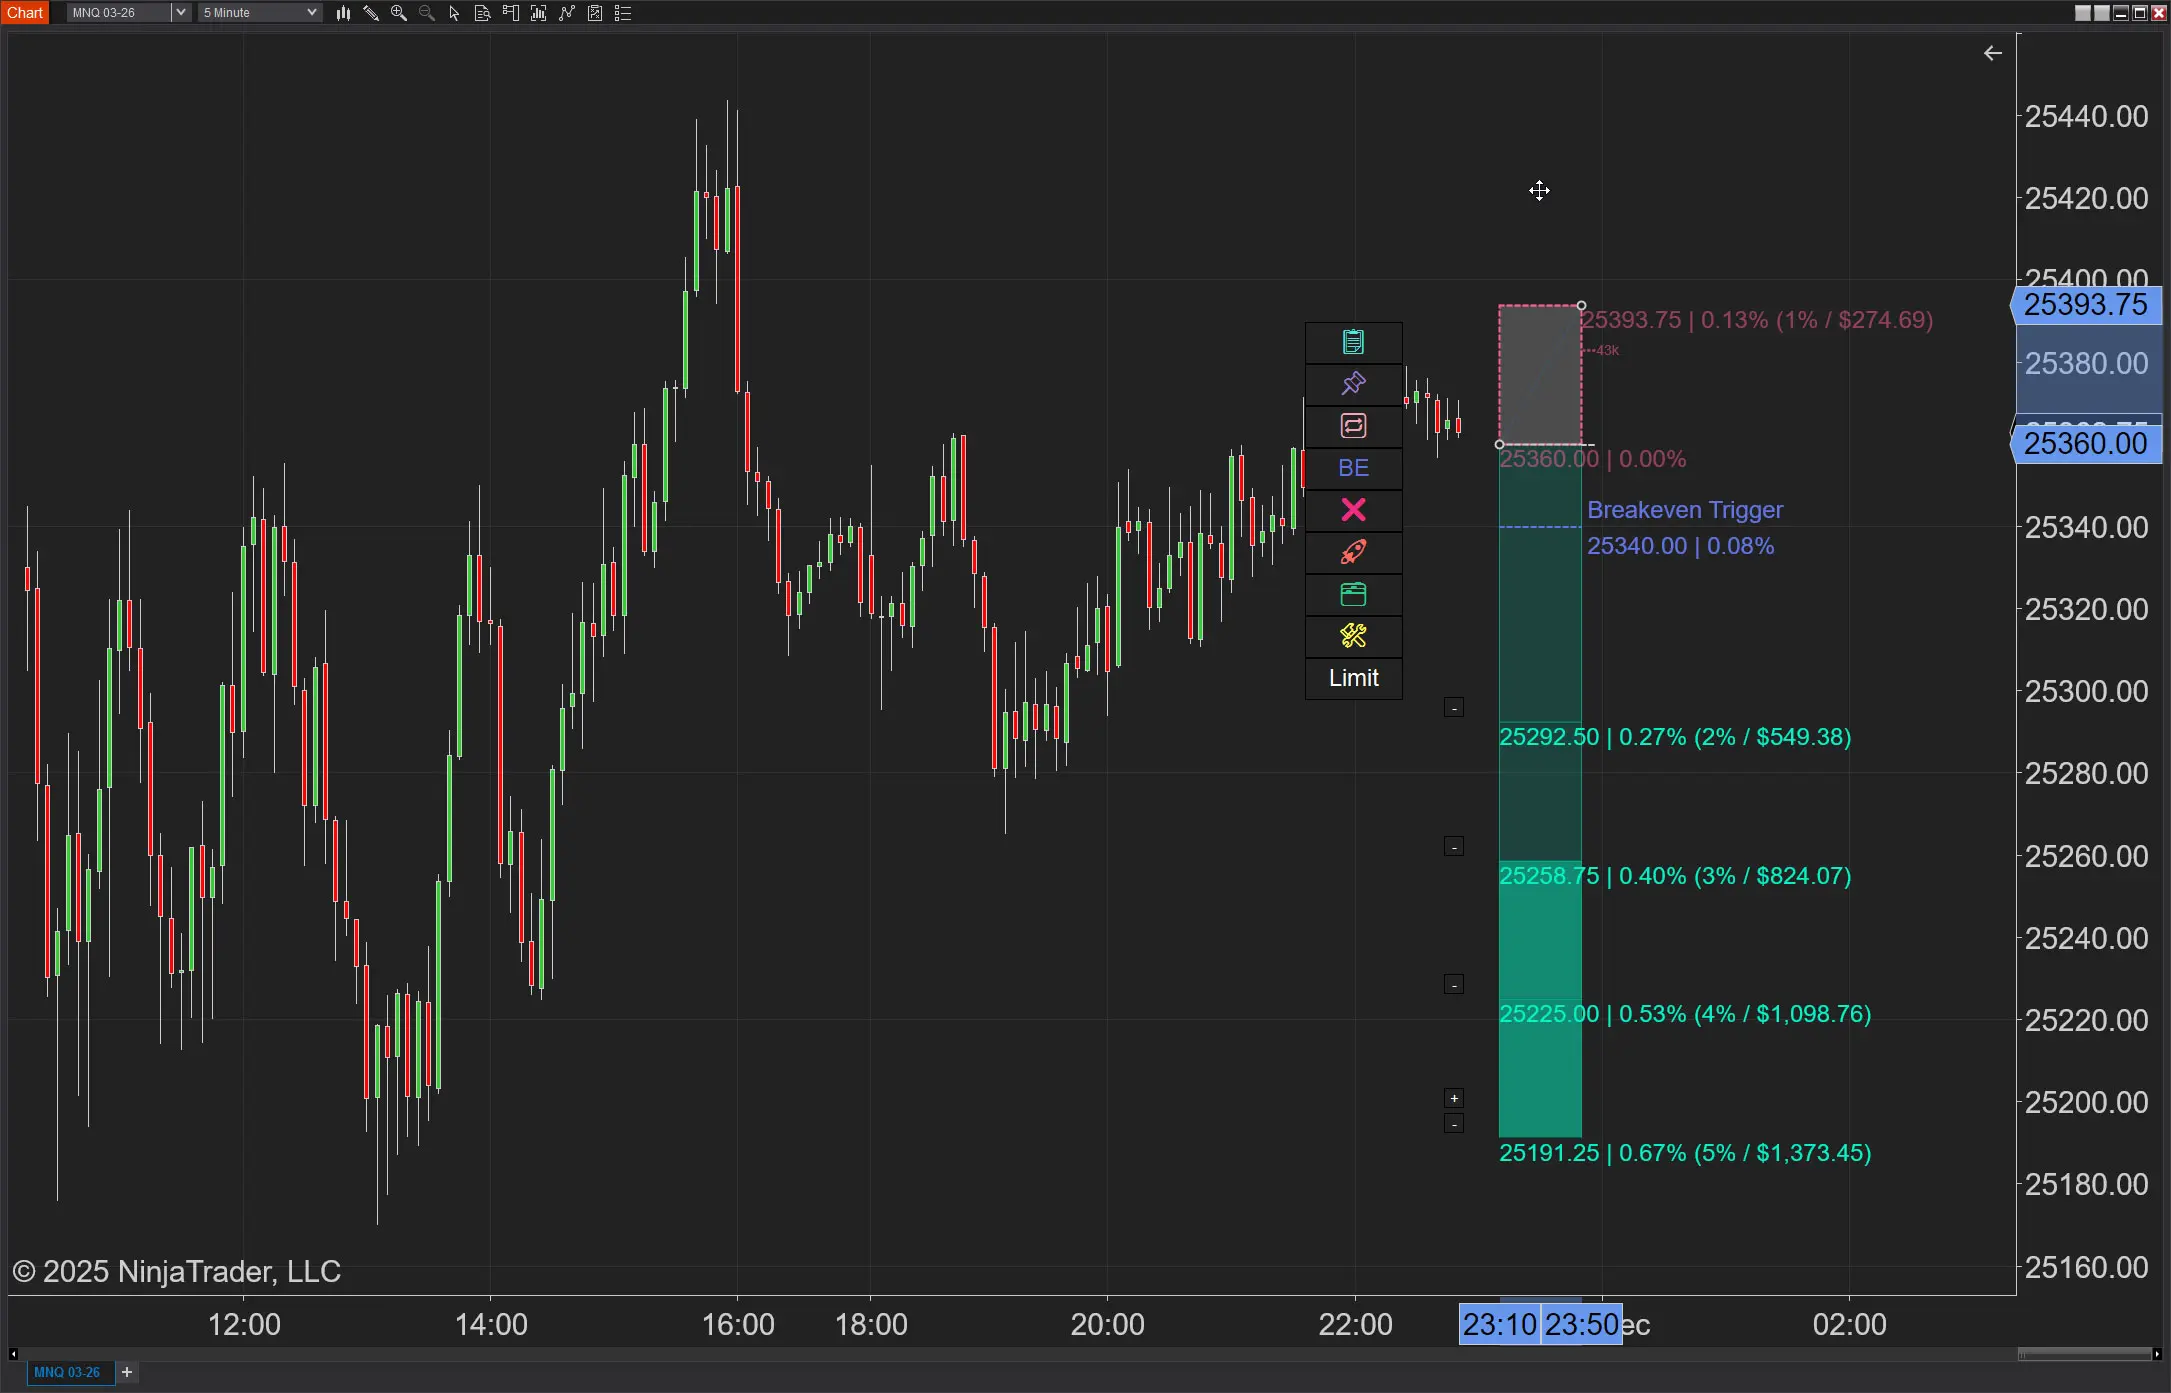
Easy Order Tool
The Strategy
Scanning & Alerting
NinjaTrader Release
XABCD News (Free Version)
XABCD News (Community Edition) is the best free Indicator for NinjaTrader 8. Don't let news sneak up on you again. Puts economic news events on your charts so you can stay informed and move around positions/stops before the news is released. Works in any market.
XABCD Priceline (Free)
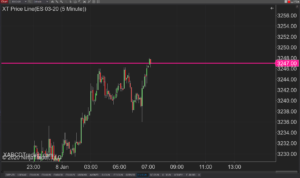
XABCD Price Line tool for NinjaTrader 8 will draw a line at current price and move every time the market changes price. This is useful because it will allow you to easily identify where price is at all times and the exact quoted price.
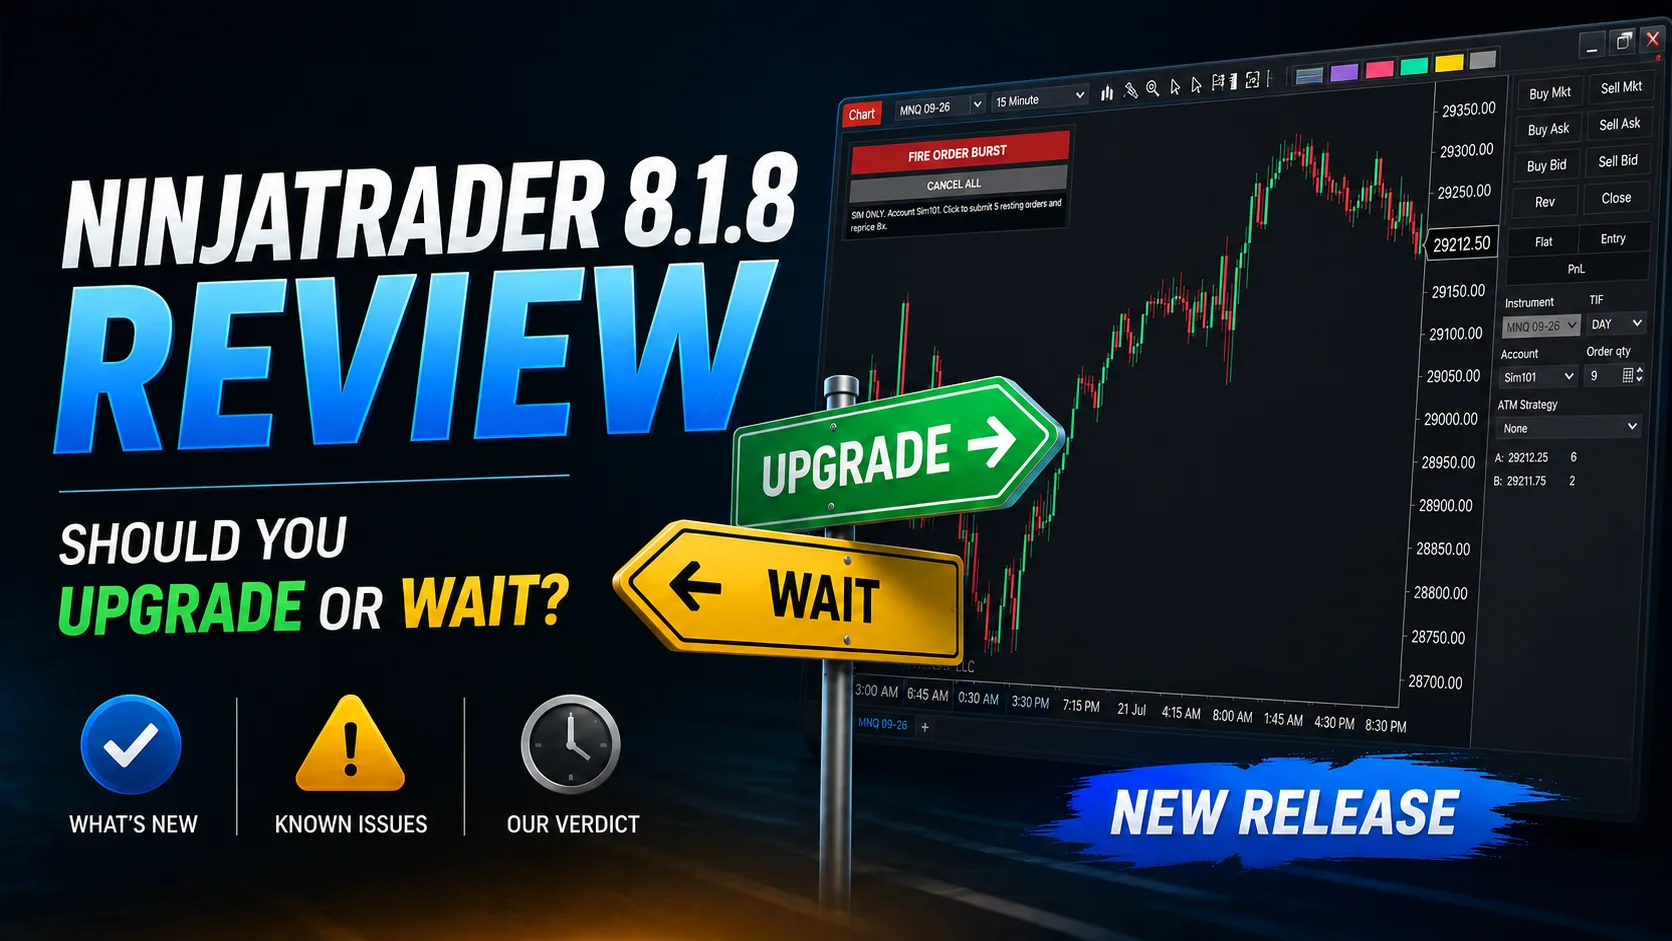
NinjaTrader 8.1.8 Review: Should You Upgrade or Wait?
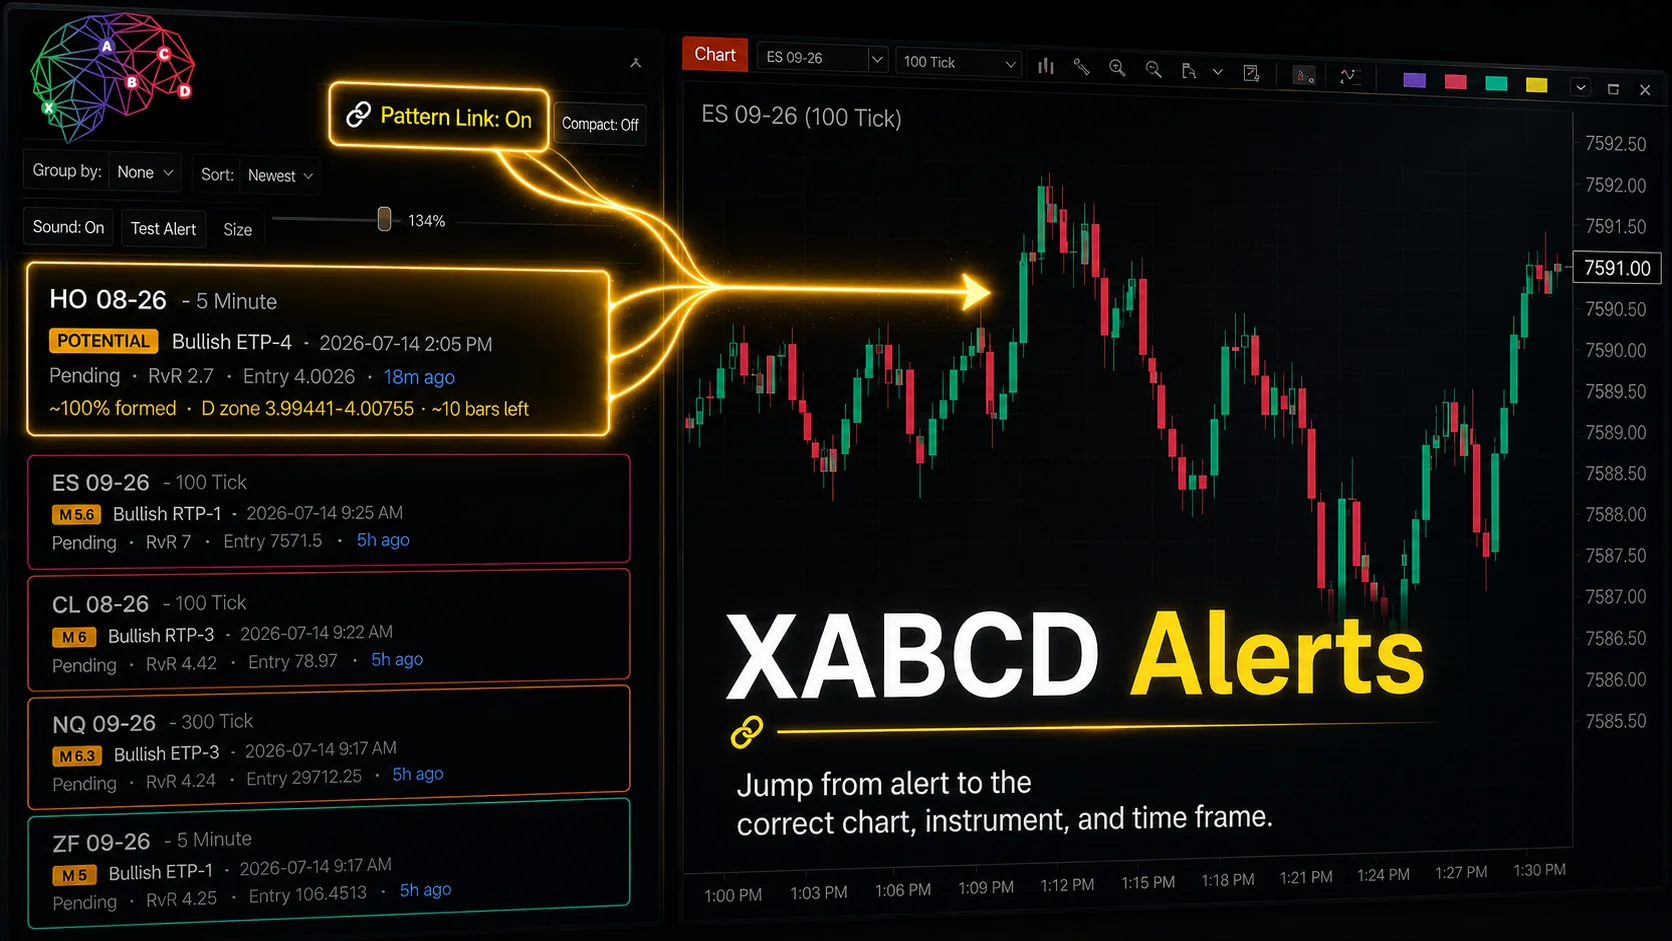
XABCD Pattern Alerts: The Complete Guide for Traders
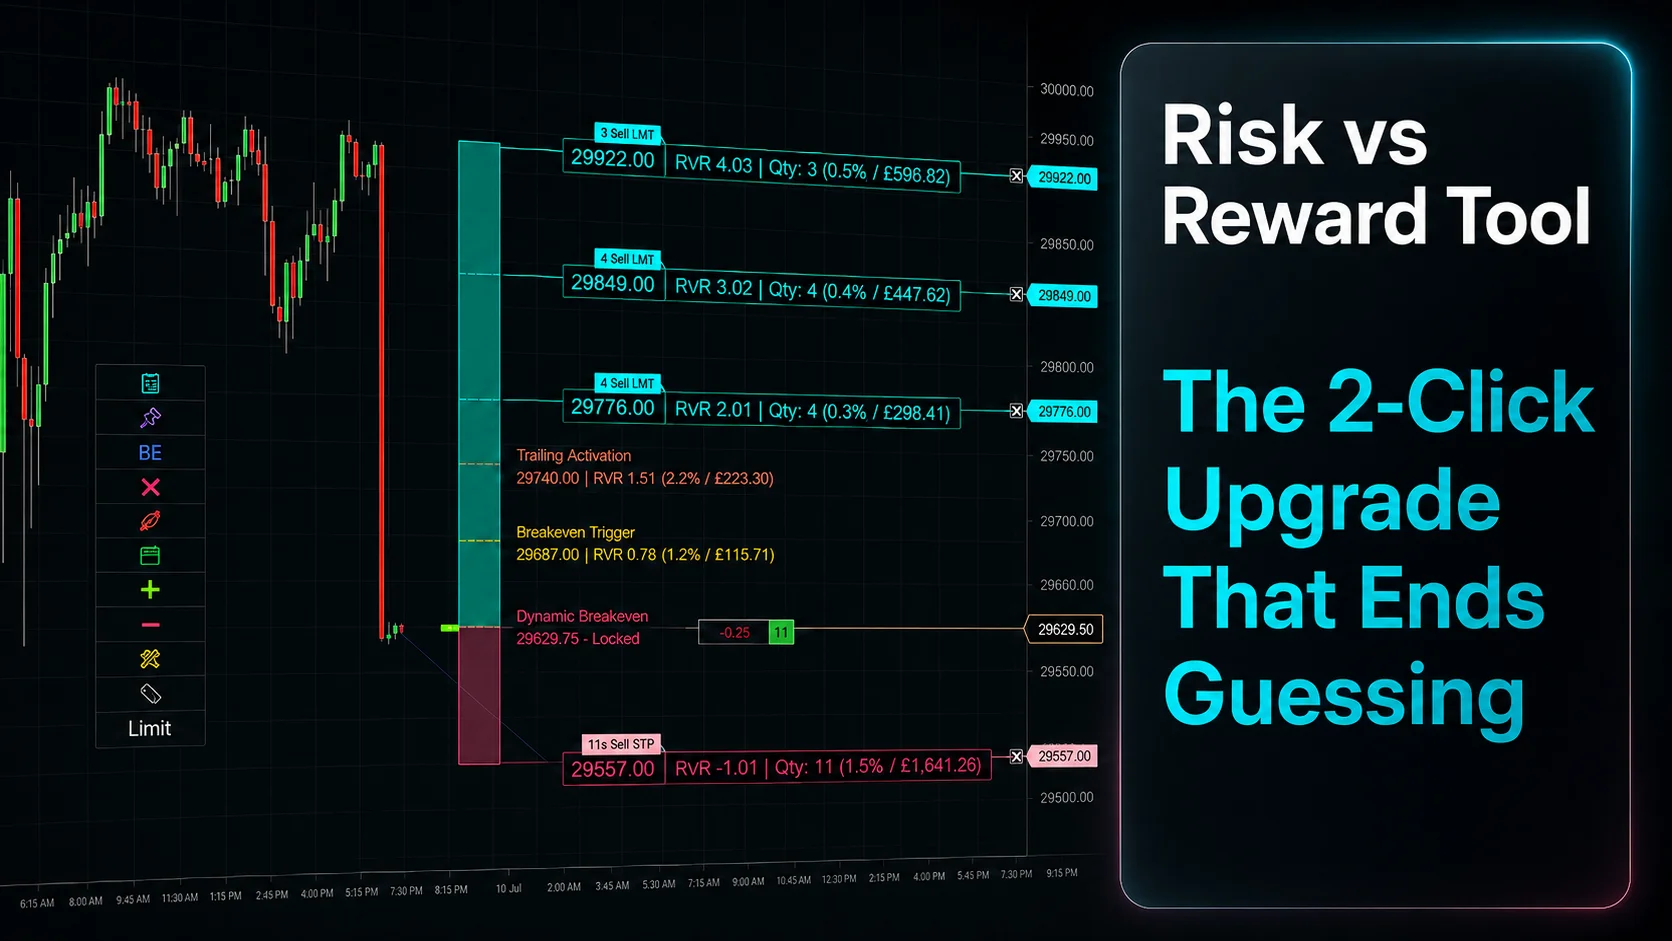
Risk vs Reward Tool: The 2-Click Upgrade That Ends Guessing
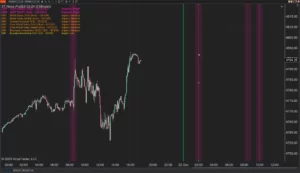
NinjaTrader Faster Last Price Updates on Charts Explained
NinjaTrader 8 Hotkeys: Best Shortcuts for Faster Trading
NinjaTrader Position Sizing Tool: 64 Features Stock NT8 Does Not Include
NinjaTrader – Adding to Position: A Field Guide for Active Traders
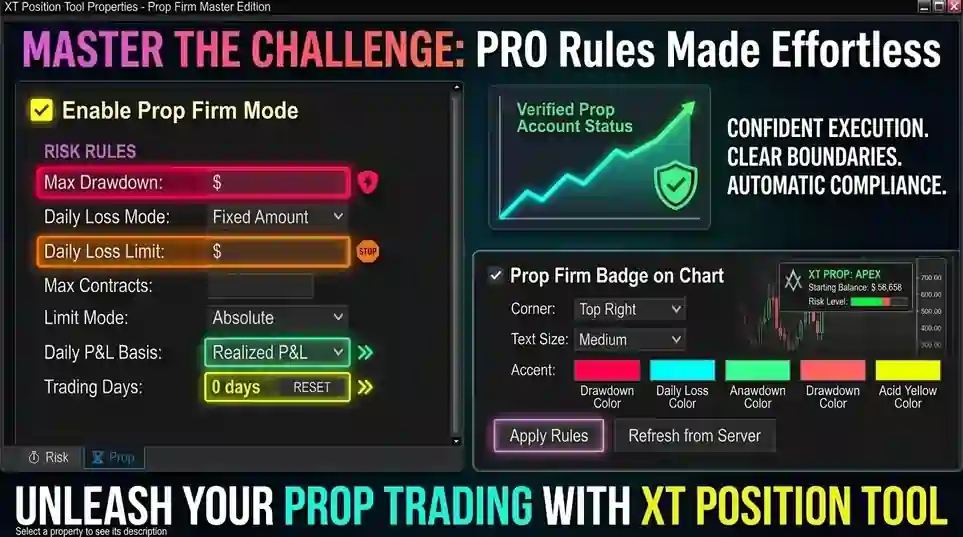
NinjaTrader Prop: The Ultimate Guide to Prop Firm Trading
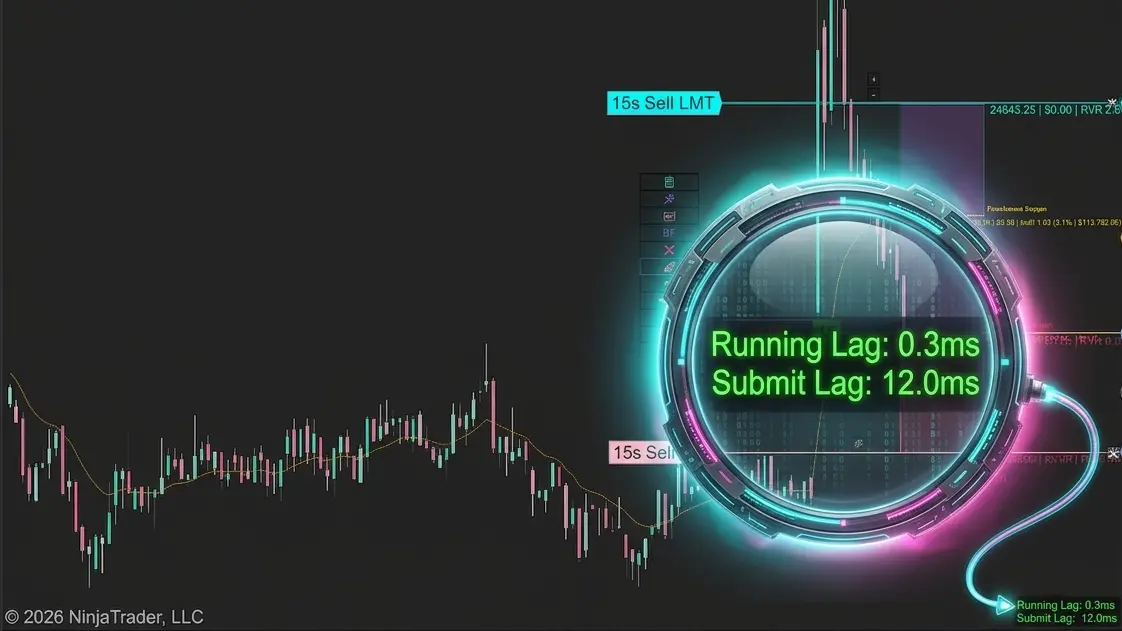
Does the XABCD Position Tool Lag?