XABCD TRADING
What is the correlation between stocks, futures and currency markets?
Subscribe
to get alerts to our next blog post!
The Three Main Correlation Relationships
Correlation between different markets is something that everyone seems to have their own opinion. We’re going to make a few generalizations that is common between the majority of traders.
- Metals and the Australian markets/dollar can show a relationship between each other.
- Oil and the Canadian markets/dollar can show a relationship because of the huge oil exports Canada has with their natural resources.
- JPY Currency can have a tight relationship with the Dax30, Nikkei and the SP500 indices
- DX (US Dollar) correlation between it and the short term interest rates (6 month t-bills etc) can also follow the dollar has an importance influence on the direction of interest rates.
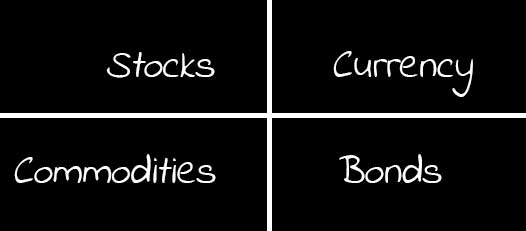
Differences Between Major Markets
Equity Markets
These are effected by anything really day to day both locally and globally and are more sensitive when compared to other markets.
Commodity Markets
Future markets: are usually flowing in a more predictive cycle based off how much supply or demand there is in the market.
Currency Markets
Currency markets: are effected by the strength or weakness of the currency its paired against. You can have the USD go up even if every other pair is showing a week dollar which all depends on the strength/weakness of the other pair.
The “Big Mistake” People Make
Assuming Price Movement
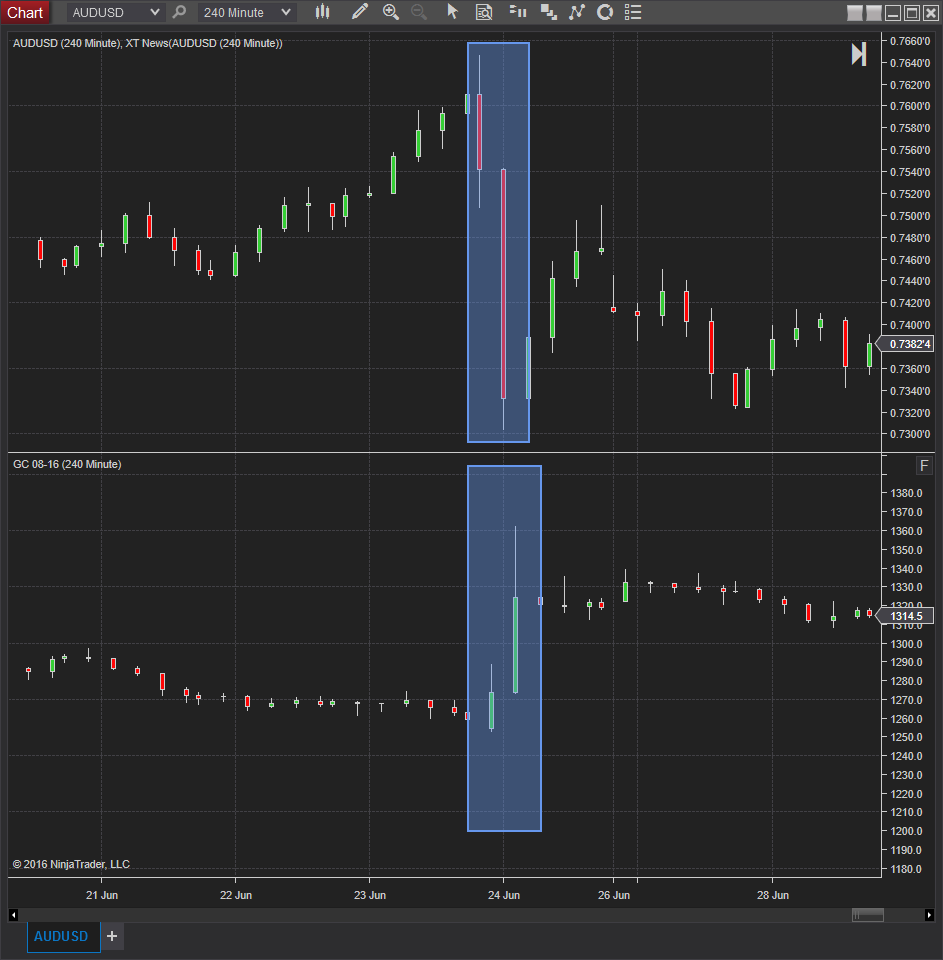
Just because when commodities go up, and the correlation between AUD tends to move up doesn’t mean you should be placing trades on that theory alone. It’s quite possible the commodities could go up and the AUD could go down and take out your position before it starts to move up in a similar direction. To see visually what we mean, all you need to do is overlay your charts on top of one another.
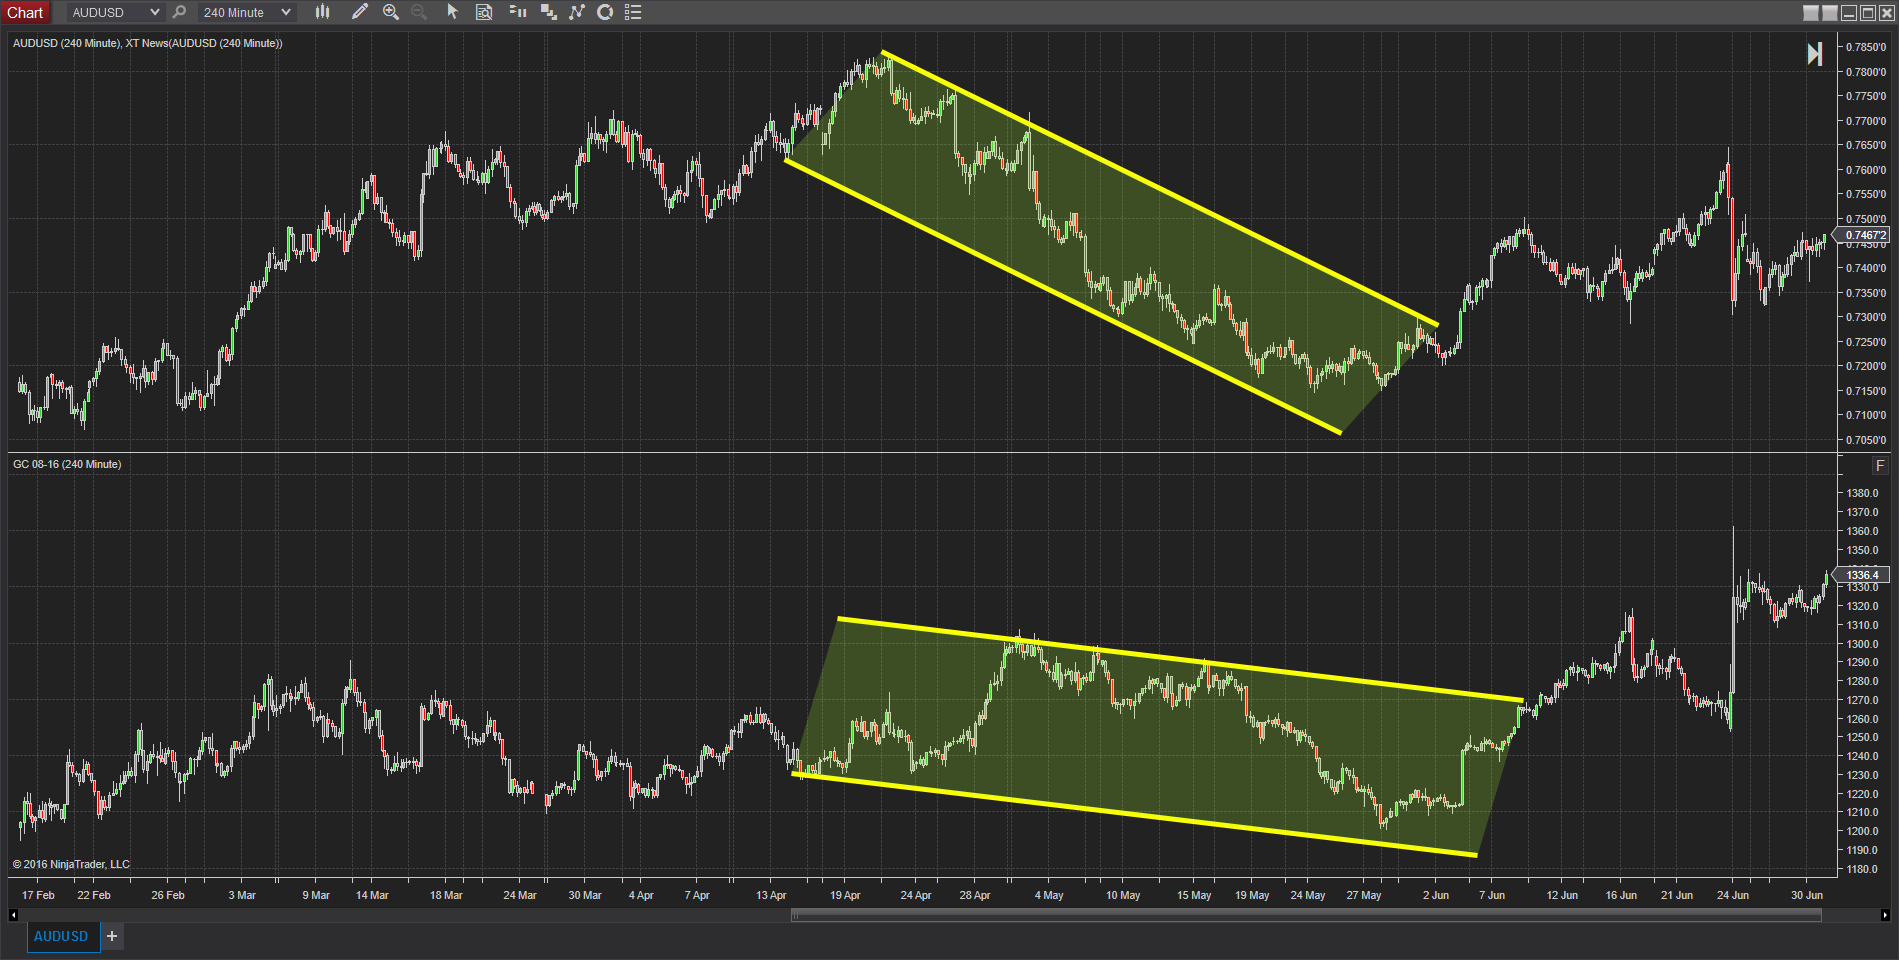
See looking at the same period of time visually you can see some very different results on the price that each instrument starts and where each one finishes. Trading these assuming price of the aud will move with the metals will not hold true BUT you can see the charts generally look like there is some relationship between them.
News Reations
Price does not have to react to news in the same way between the AUD currency pairs in this example. You can see the AUD went down even though Gold went up. This is not the norm but it can happen which is why we have to be careful not to assume because one instrument moves the other has to follow.
Are You Ignoring Correlation Between Markets?
I would highly recommend that in addition to your normal technical analysis that you look at these other markets to give you a whole new perspective and greater information about what is pushing a market around.
Where Does That Leave Us?
No markets move by themselves, but at the same time, there is no clear relationship where you could actively take trades and know what will happen because of what the other instrument did. It can be used as a guide but it shouldn’t be used as the only way your trading. Also different periods can have an impact on correlation between different markets.
About the Author
[cs_the_grid name=”Blog Posts”]
New NinjaTrader Articles Delivered First

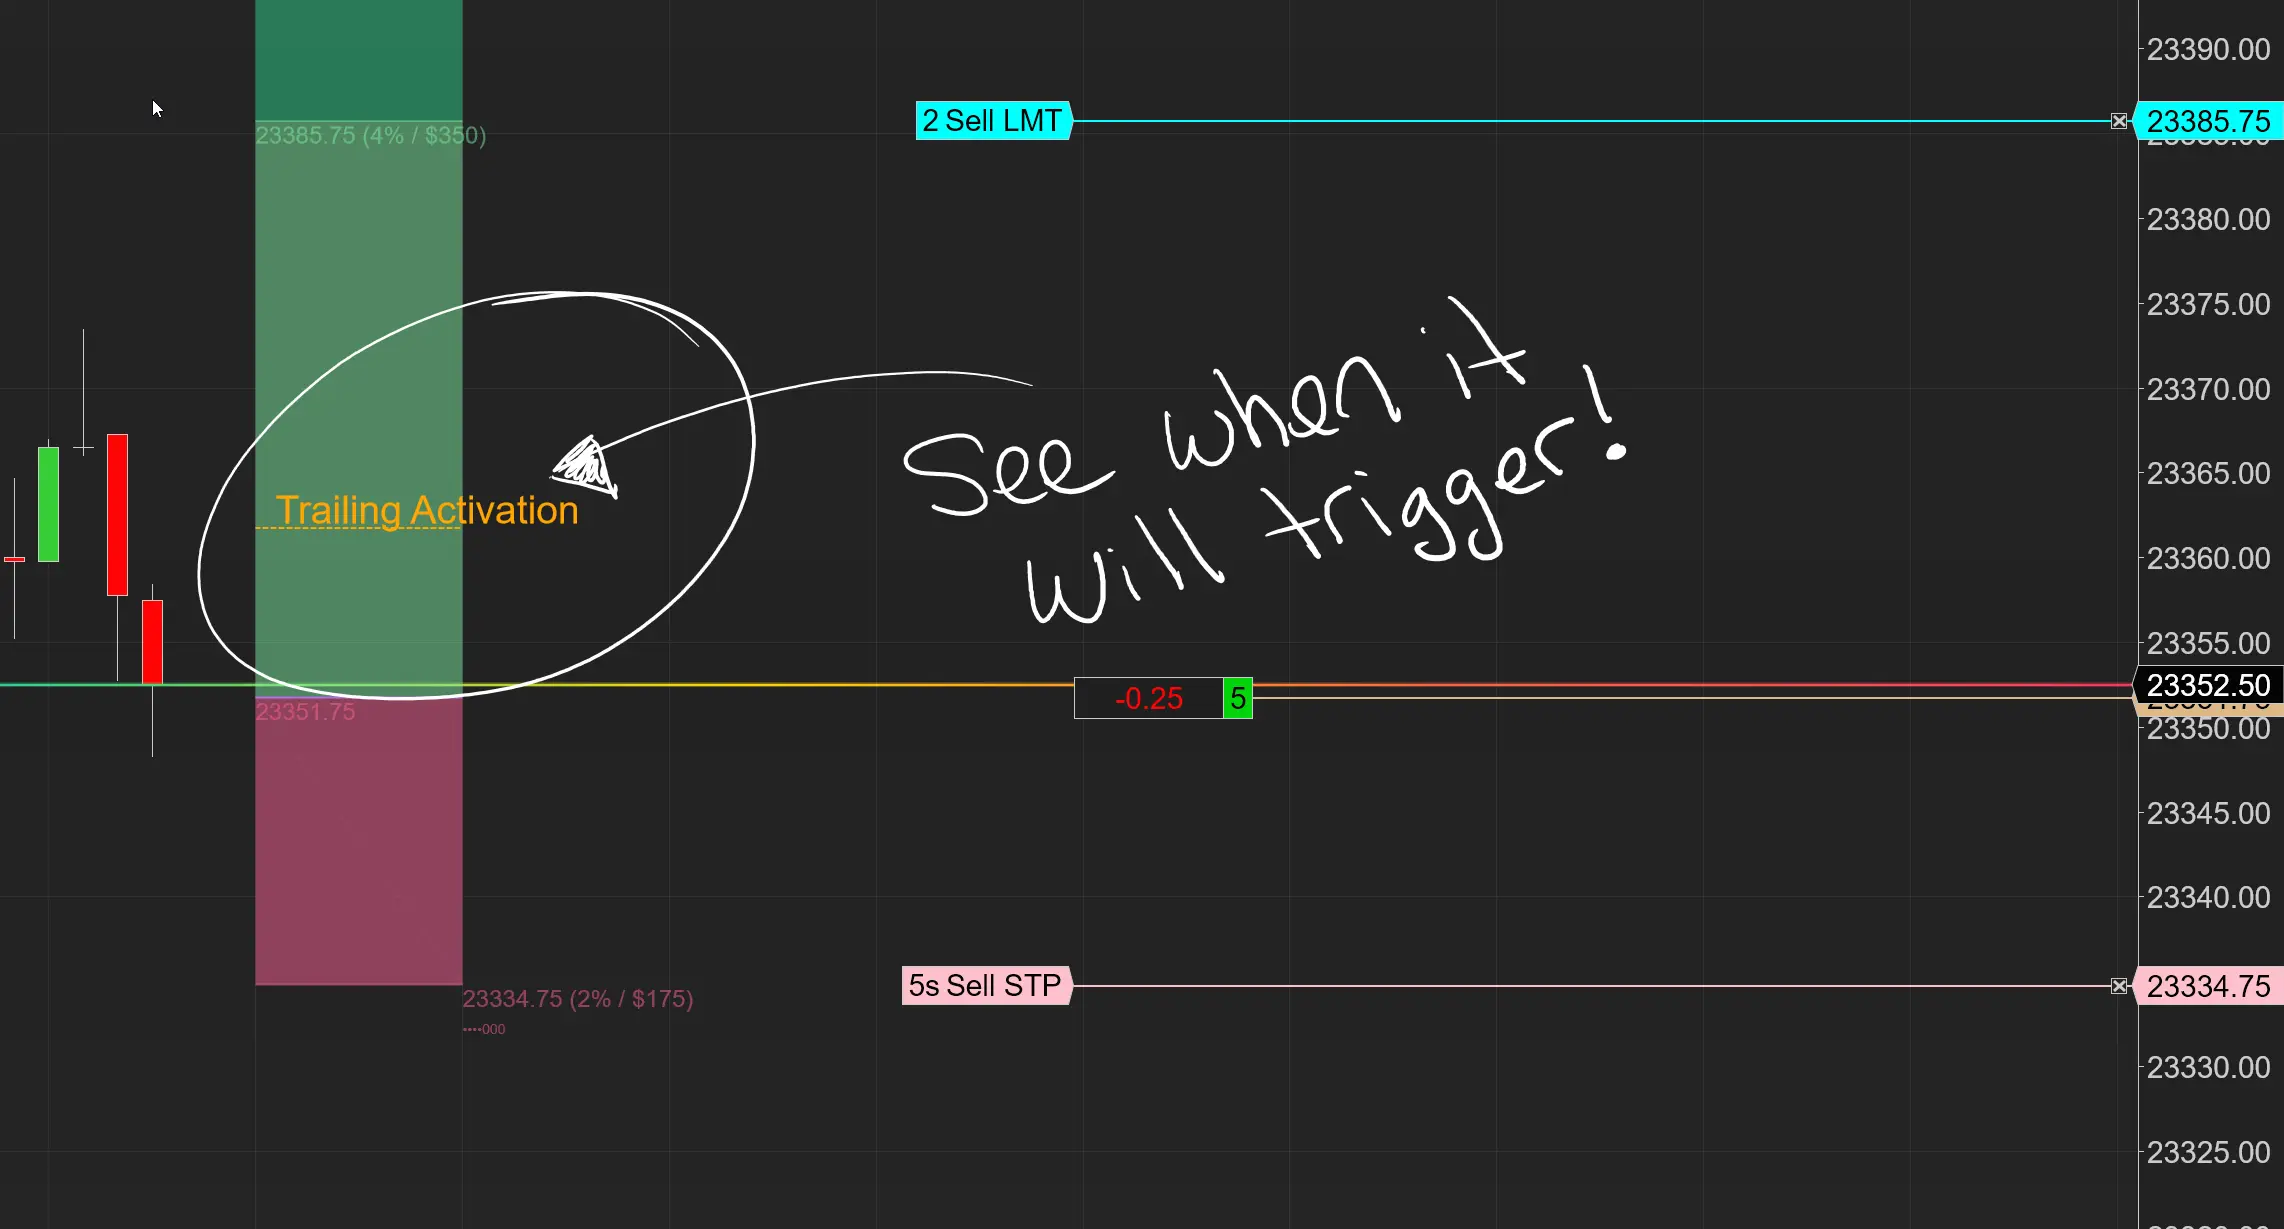
Easy Order Tool
The Strategy

Scanning & Alerting

NinjaTrader Release
XABCD News (Free Version)
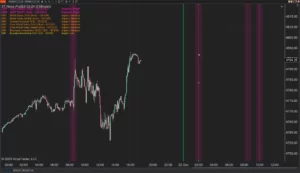
XABCD News (Community Edition) is the best free Indicator for NinjaTrader 8. Don't let news sneak up on you again. Puts economic news events on your charts so you can stay informed and move around positions/stops before the news is released. Works in any market.
XABCD Priceline (Free)
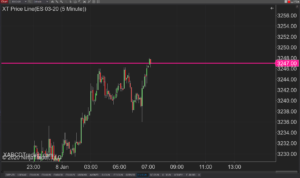
XABCD Price Line tool for NinjaTrader 8 will draw a line at current price and move every time the market changes price. This is useful because it will allow you to easily identify where price is at all times and the exact quoted price.
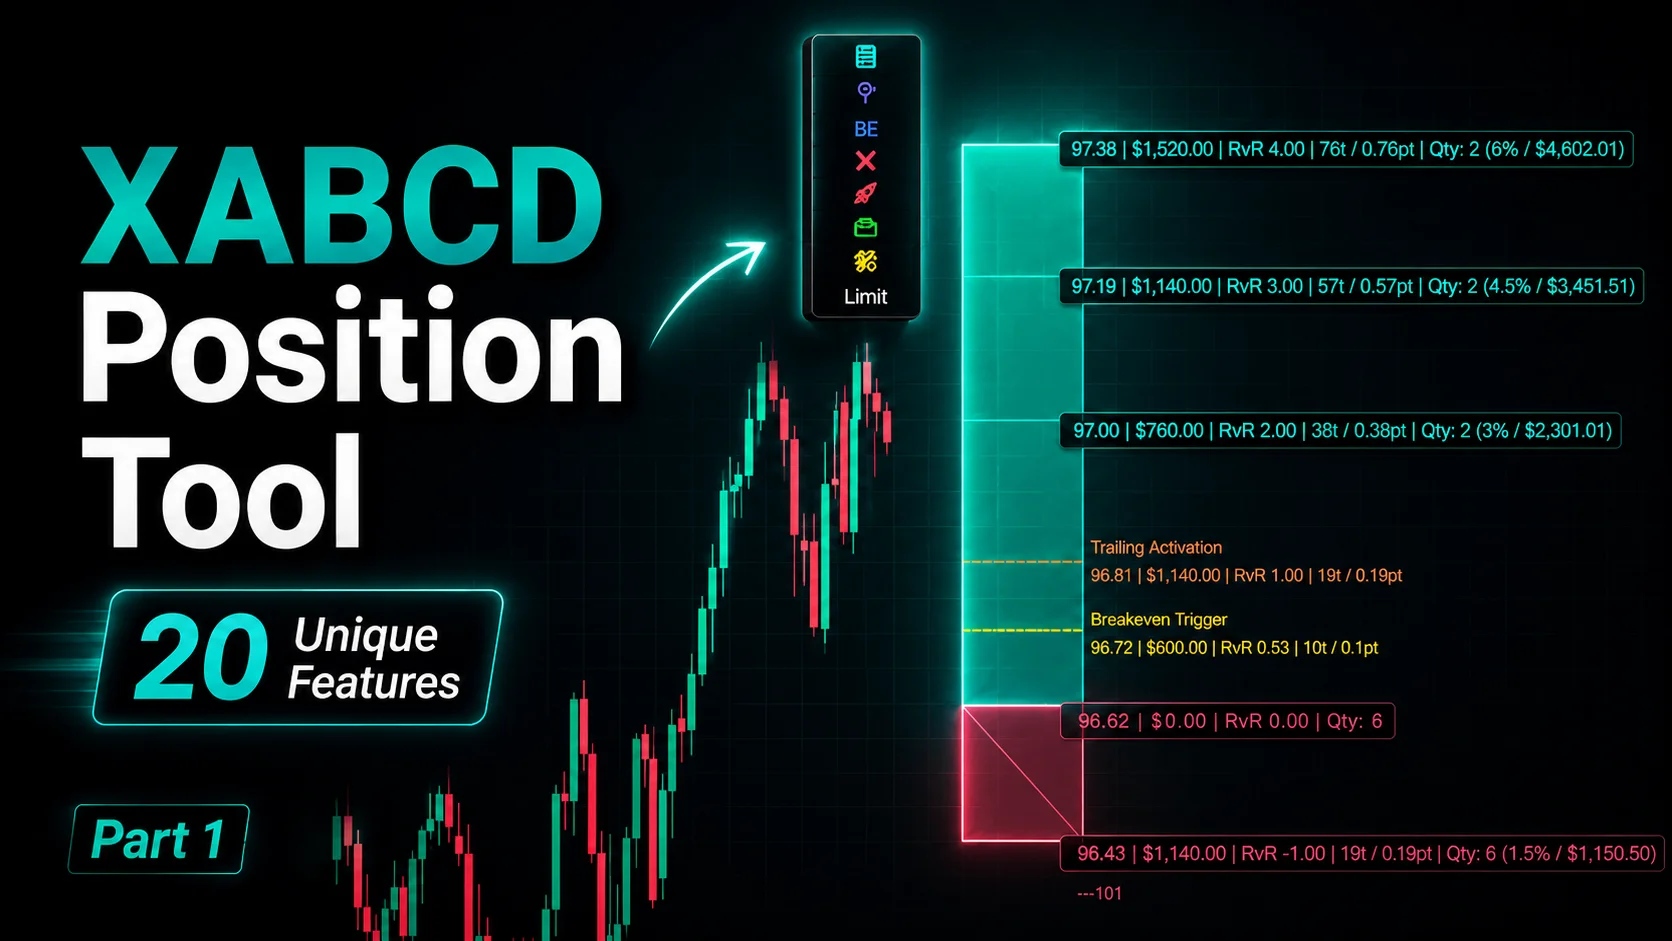
NinjaTrader Position Sizing Tool: 64 Features Stock NT8 Does Not Include
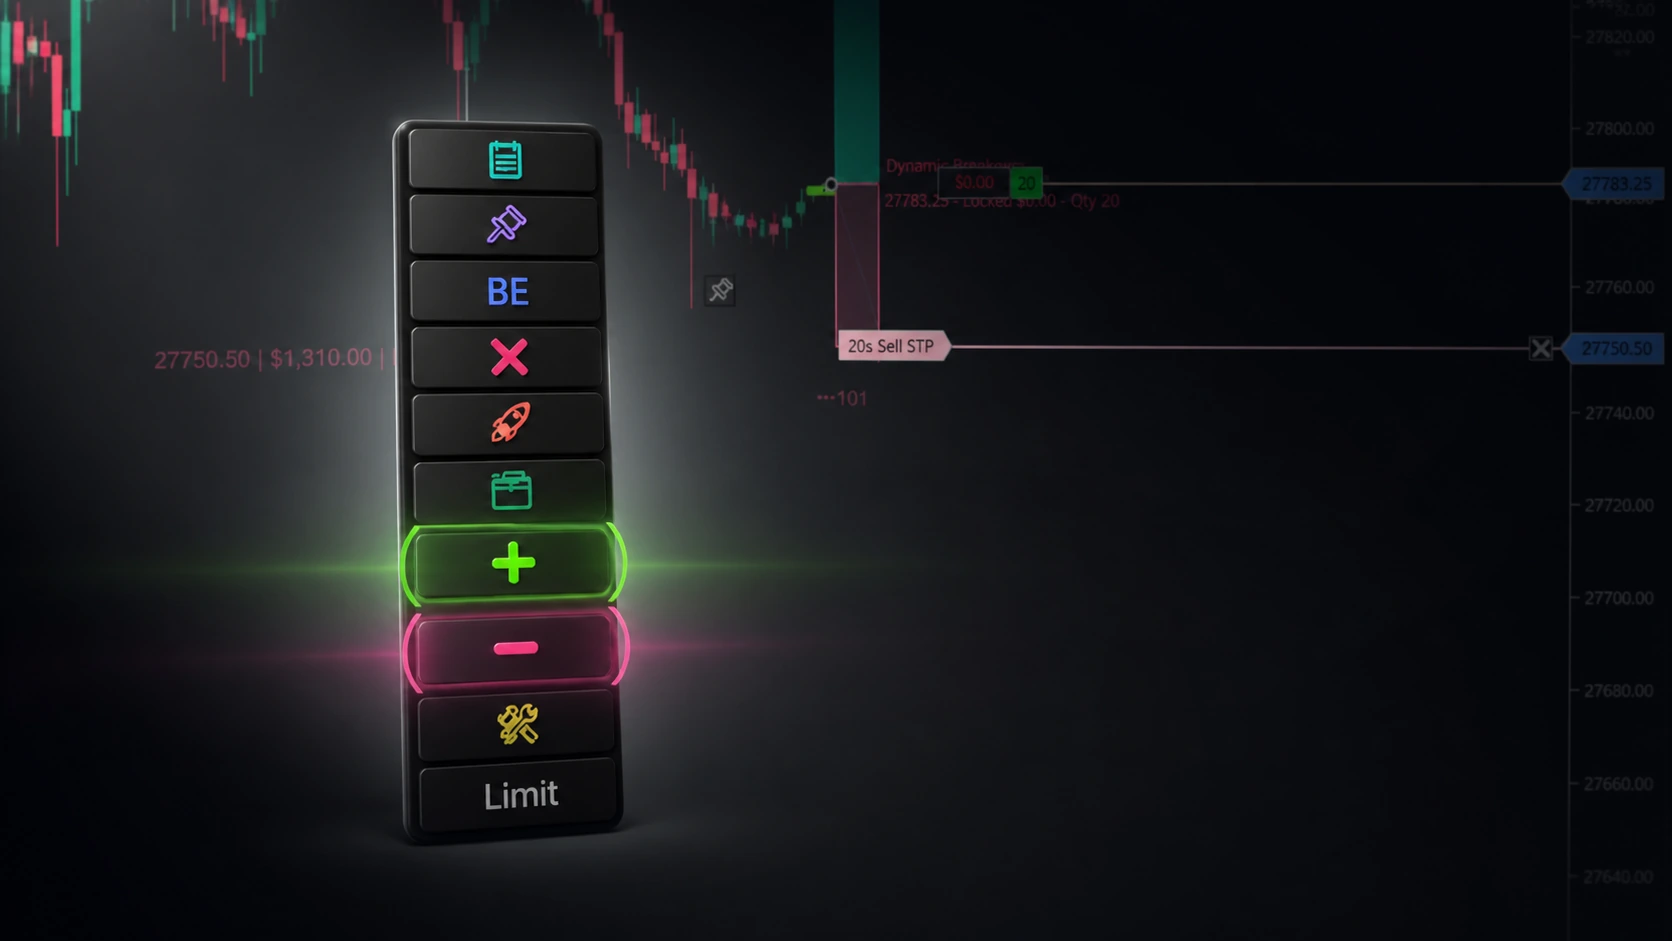
NinjaTrader – Adding to Position: A Field Guide for Active Traders
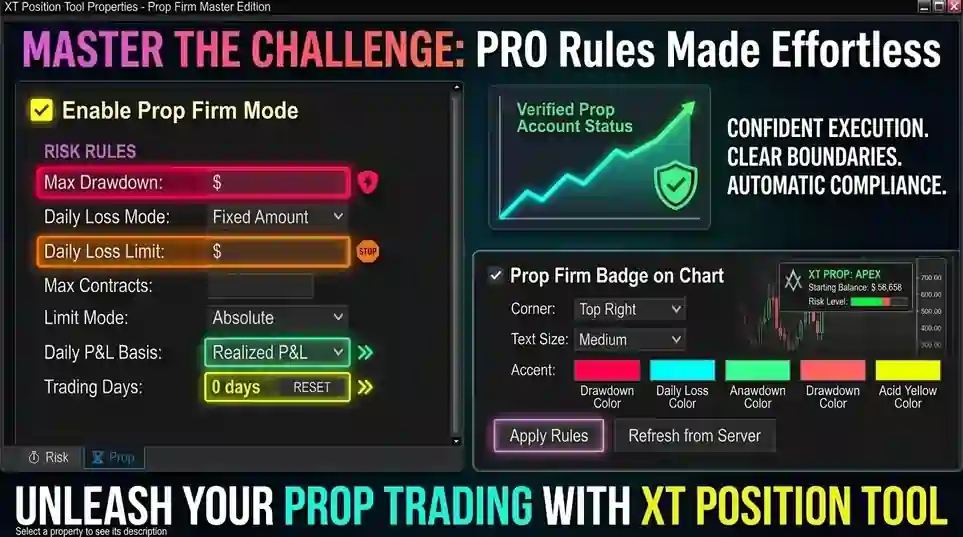
NinjaTrader Prop: The Ultimate Guide to Prop Firm Trading
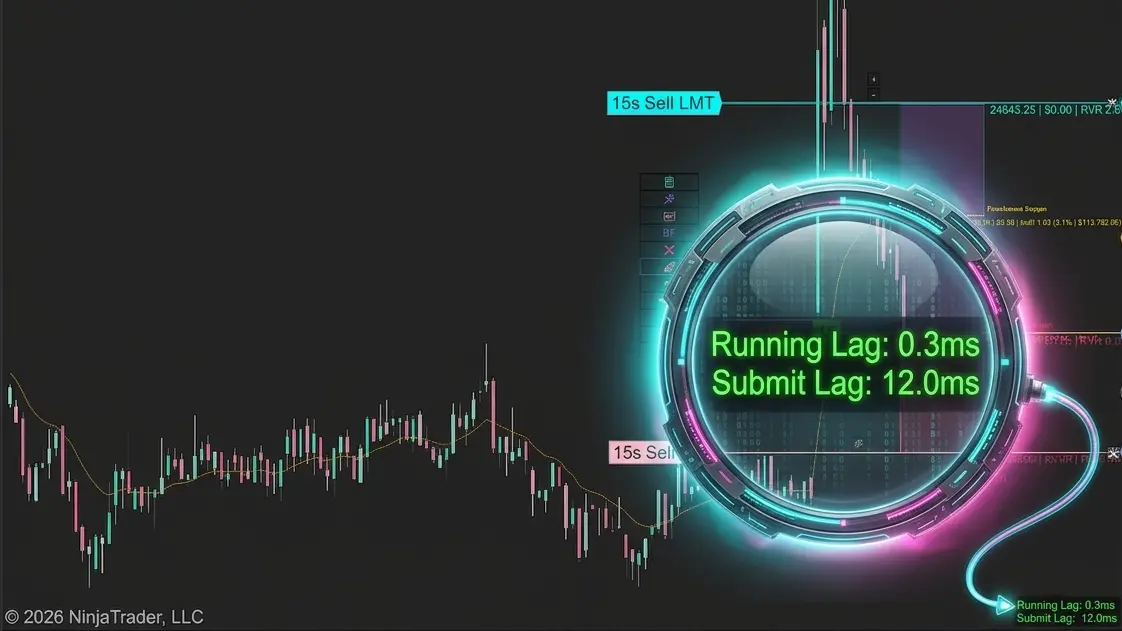
Does the XABCD Position Tool Lag?
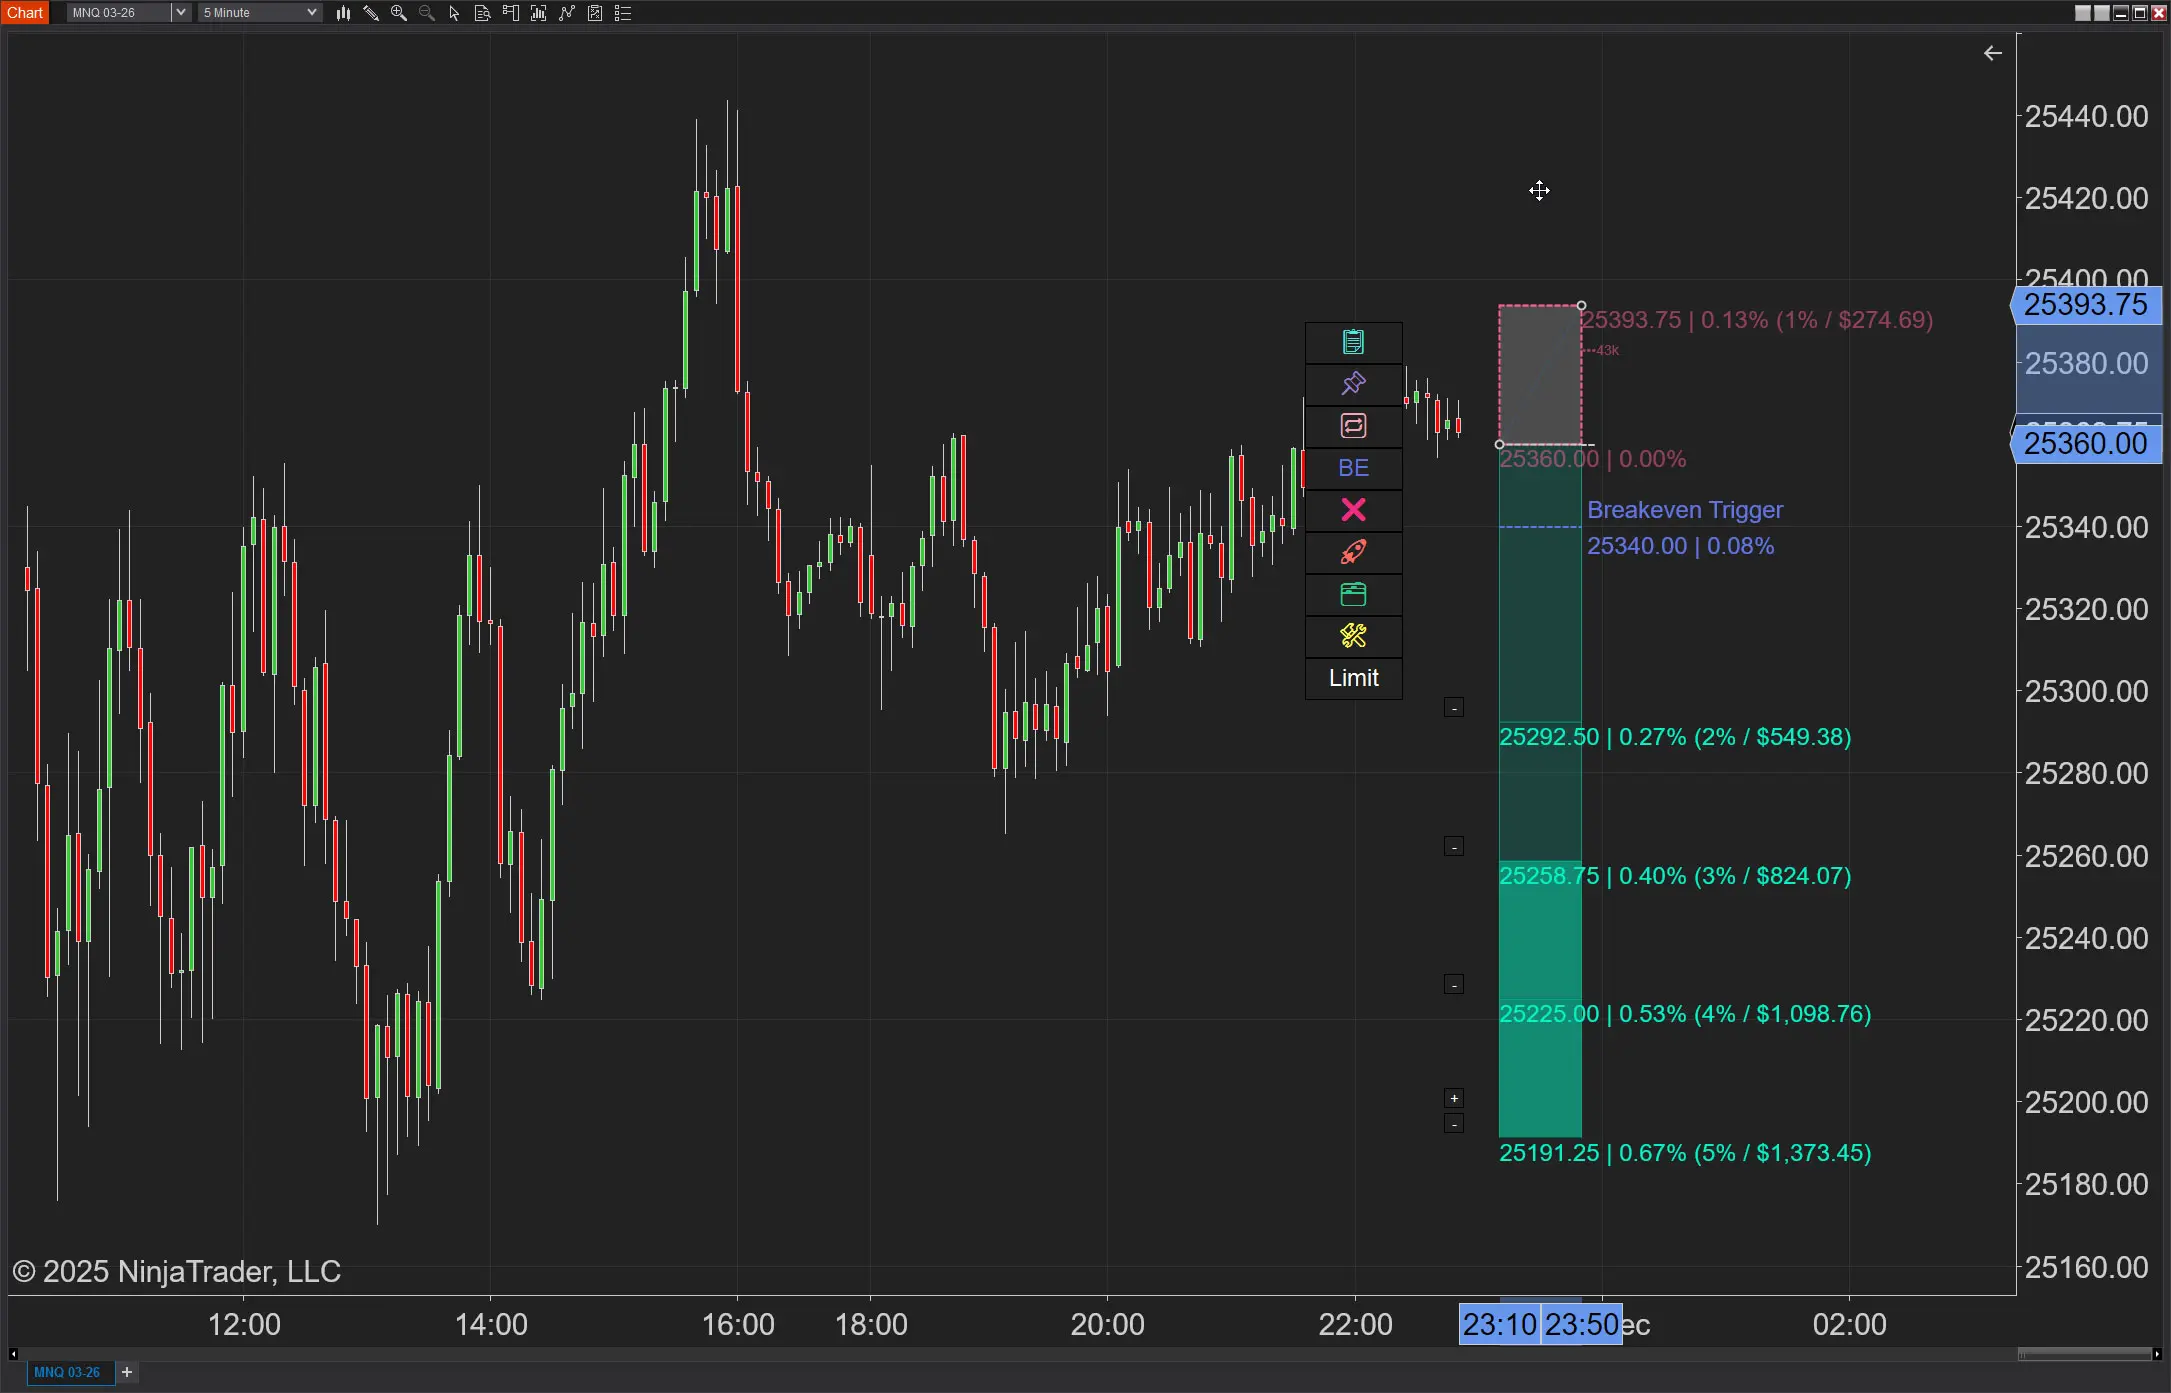
NinjaTrader Position Sizing: What the XABCD Position Tool Can Do That ATM’s Can’t
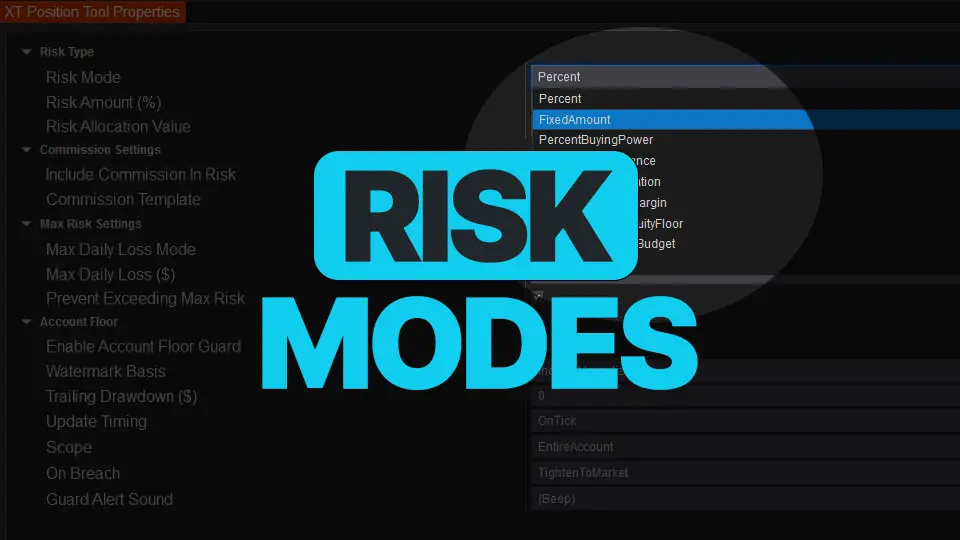
NinjaTrader Risk Management That Actually Moves the Needle
NinjaTrader 8.1.6 — The “No Fluff” Tour (Speed, Clarity, Fewer Clicks)
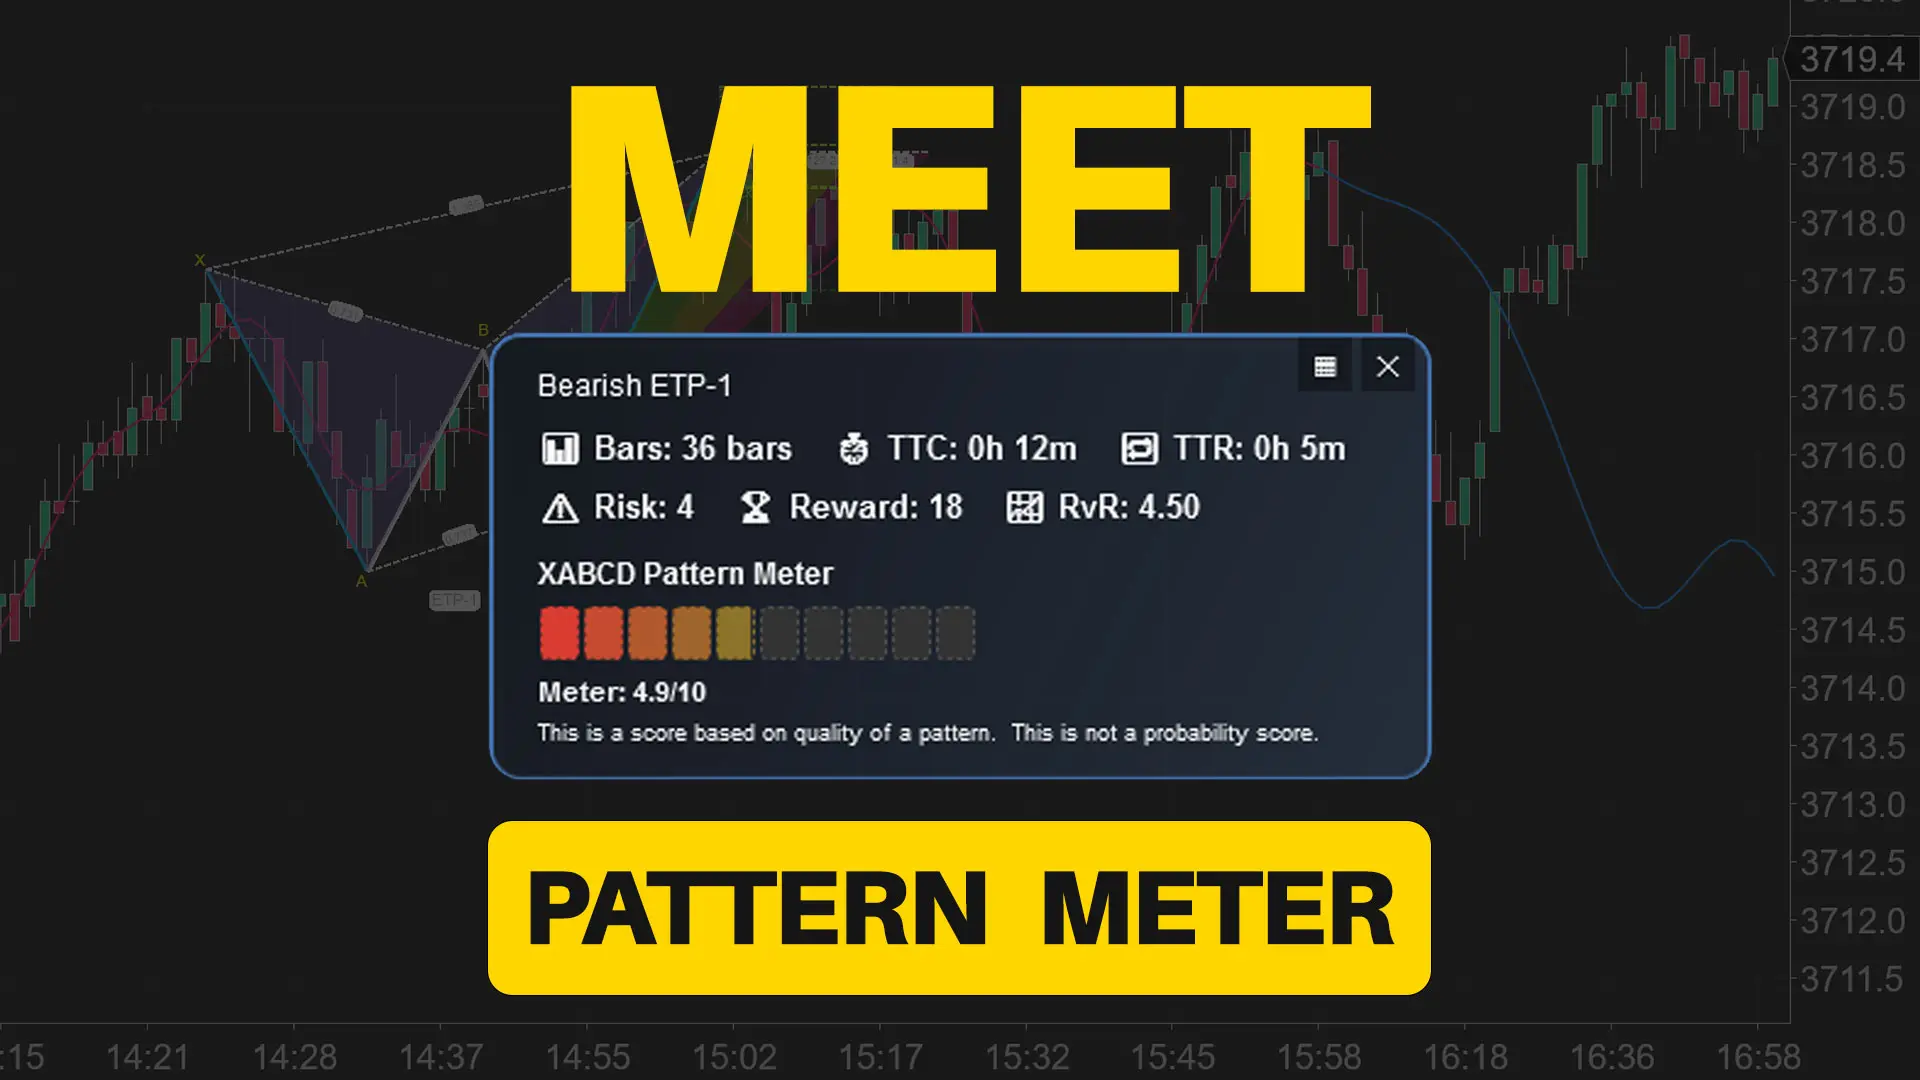
Meet the XABCD Pattern Meter (Real-Time Clarity)
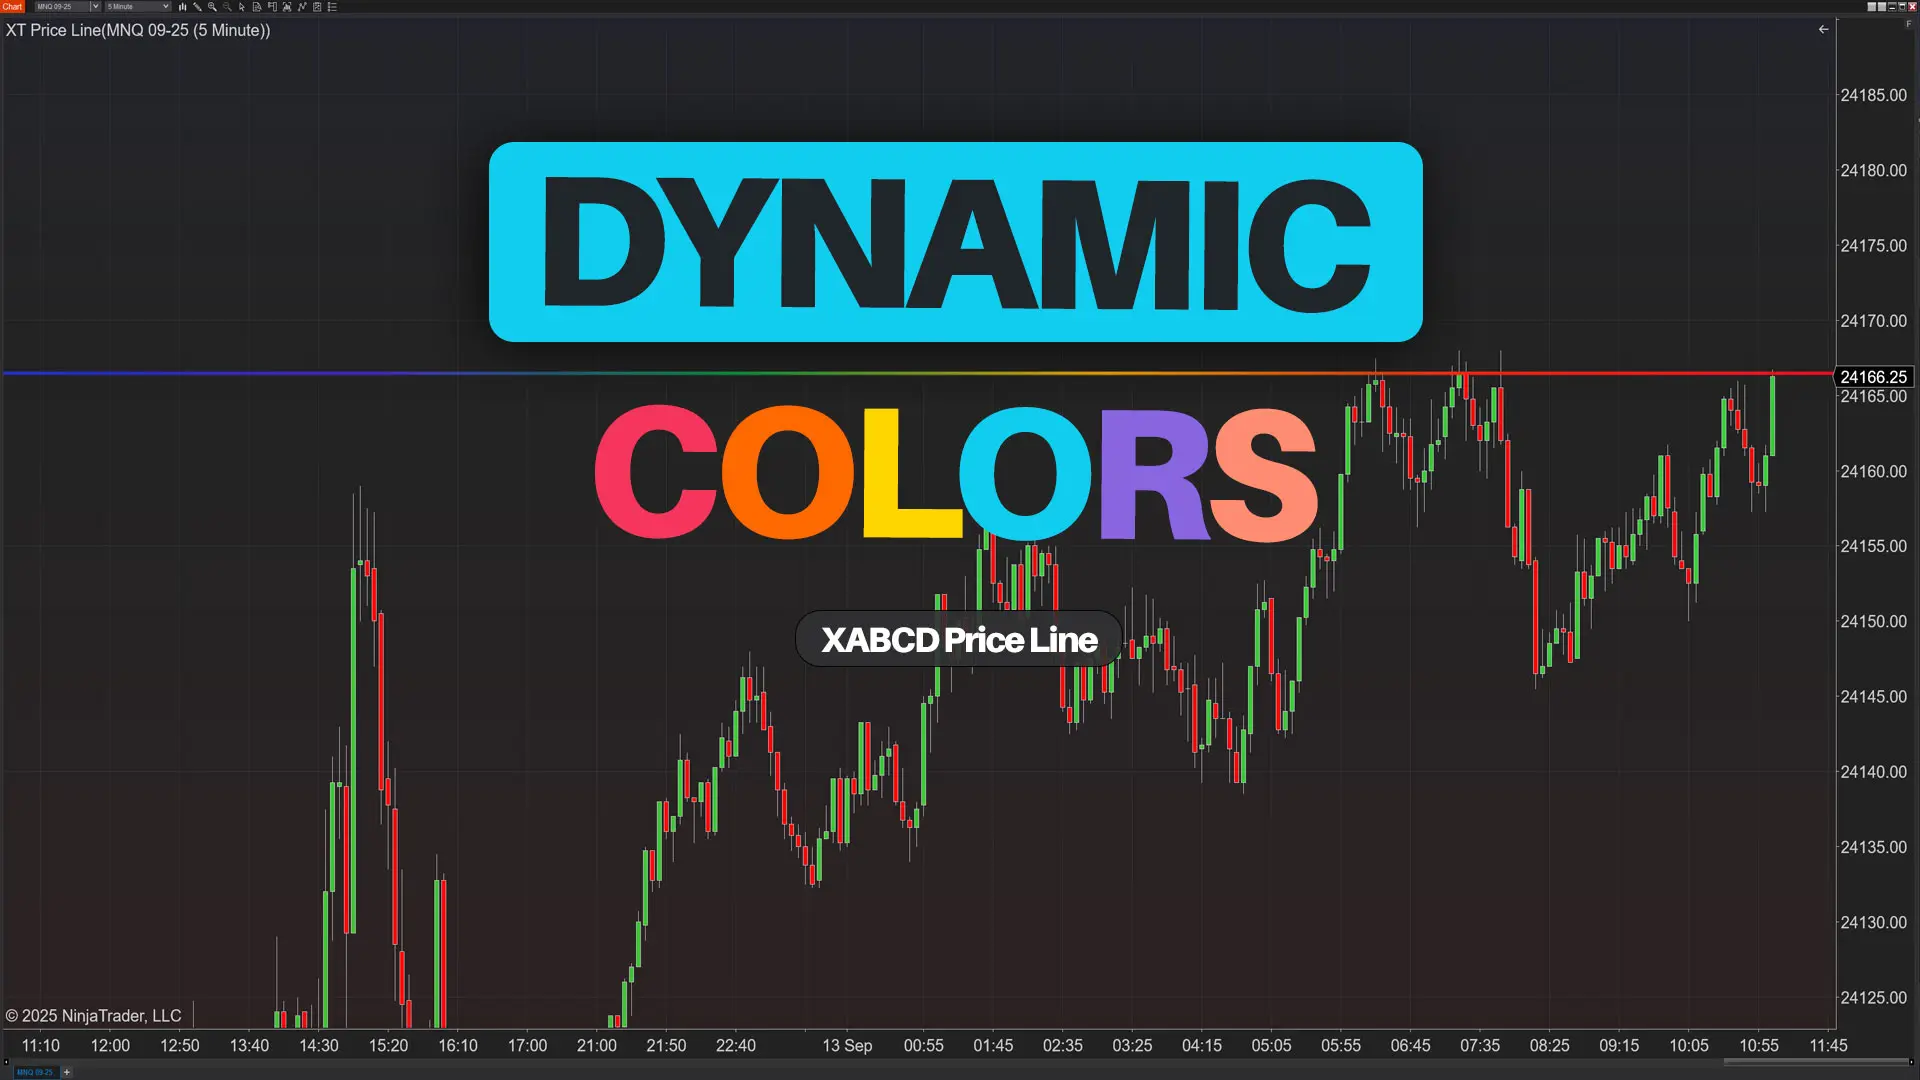
XT PriceLine: Dynamic Colors That Let You See Every Tick