XABCD TRADING

How To Overlay A Chart in NinjaTrader?
Subscribe
to get alerts to our next blog post!
Video Instructions Overlaying A Chart
Overlaying your charts is pretty easy on NinjaTrader once you know how to do it. Here is a video that will show you everything you need to know in order to get those charts working. Any questions, leave us a comment we will be happy to help you!
 (opens in a new tab)
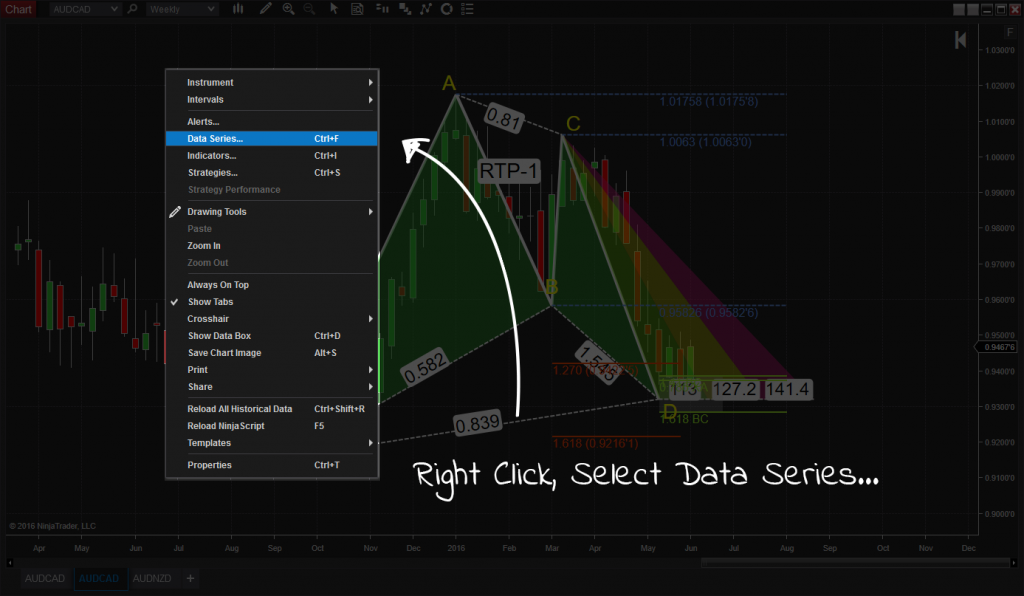
Step 1: Go To Your Data Series
In order to overlay a chart in NinjaTrader we need to do the following: Right click on the chart, select Data Series...
Step 2: Add An Instrument
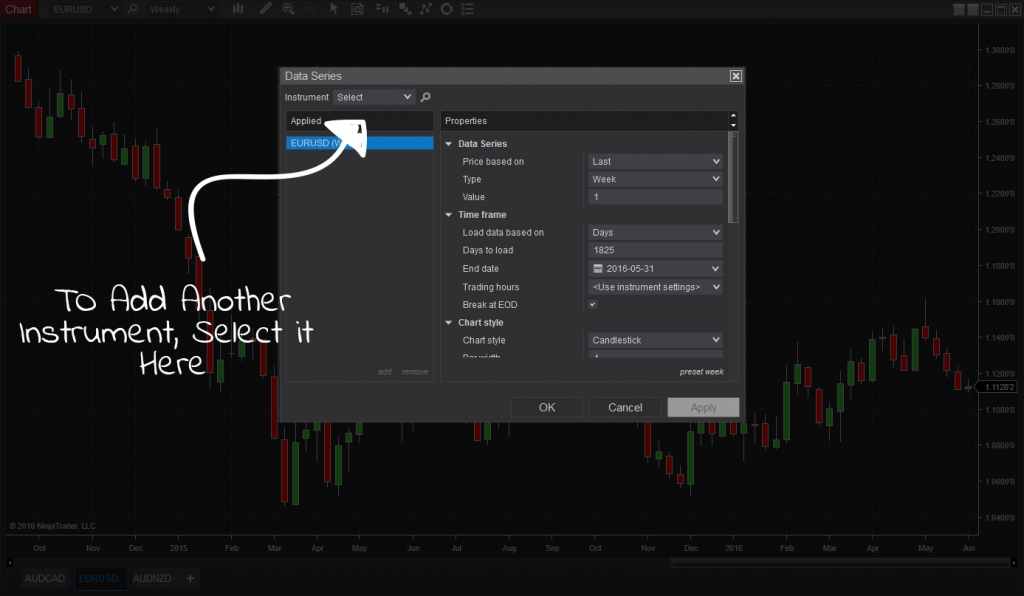
Select the new instrument and hit the drop down arrow. Find any symbol you want to use to overlay a chart in NinjaTrader. Once added to the list of applied symbols, you can now continue on to step 3. For ideas on which markets to pair, browse the instruments and symbols we scan, covering stocks, futures, forex pairs and indexes.

Step 3: Set Your Panels
Select the table as being part of Panel 1. This is probably going to be the same for most but you want the panels for the instruments to be the same so they are in overlay.
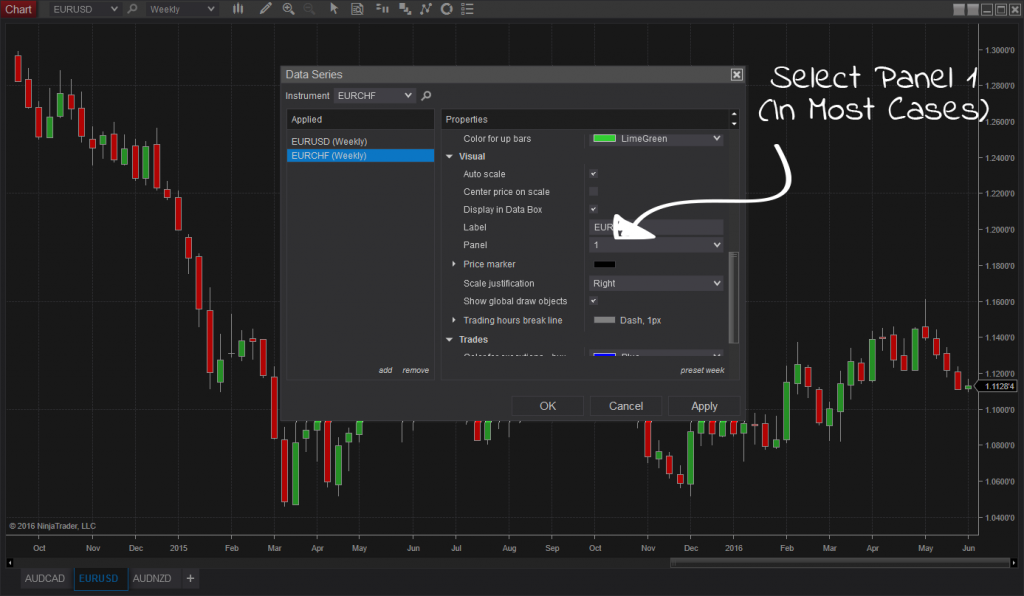
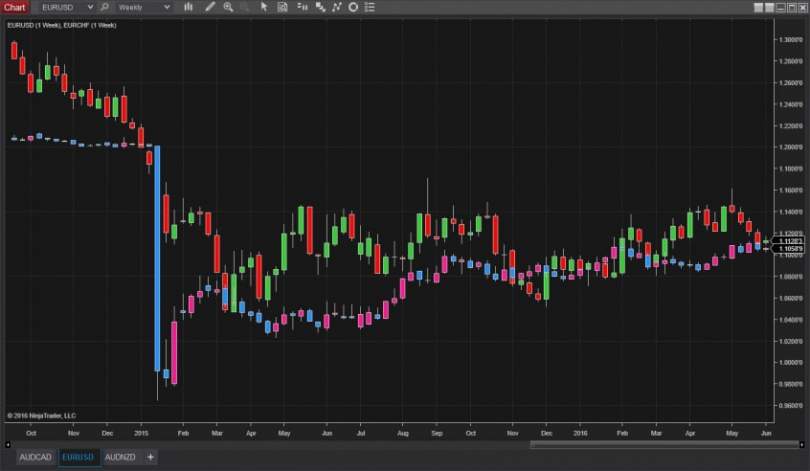
Depending on the price of the two instruments your looking at, you might find that the chart data of one instrument is above the other and they are on the same chart but they are not together. Right click on the chart -> Data Series on the top instrument change Scale justification to Overlay.
Step 4: You have completed Your Overlay Chart in NinjaTrader
Did it work for you?
That's it! Success! Let us know if this did the trick; we're also interested in any other neat tips you've discovered. Your chart is now overlaid with another. You can even do the same thing using different time frames. In other words, you could overlay a daily chart onto a weekly chart etc. You can also overlay charts built from different NinjaTrader bar types, such as tick or range bars, once you know how to switch them.
Frequently Asked Questions
How do you overlay a chart in NinjaTrader?
To overlay a chart in NinjaTrader, right-click on your chart and select "Data Series" from the context menu. Click "Add" to insert a new instrument or data series, then set the "Panel" option to "Same as input series" so it displays on top of the existing chart. This allows you to compare multiple instruments or timeframes on a single chart panel.
Can you overlay two indicators on the same chart panel in NinjaTrader?
Yes, you can overlay two or more indicators on the same chart panel in NinjaTrader by adjusting each indicator's panel setting. When adding an indicator, set the "Panel" property to a specific panel number or select an existing panel so multiple indicators share the same visual space. This is useful for comparing indicator readings side by side without cluttering your workspace.
Why is my overlaid data series not scaling correctly in NinjaTrader?
When you overlay a chart in NinjaTrader, instruments with very different price ranges can cause scaling issues where one series appears flat. To fix this, right-click the chart and enable a secondary axis or use the "Right" scale for one of the data series so each instrument has its own price scale. You can also right-click the price axis and select "Auto Scale" to adjust the visible range.
How do I overlay multiple timeframes on one NinjaTrader chart?
To overlay multiple timeframes, open the Data Series window by right-clicking the chart and selecting "Data Series." Add a new data series for the same instrument but choose a different timeframe, then set the panel to match the existing chart panel. This lets you view both timeframes simultaneously, which is helpful for multi-timeframe analysis.
What is the difference between overlaying and adding a new panel in NinjaTrader?
Overlaying places a second data series or indicator directly on top of the existing chart panel, sharing the same visual space. Adding a new panel creates a separate section below or above the main chart with its own price scale. Overlaying is ideal for comparing correlated instruments, while separate panels work better for indicators like volume or oscillators that use different value ranges.
Frequently Asked Questions
How do you overlay a chart in NinjaTrader?
To overlay a chart in NinjaTrader, right-click on your chart and select "Data Series" from the context menu. Click "Add" to insert a new instrument or data series, then set the "Panel" option to "Same as input series" so it displays on top of the existing chart. This allows you to compare multiple instruments or timeframes on a single chart panel.
Can you overlay two indicators on the same chart panel in NinjaTrader?
Yes, you can overlay two or more indicators on the same chart panel in NinjaTrader by adjusting each indicator's panel setting. When adding an indicator, set the "Panel" property to a specific panel number or select an existing panel so multiple indicators share the same visual space. This is useful for comparing indicator readings side by side without cluttering your workspace.
Why is my overlaid data series not scaling correctly in NinjaTrader?
When you overlay a chart in NinjaTrader, instruments with very different price ranges can cause scaling issues where one series appears flat. To fix this, right-click the chart and enable a secondary axis or use the "Right" scale for one of the data series so each instrument has its own price scale. You can also right-click the price axis and select "Auto Scale" to adjust the visible range.
How do I overlay multiple timeframes on one NinjaTrader chart?
To overlay multiple timeframes, open the Data Series window by right-clicking the chart and selecting "Data Series." Add a new data series for the same instrument but choose a different timeframe, then set the panel to match the existing chart panel. This lets you view both timeframes simultaneously, which is helpful for multi-timeframe analysis.
What is the difference between overlaying and adding a new panel in NinjaTrader?
Overlaying places a second data series or indicator directly on top of the existing chart panel, sharing the same visual space. Adding a new panel creates a separate section below or above the main chart with its own price scale. Overlaying is ideal for comparing correlated instruments, while separate panels work better for indicators like volume or oscillators that use different value ranges.
New NinjaTrader Articles Delivered First
Recommended Video
Ditch NinjaTrader ATMs: This Is More Powerful
See how to set your risk and calculate contracts directly on the chart.
Watch Now
Subscribe on YouTube
Related Tool
XABCD Position Tool
Automatic position sizing and on-chart trade management.
Explore the Tool
Why XABCD Trading
- Built for NinjaTrader 8 since 2009
- Trusted by 2,000+ traders
- On-chart tools, no ATM templates needed
- Free tools to get started

Get Project Updates
Twice-monthly maximum, we will give you updates on all the projects going here.
Quick Links
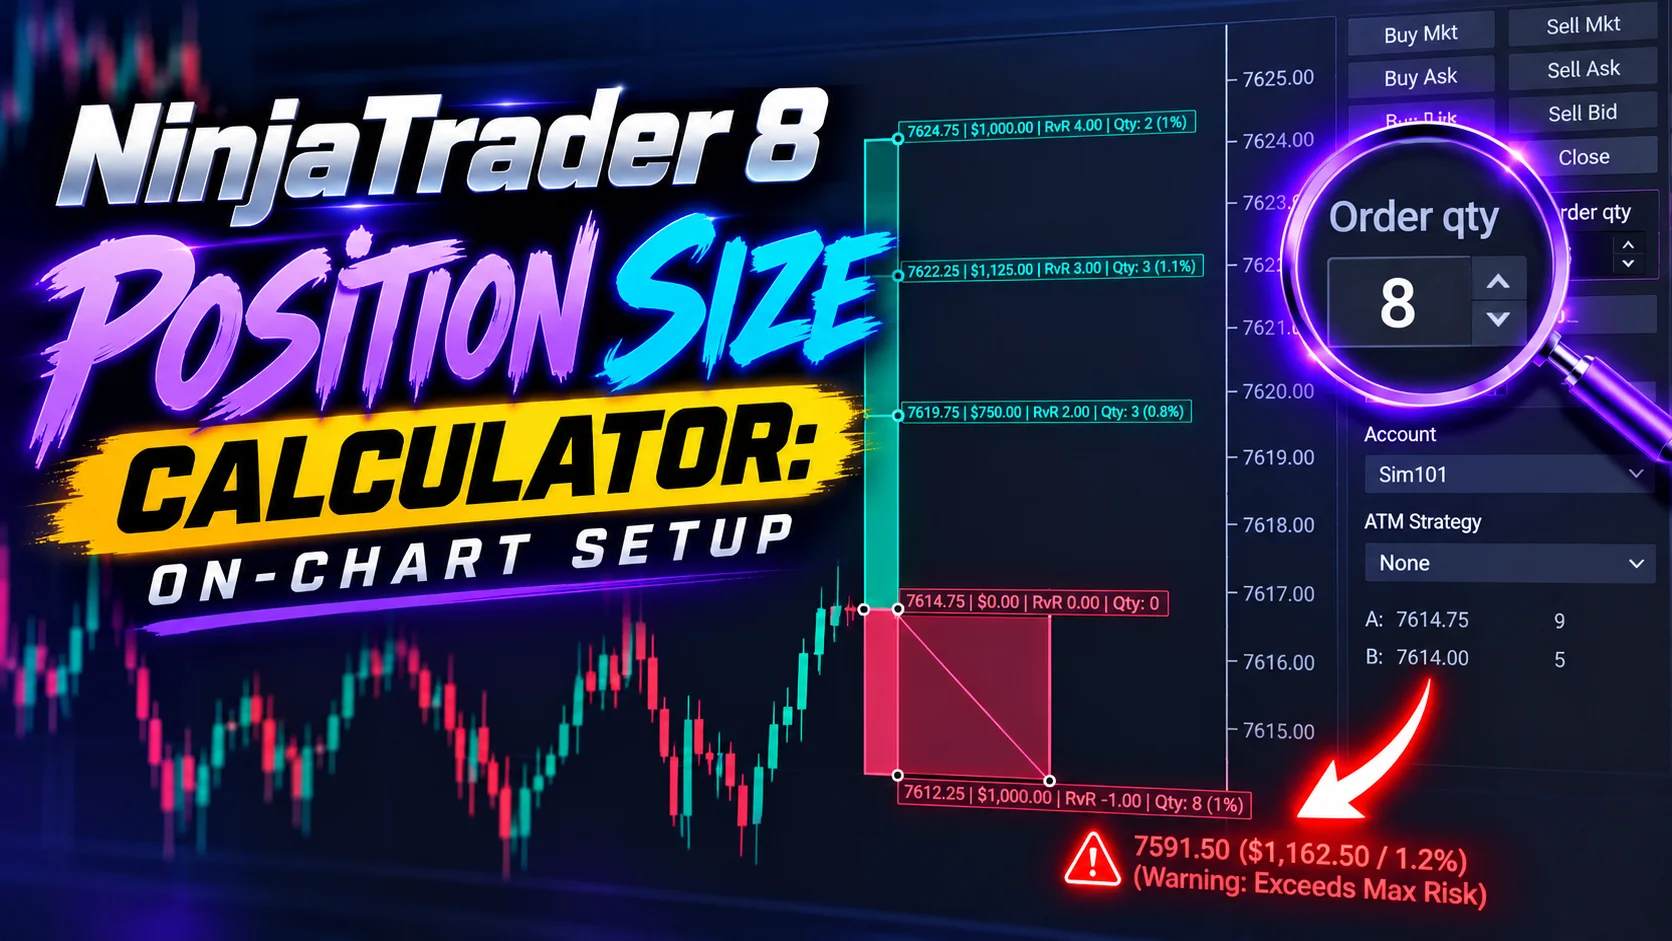
NinjaTrader 8 Position Size Calculator: On-Chart Setup
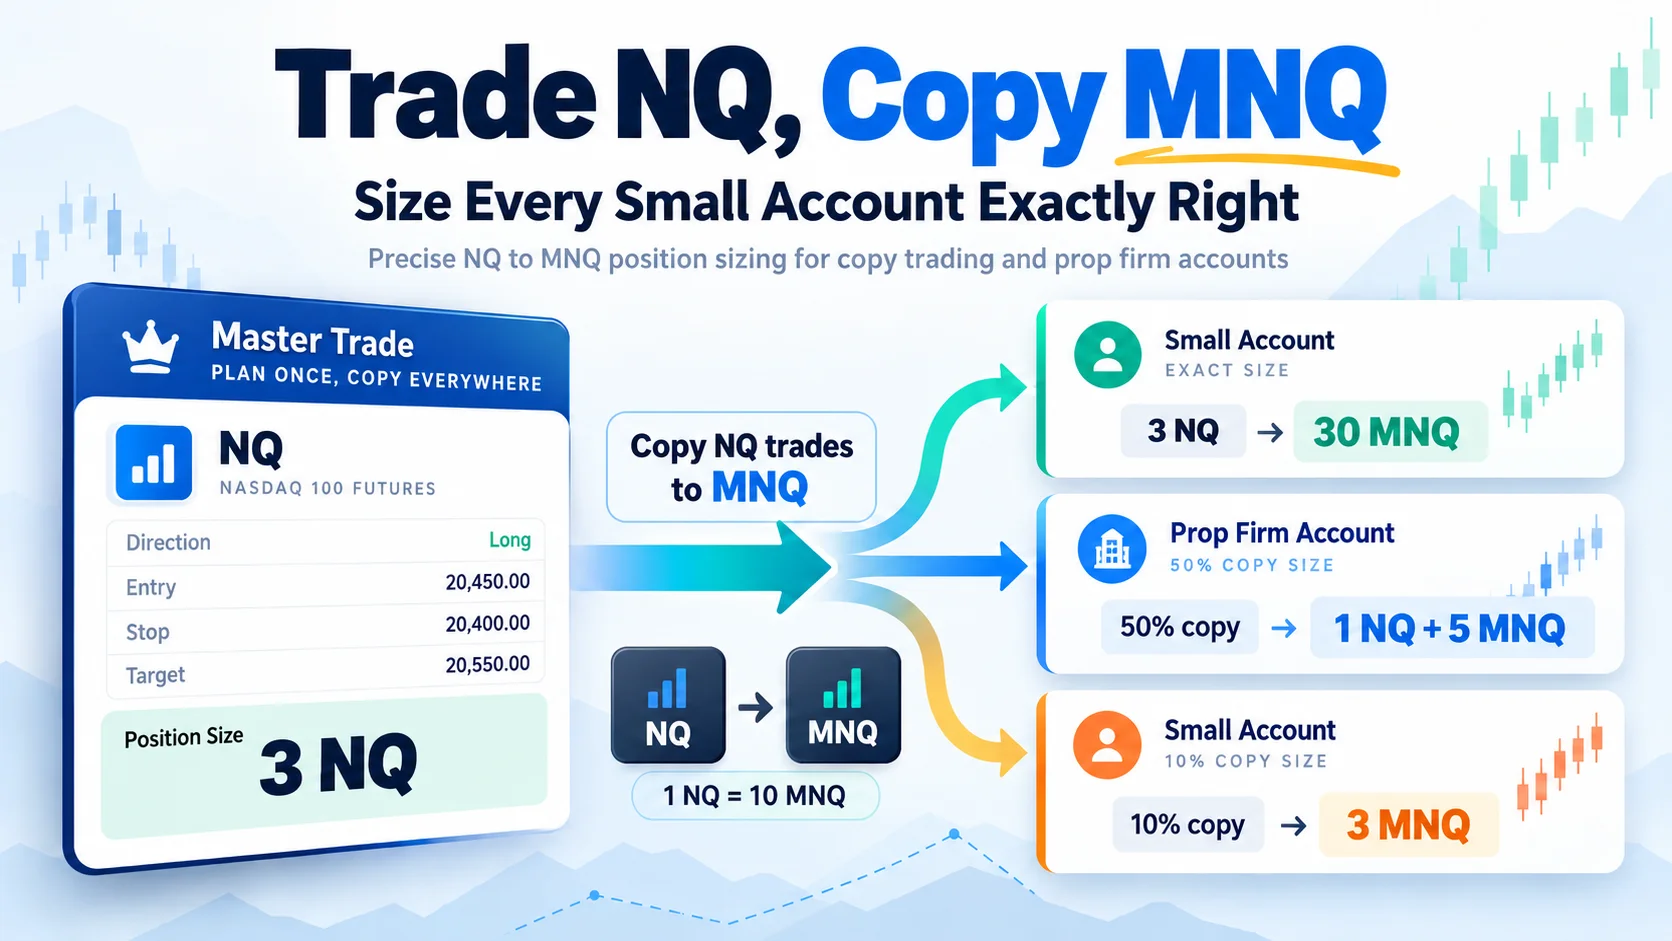
Trade NQ, Copy MNQ: Copy NQ Trades to MNQ in NinjaTrader 8
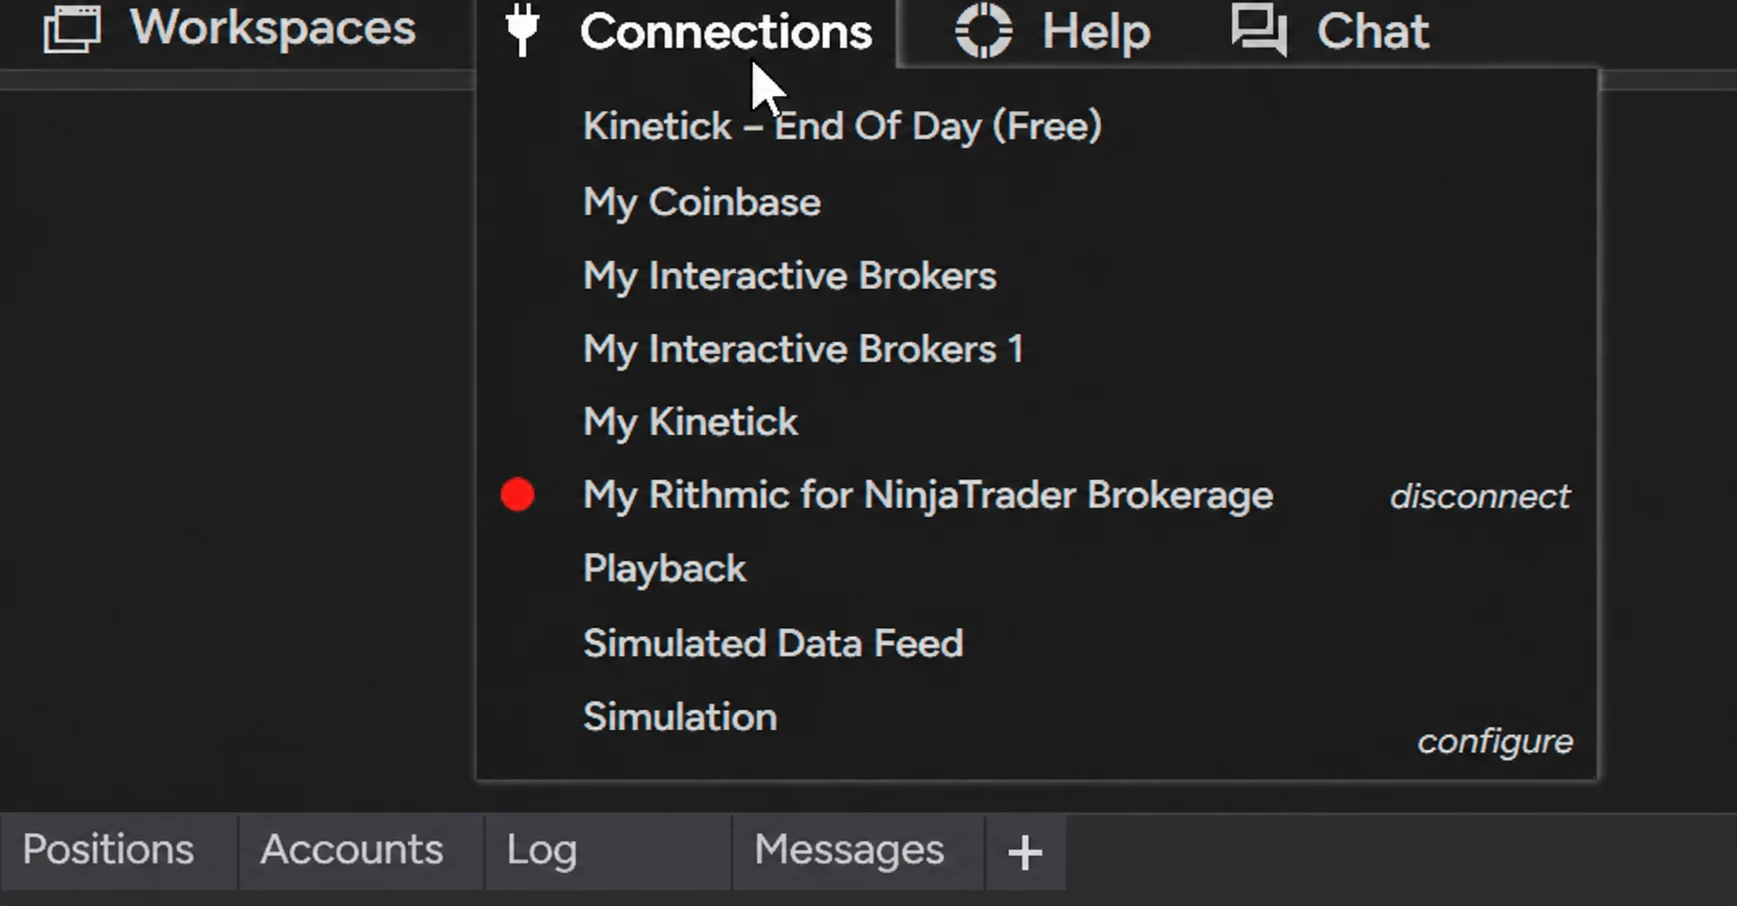
NinjaTrader Data Feed Not Updating? Quick Fixes
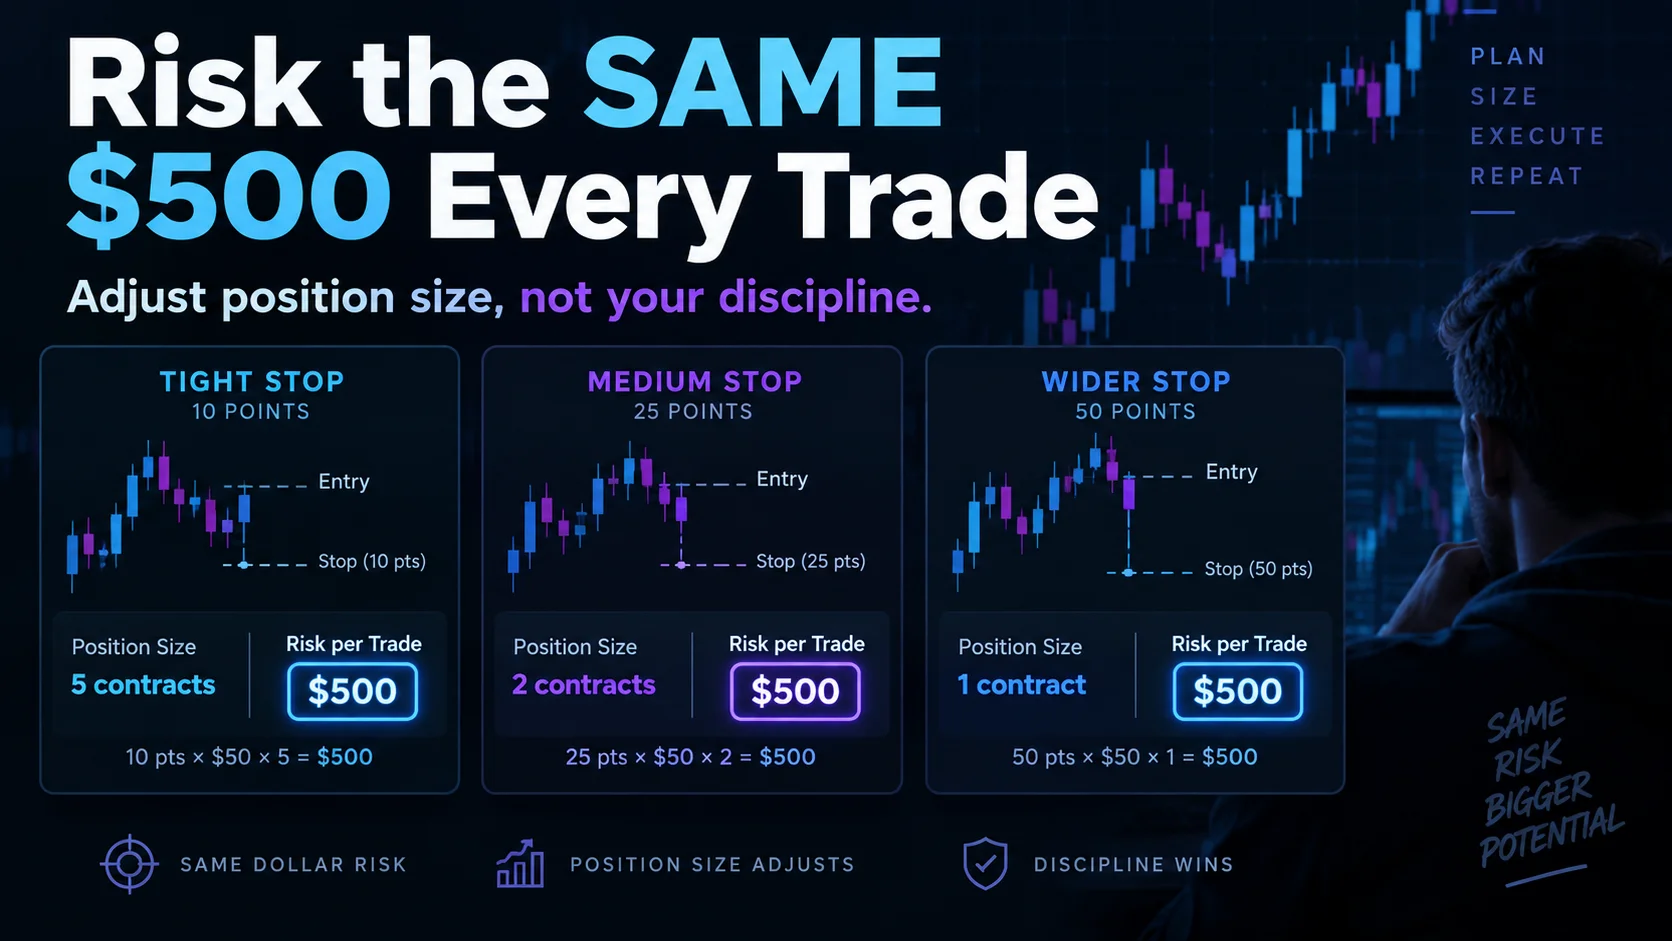
NinjaTrader Risk Per Trade: Risk $500 on Every Trade
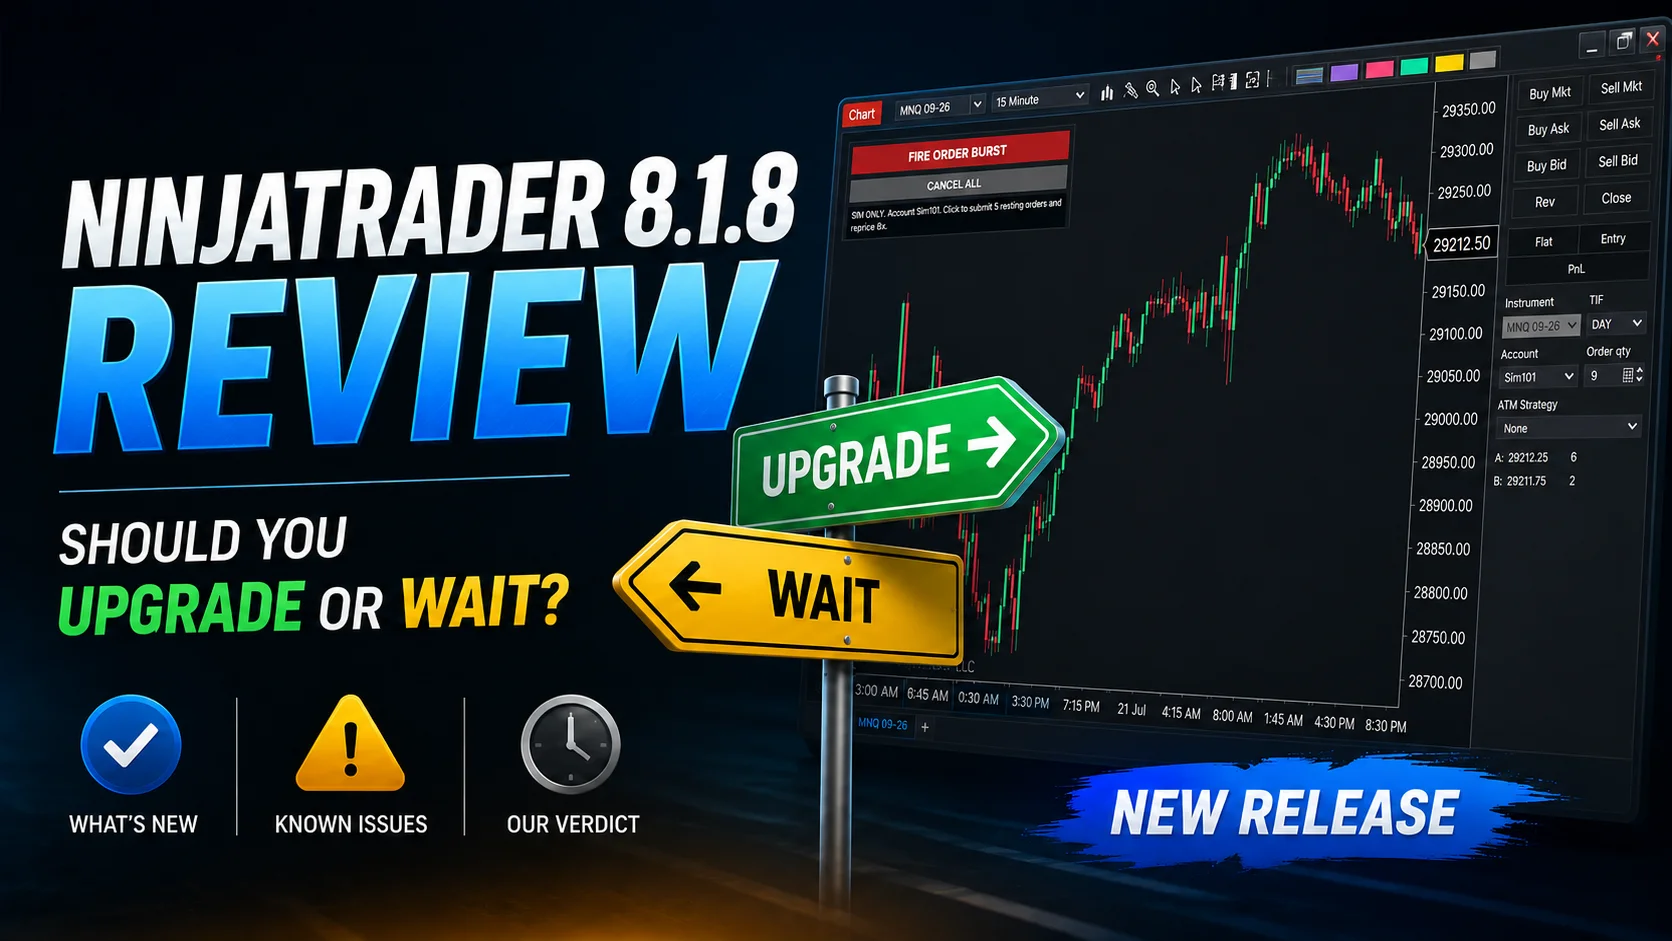
NinjaTrader 8.1.8 Review: Should You Upgrade or Wait?
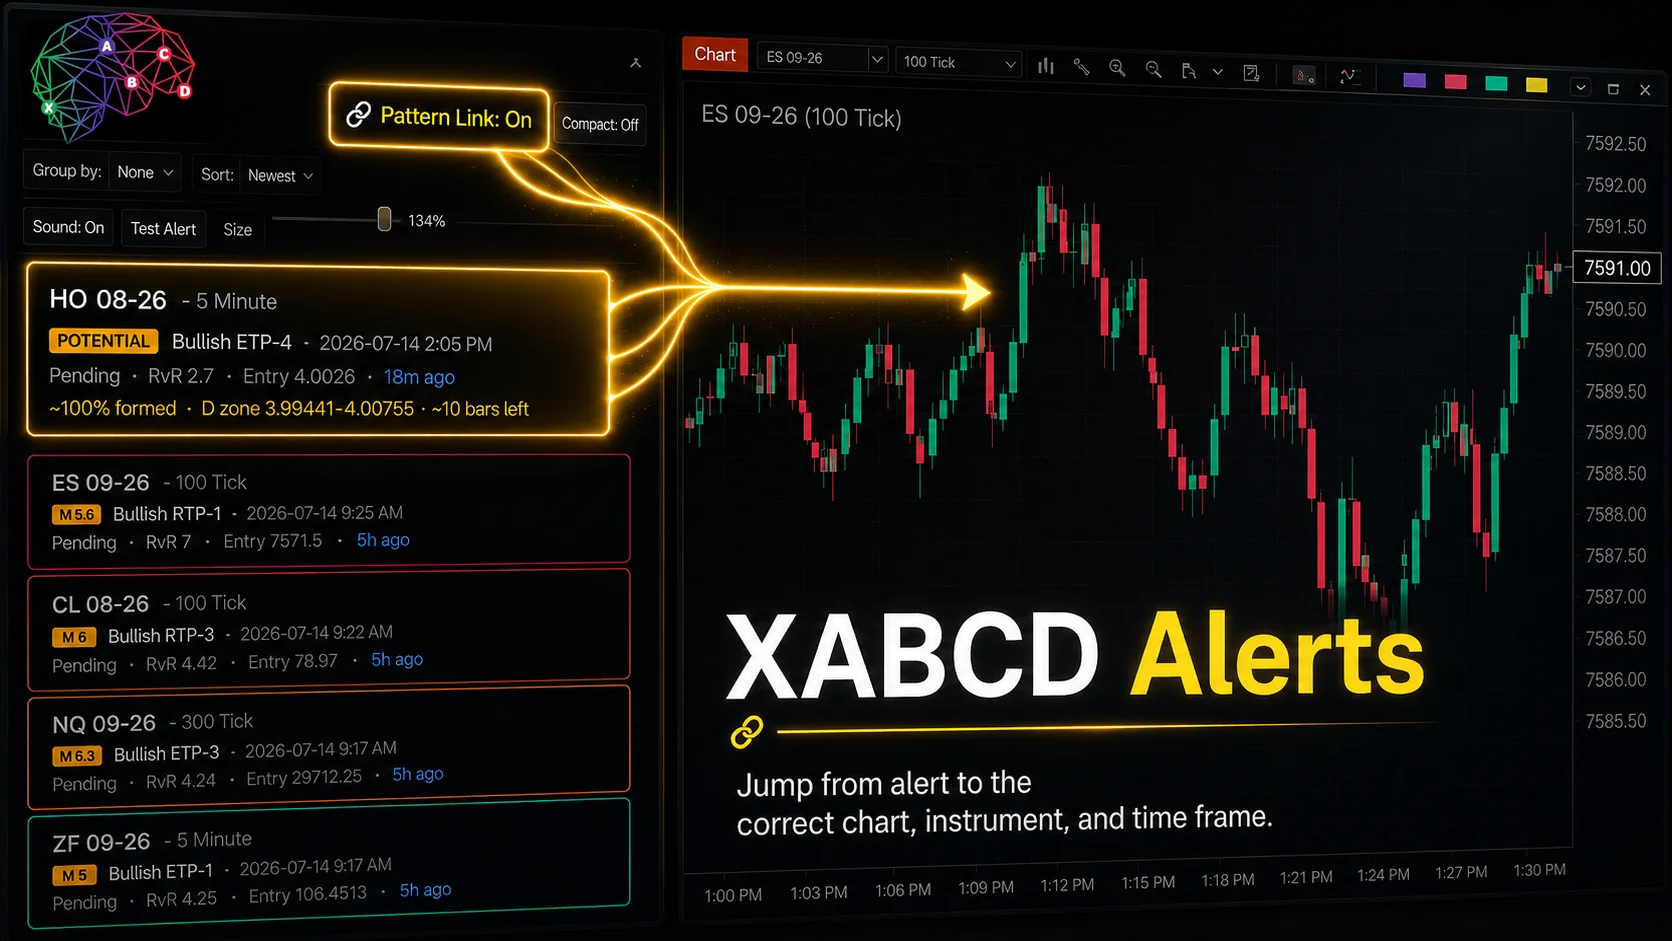
XABCD Pattern Alerts: The Complete Guide for Traders
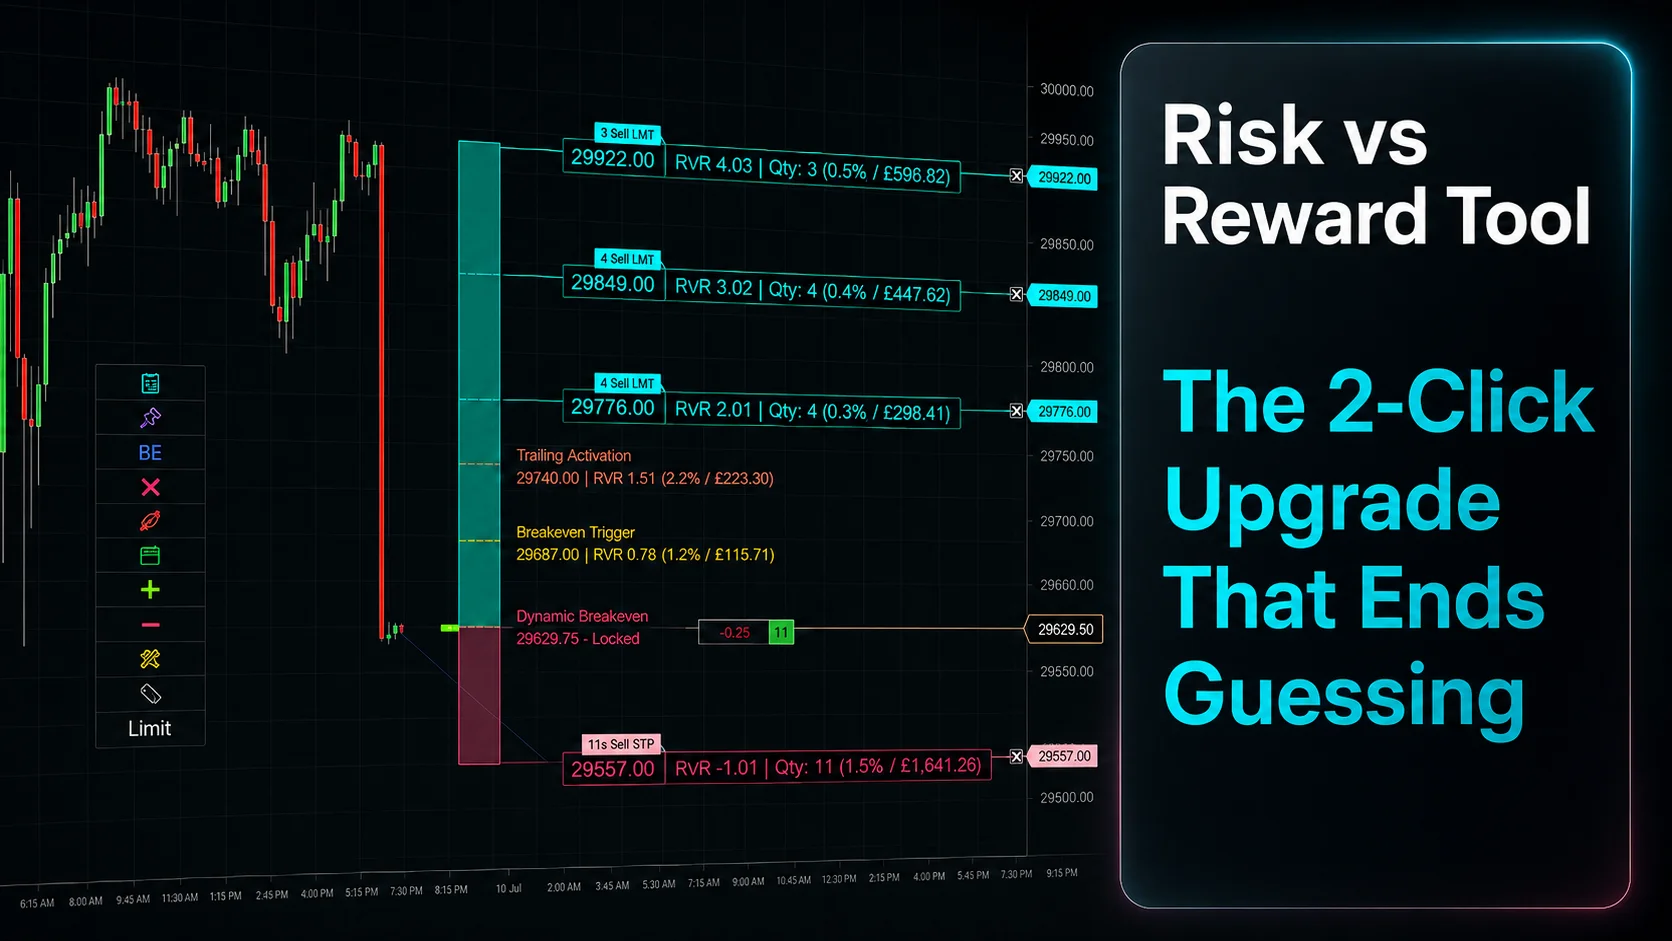
Risk vs Reward Tool: The 2-Click Upgrade That Ends Guessing
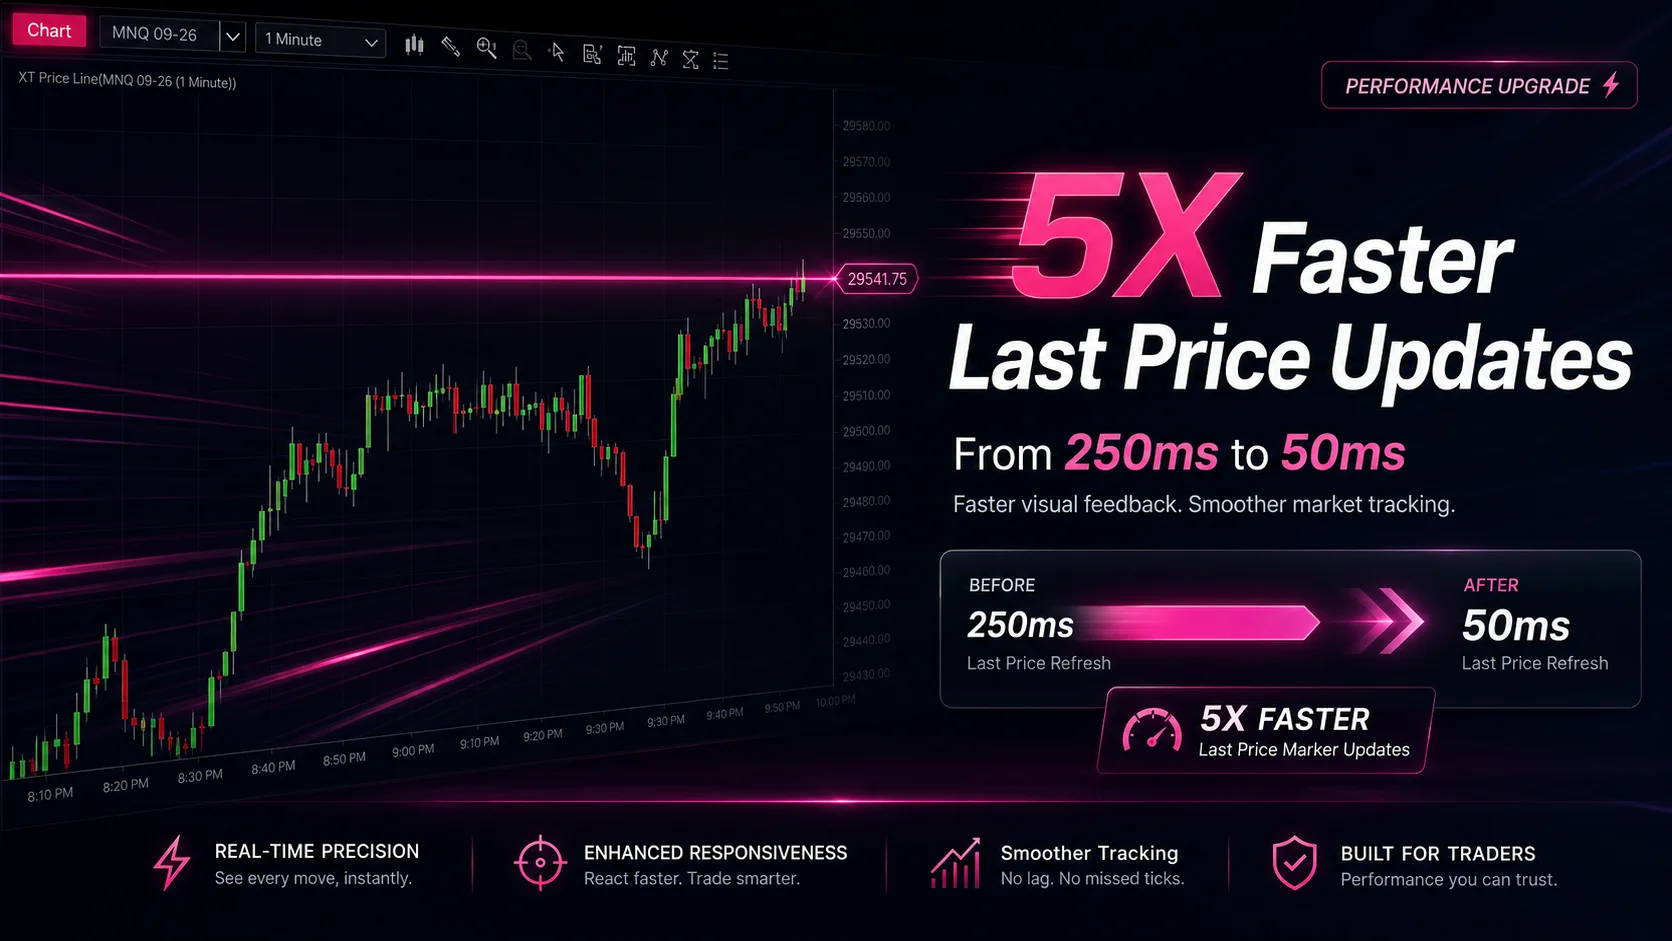
NinjaTrader Faster Last Price Updates on Charts Explained
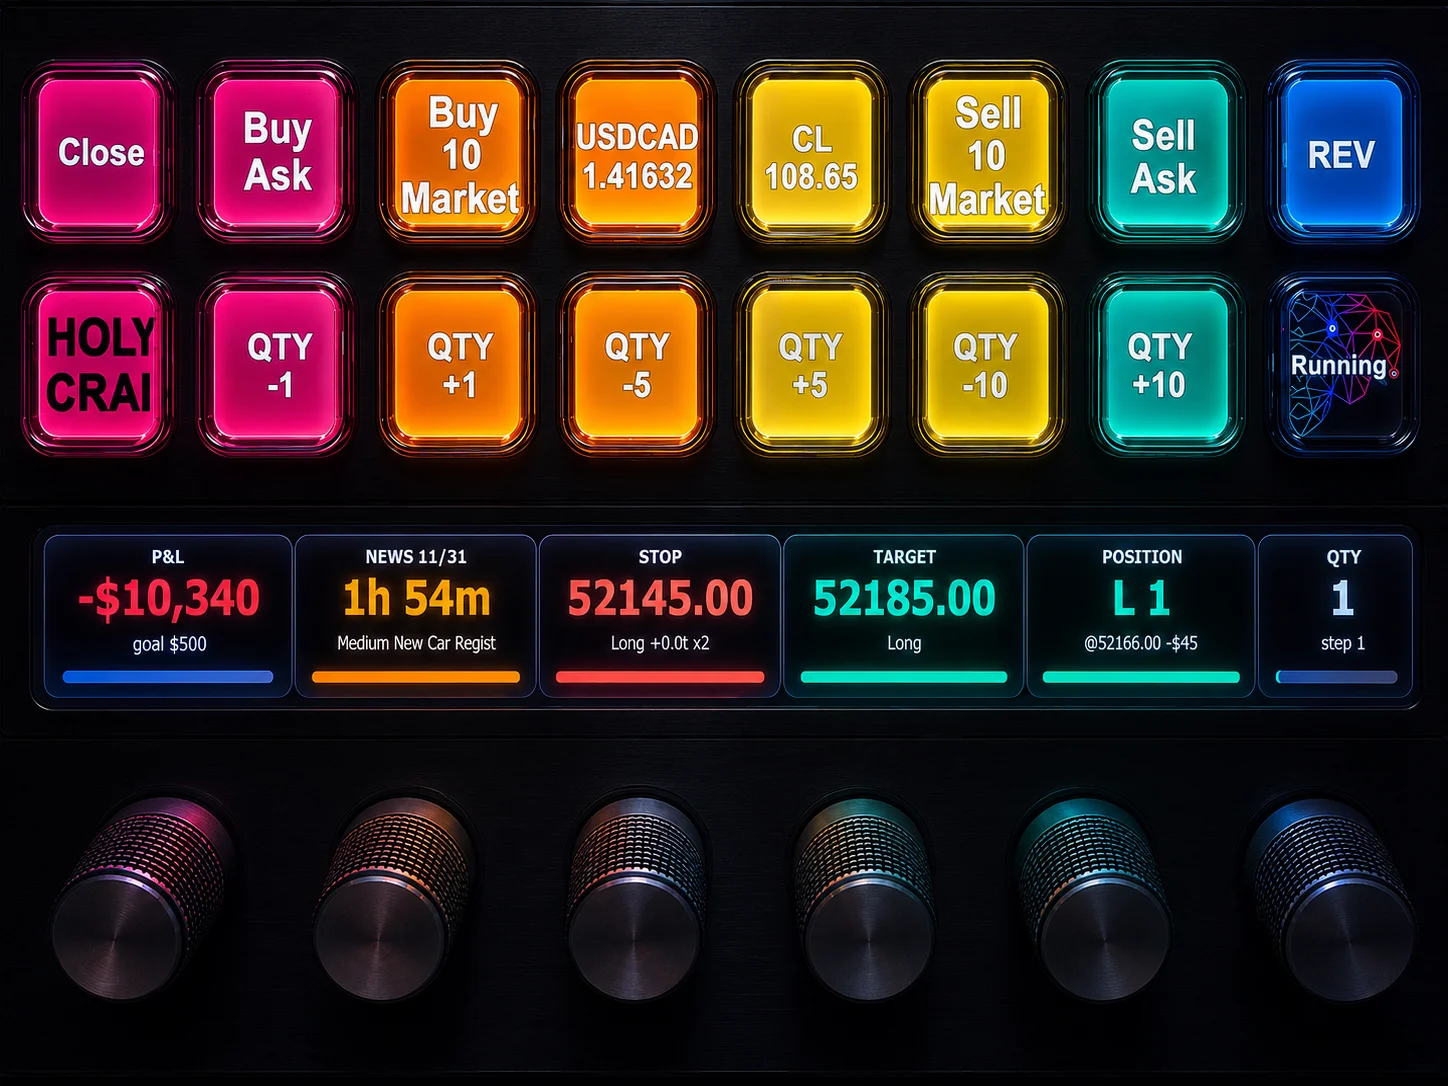
NinjaTrader 8 Hotkeys: Best Shortcuts for Faster Trading