XABCD TRADING

Are XABCD Patterns Still Useful in 2025?

Subscribe
to get alerts to our next blog post!
Why I'll Be Using XABCD Patterns in 2025
XABCD patterns are powerful tools in trading, and in this post, I’m going to provide an overview of why they form the foundation of my trading strategy—both today and in the future. Here are the key reasons why XABCD patterns are a game-changer for traders.

Precision and Consistency
One of the primary reasons I trade XABCD patterns is the precision they bring to market analysis. My analysis follows a systematic approach every single time, ensuring consistency. I either wait for these patterns to appear or use automated scanning tools, which save significant time compared to manual drawing.
XABCD patterns combine price, time, and geometric shapes with Fibonacci ratios to deliver a high degree of accuracy. This method of analysis fosters consistency, enabling traders to approach the market predictably and objectively. With consistent application, these patterns help reduce guesswork in market predictions.
- Objective Pattern Recognition: Removes subjectivity by automatically detecting XABCD patterns based on strict Fibonacci-based rules.
- Clear Entry and Exit Rules: Provides pre-defined entry points, stop-loss levels, and take-profit targets to eliminate guesswork.
- Higher Probability Trade Setups: Filters out low-quality trades by using both price and time analysis for improved accuracy.
- Automated Real-Time Pattern Scanning: Saves time by continuously monitoring the market and alerting traders to valid XABCD patterns.
- Multi-Timeframe Analysis: Increases confidence by confirming XABCD patterns across different timeframes.
- Eliminates Emotional Trading: Provides a structured approach to trading, reducing impulsive decisions and FOMO (fear of missing out).
- Works in All Market Conditions: Effective in trending, ranging, and volatile market environments.
- Backtesting for Strategy Improvement: Allows traders to review past XABCD patterns and refine their strategies based on historical data.
- Works Across Multiple Asset Classes: Adaptable to Forex, stocks, futures, cryptocurrencies, and commodities.
- Risk Management Built-In: Calculates optimal stop-loss and risk-to-reward ratios to prevent overleveraging.
- Live Alerts and Notifications: Keeps traders informed with real-time alerts when a trade-ready XABCD pattern forms.
- Continuous Software Updates & Support: Ensures traders always have access to the latest improvements and expert support.
Objective Trading Decisions
Trading with XABCD patterns allows for objective decision-making. I don’t focus on whether a single pattern wins or loses; instead, I look at the overall system’s performance. This system-based approach minimizes emotional involvement, making it easier to focus on long-term profitability rather than short-term results.
For instance, even if one pattern doesn't perform as expected, the collective outcomes over time ensure consistency. This approach removes the stress of hoping that an individual trade will succeed and instead emphasizes executing a proven strategy.
Identifying Key Market Turning Points
XABCD patterns excel at identifying critical market turning points. Whether you trade daily, intraday, or higher timeframes, these patterns guide traders to significant reversals. You can identify major market movements on higher timeframes and then drill down to smaller timeframes for precise entries.
For example, a pattern aligning with a previous area of resistance provides a clear signal for potential market reversals. This ability to pinpoint key turning points is invaluable for traders aiming to capitalize on major market movements.
Applicability Across Timeframes and Styles
Another reason I love XABCD patterns is their versatility. They work across all timeframes and charting styles—whether you trade Renko, point-and-figure, candlesticks, or any other style. From 10-second charts to weekly charts, these patterns adapt seamlessly. This flexibility makes them accessible for traders of all preferences and strategies.
Combining Price, Time, and Geometry
XABCD patterns integrate price, time, and geometric shapes for a comprehensive analysis. For instance, we measure:
These factors, along with defined probability zones (green, yellow, and red), provide clear entry and exit points. This combination of price, time, and geometry reduces ambiguity and enhances decision-making.
- The retracement from X to A and the B point.
- The time it takes to form each leg of the pattern (e.g., X to A, A to B, etc.).
These factors, along with defined probability zones (green, yellow, and red), provide clear entry and exit points. This combination of price, time, and geometry reduces ambiguity and enhances decision-making.
Clear Entry and Exit Points
One of the standout benefits of XABCD patterns is the clarity they bring to trading. Entry points are well-defined within specific zones, such as the green or yellow areas, while targets and stops are also clearly outlined. This structure simplifies trade execution and enables traders to calculate risk-to-reward ratios easily.
For example, a 2:1 risk-to-reward ratio means you only need to be right 33% of the time to break even. This significantly lowers the bar for success compared to strategies requiring higher win rates.
Minimizing Overtrading
One of the standout benefits of XABCD patterns is the clarity they bring to trading. Entry points are well-defined within specific zones, such as the green or yellow areas, while targets and stops are also clearly outlined. This structure simplifies trade execution and enables traders to calculate risk-to-reward ratios easily.
For example, a 2:1 risk-to-reward ratio means you only need to be right 33% of the time to break even. This significantly lowers the bar for success compared to strategies requiring higher win rates.
Compatibility with Other Indicators
XABCD patterns integrate well with other indicators. While I personally prefer non-linear indicators, you can combine these patterns with RSI, MACD, volume, or any other tool you use. For example, an RSI value above 70 in a reversal zone could signal a strong shorting opportunity. This flexibility allows traders to tailor their strategies to their preferences.
Enhancing Discipline and Confidence
XABCD patterns integrate well with other indicators. While I personally prefer non-linear indicators, you can combine these patterns with RSI, MACD, volume, or any other tool you use. For example, an RSI value above 70 in a reversal zone could signal a strong shorting opportunity. This flexibility allows traders to tailor their strategies to their preferences.
Additionally, XABCD patterns are entirely objective. Unlike subjective methods like Elliott Wave or volume interpretation, these patterns leave no room for interpretation. Everything is black and white, enabling traders to approach the market with clarity and confidence.
Small Losses, Big Wins
Losses are an inevitable part of trading, but XABCD patterns help minimize them. Stops are placed just outside the reversal zone, ensuring small, manageable losses. Meanwhile, predefined targets and favorable risk-to-reward ratios ensure that winners outweigh losers over time. This disciplined approach to risk management is a cornerstone of successful trading.
Ideal for Beginners and Experts Alike
What once required advanced knowledge and manual calculations is now accessible to beginners, thanks to automated tools. These patterns provide a consistent framework for traders at all levels, whether you’re just starting out or have years of experience. Beginners can build confidence and consistency, while experienced traders can refine their strategies further.
What it All Boils Down Too?
XABCD patterns are a robust and versatile tool for traders, offering precision, consistency, and objectivity. They simplify complex market analysis, reduce emotional decision-making, and enhance discipline—all while being applicable across various timeframes and chart styles.
If you’re looking to improve your trading consistency and confidence, XABCD patterns are worth exploring. Have questions? Drop them in the comments below, and I’ll be happy to help. Don’t forget to like, share, and subscribe to spread the word about the power of XABCD patterns in trading!
Frequently Asked Questions
What is the XABCD trading strategy and how does it work?
The XABCD trading strategy is a method that uses geometric price patterns combined with Fibonacci ratios to identify high-probability market reversal points. It works by measuring retracements between five points (X, A, B, C, D) along with the time each leg takes to form, creating defined probability zones for entries, stop-losses, and profit targets. This combination of price, time, and geometry provides clear, objective trading signals across any market or timeframe.
Do XABCD patterns work for beginners?
Yes, XABCD patterns are ideal for both beginners and experienced traders. What once required advanced knowledge and manual calculations is now accessible to beginners thanks to automated scanning tools that detect patterns and provide real-time alerts. The strategy offers a consistent framework with pre-defined entry points, stop-loss levels, and take-profit targets, which helps newer traders build confidence and reduce guesswork.
What is the risk-to-reward ratio when using an XABCD trading strategy?
XABCD patterns commonly offer favorable risk-to-reward ratios because stops are placed just outside the reversal zone, keeping losses small, while predefined targets allow for larger wins. For example, with a 2:1 risk-to-reward ratio, a trader only needs to be right 33% of the time to break even. This built-in risk management approach ensures that winning trades outweigh losing trades over time.
Can XABCD patterns be combined with other technical indicators?
Yes, XABCD patterns integrate well with other technical indicators such as RSI, MACD, and volume analysis. For instance, an RSI reading above 70 occurring within a pattern's reversal zone could reinforce a shorting signal. This flexibility allows traders to layer objective pattern recognition trading with their preferred confirmation tools to further increase trade quality.
What markets and chart types do Fibonacci trading patterns like XABCD work on?
XABCD patterns are adaptable across multiple asset classes including Forex, stocks, futures, cryptocurrencies, and commodities. They also work on virtually any charting style—candlesticks, Renko, point-and-figure, and others—and across all timeframes from 10-second charts to weekly charts. This versatility makes them effective in trending, ranging, and volatile market conditions alike.
Frequently Asked Questions
What is the XABCD trading strategy and how does it work?
The XABCD trading strategy is a method that uses geometric price patterns combined with Fibonacci ratios to identify high-probability market reversal points. It works by measuring retracements between five points (X, A, B, C, D) along with the time each leg takes to form, creating defined probability zones for entries, stop-losses, and profit targets. This combination of price, time, and geometry provides clear, objective trading signals across any market or timeframe.
Do XABCD patterns work for beginners?
Yes, XABCD patterns are ideal for both beginners and experienced traders. What once required advanced knowledge and manual calculations is now accessible to beginners thanks to automated scanning tools that detect patterns and provide real-time alerts. The strategy offers a consistent framework with pre-defined entry points, stop-loss levels, and take-profit targets, which helps newer traders build confidence and reduce guesswork.
What is the risk-to-reward ratio when using an XABCD trading strategy?
XABCD patterns commonly offer favorable risk-to-reward ratios because stops are placed just outside the reversal zone, keeping losses small, while predefined targets allow for larger wins. For example, with a 2:1 risk-to-reward ratio, a trader only needs to be right 33% of the time to break even. This built-in risk management approach ensures that winning trades outweigh losing trades over time.
Can XABCD patterns be combined with other technical indicators?
Yes, XABCD patterns integrate well with other technical indicators such as RSI, MACD, and volume analysis. For instance, an RSI reading above 70 occurring within a pattern's reversal zone could reinforce a shorting signal. This flexibility allows traders to layer objective pattern recognition trading with their preferred confirmation tools to further increase trade quality.
What markets and chart types do Fibonacci trading patterns like XABCD work on?
XABCD patterns are adaptable across multiple asset classes including Forex, stocks, futures, cryptocurrencies, and commodities. They also work on virtually any charting style—candlesticks, Renko, point-and-figure, and others—and across all timeframes from 10-second charts to weekly charts. This versatility makes them effective in trending, ranging, and volatile market conditions alike.
New NinjaTrader Articles Delivered First
 (opens in a new tab)
Easy Order Tool

The Strategy


Scanning & Alerting

NinjaTrader Release
XABCD News (Free Version)
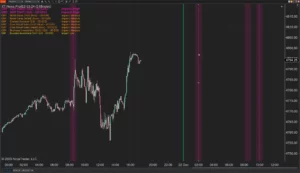
XABCD News (Community Edition) is the best free Indicator for NinjaTrader 8. Don't let news sneak up on you again. Puts economic news events on your charts so you can stay informed and move around positions/stops before the news is released. Works in any market.
XABCD Priceline (Free)
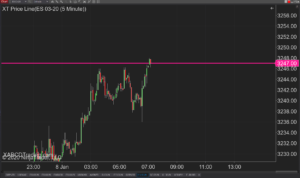
XABCD Price Line tool for NinjaTrader 8 will draw a line at current price and move every time the market changes price. This is useful because it will allow you to easily identify where price is at all times and the exact quoted price.
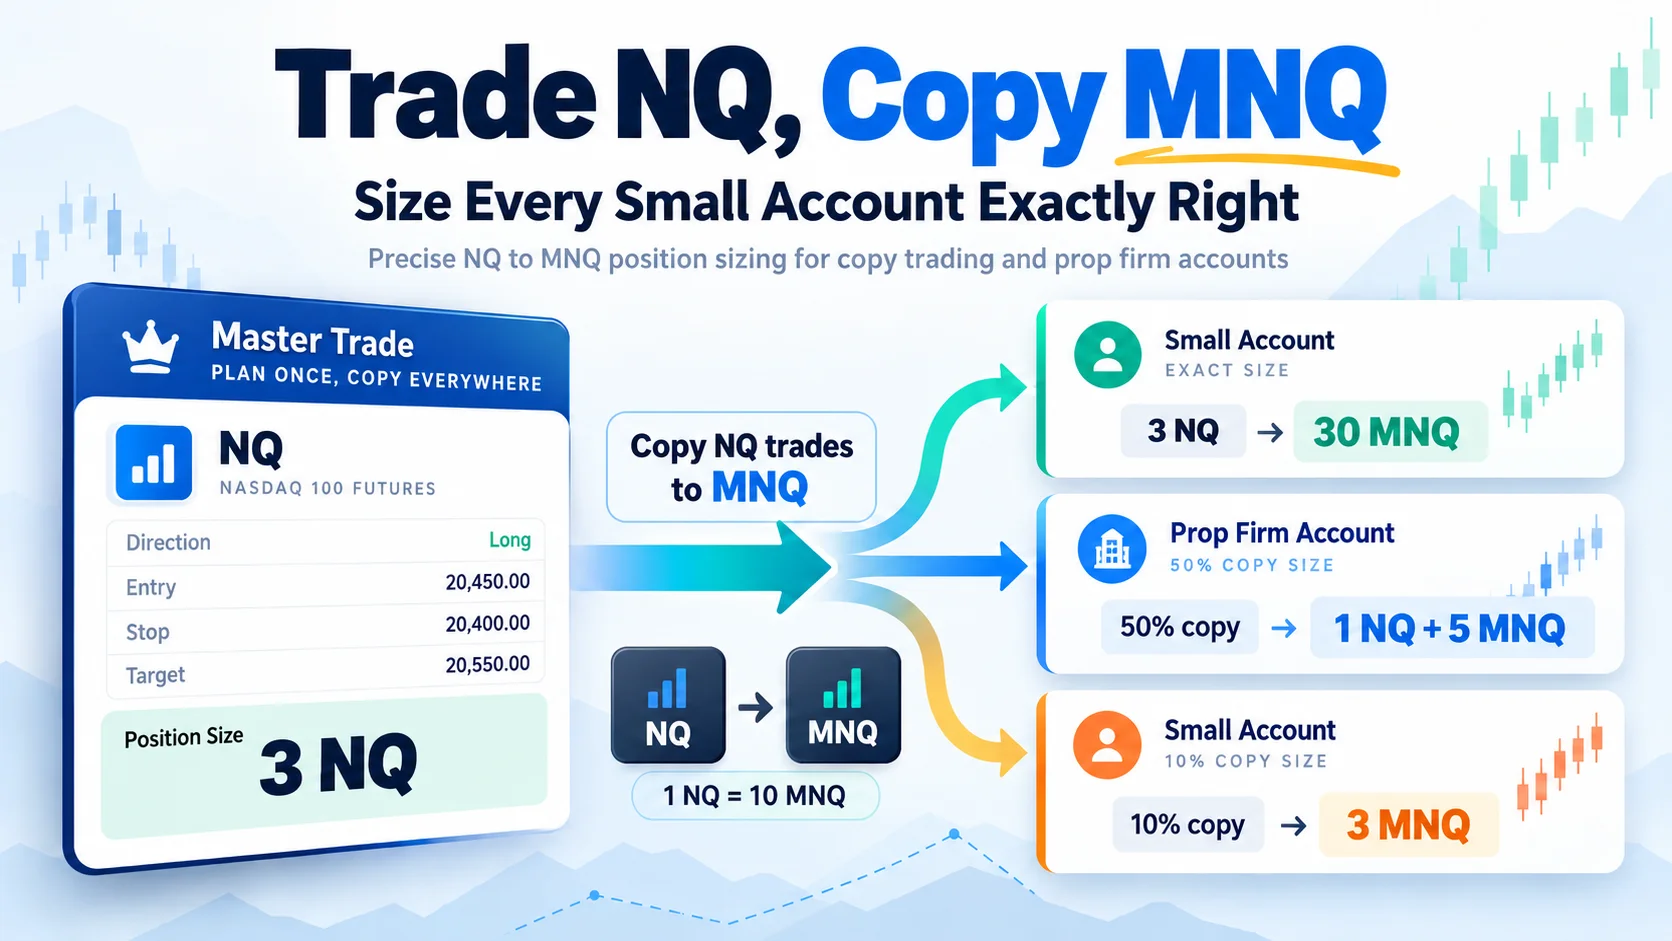
Trade NQ, Copy MNQ: Copy NQ Trades to MNQ in NinjaTrader 8
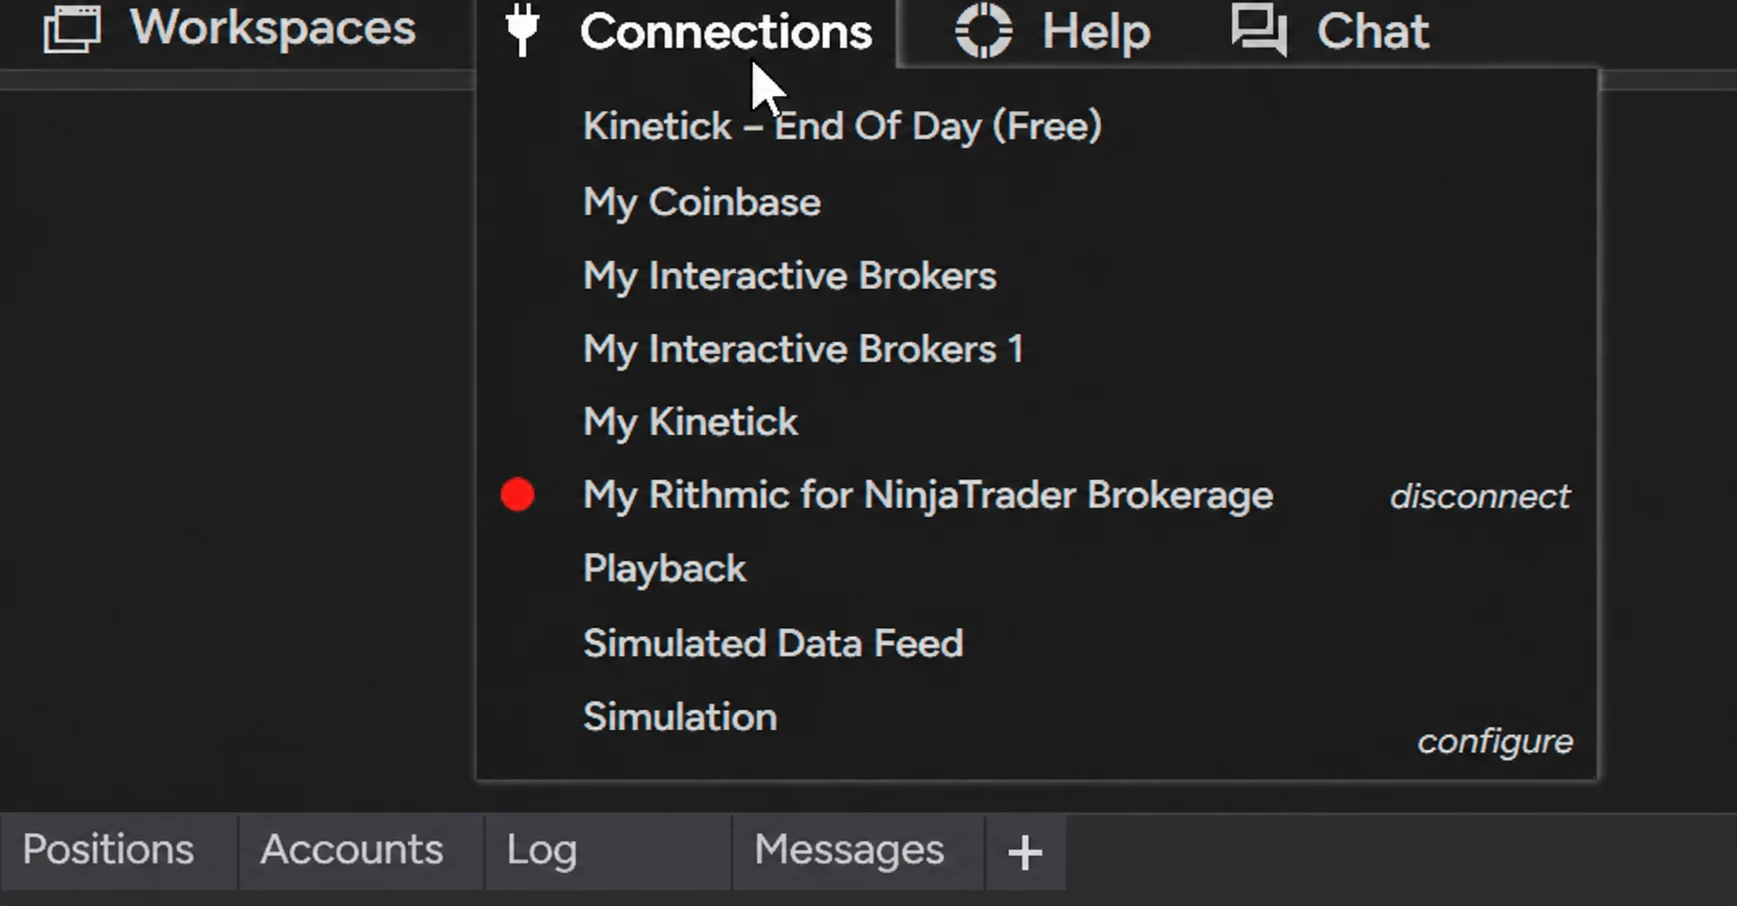
NinjaTrader Data Feed Not Updating? Quick Fixes

NinjaTrader Risk Per Trade: Risk $500 on Every Trade
NinjaTrader 8.1.8 Review: Should You Upgrade or Wait?
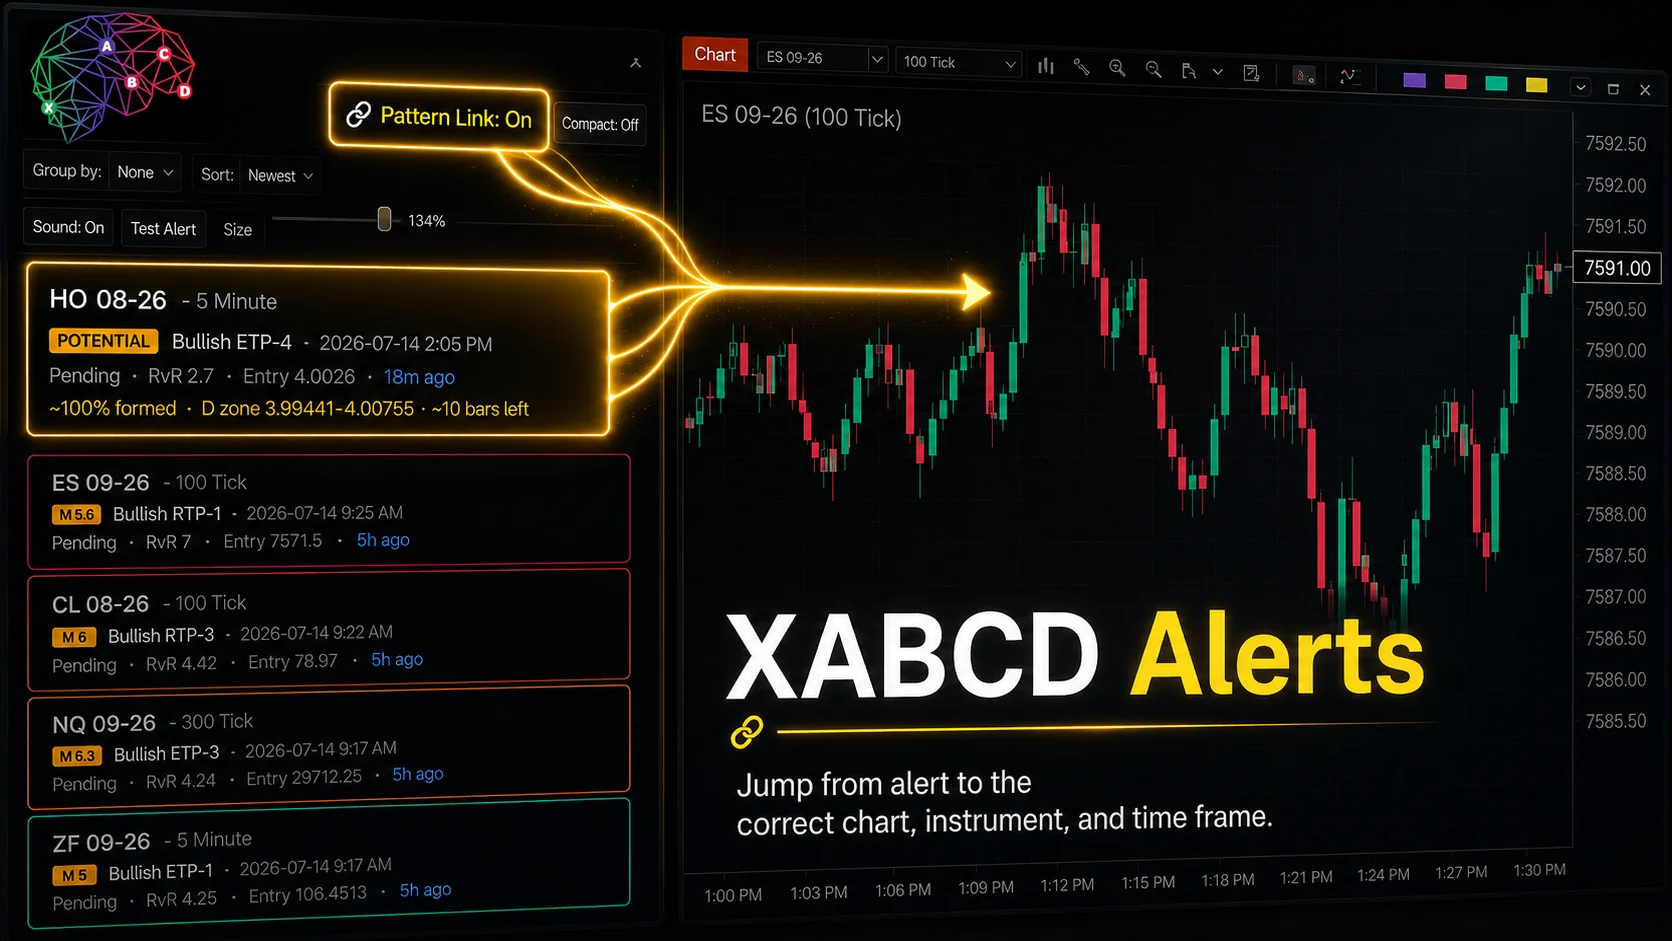
XABCD Pattern Alerts: The Complete Guide for Traders
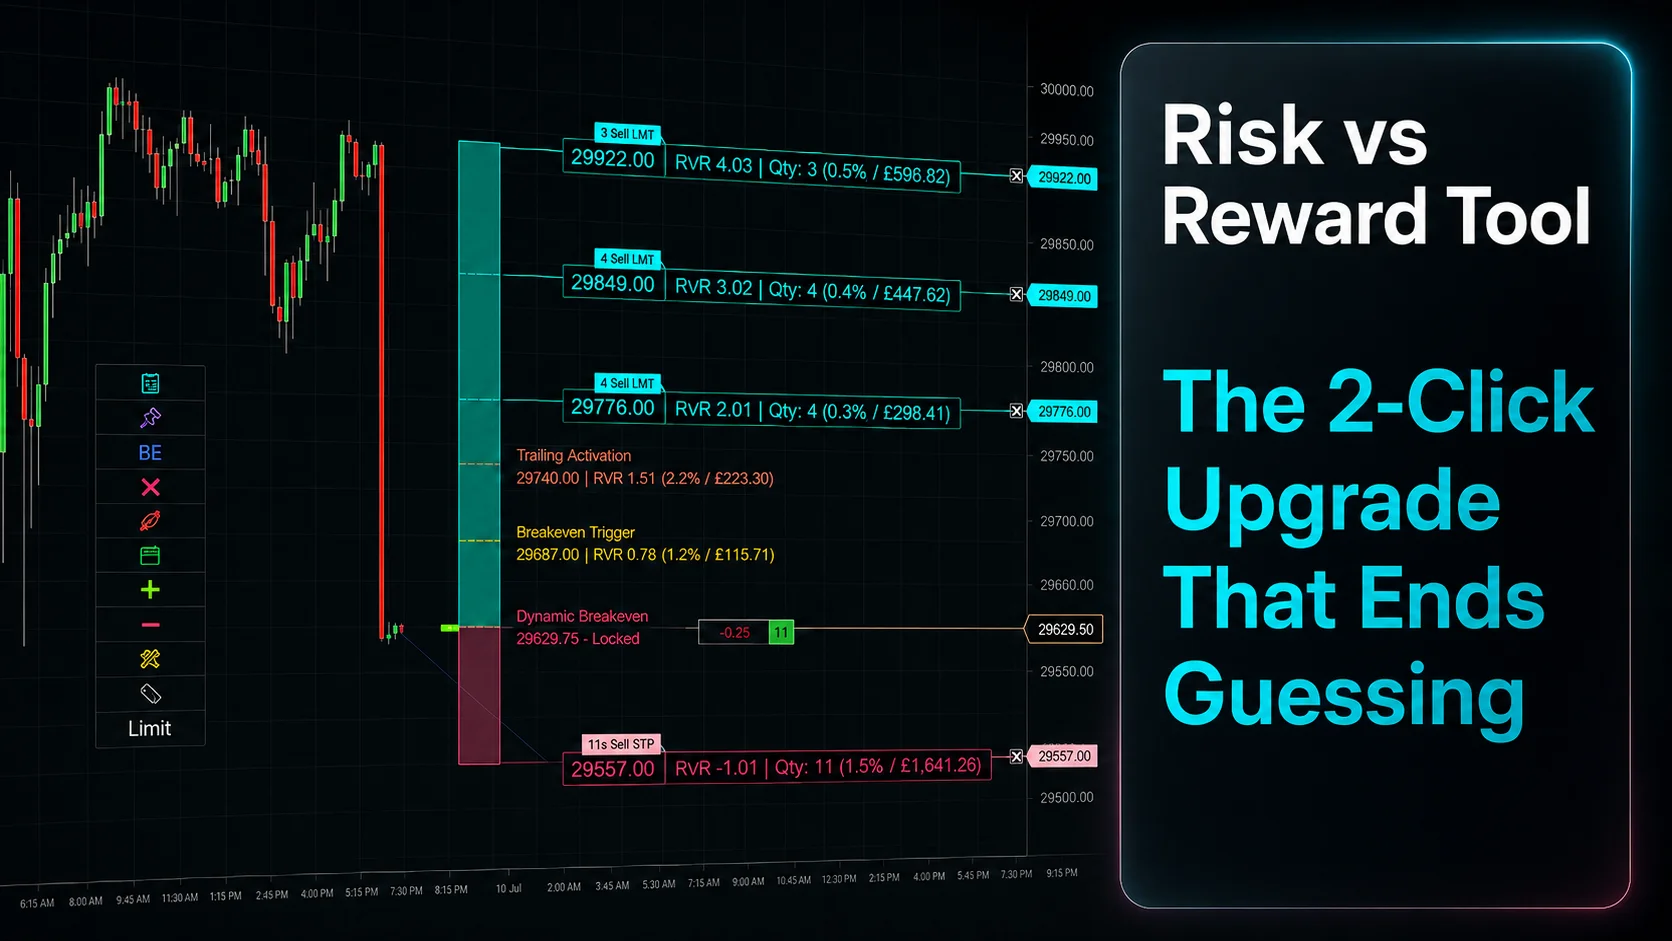
Risk vs Reward Tool: The 2-Click Upgrade That Ends Guessing
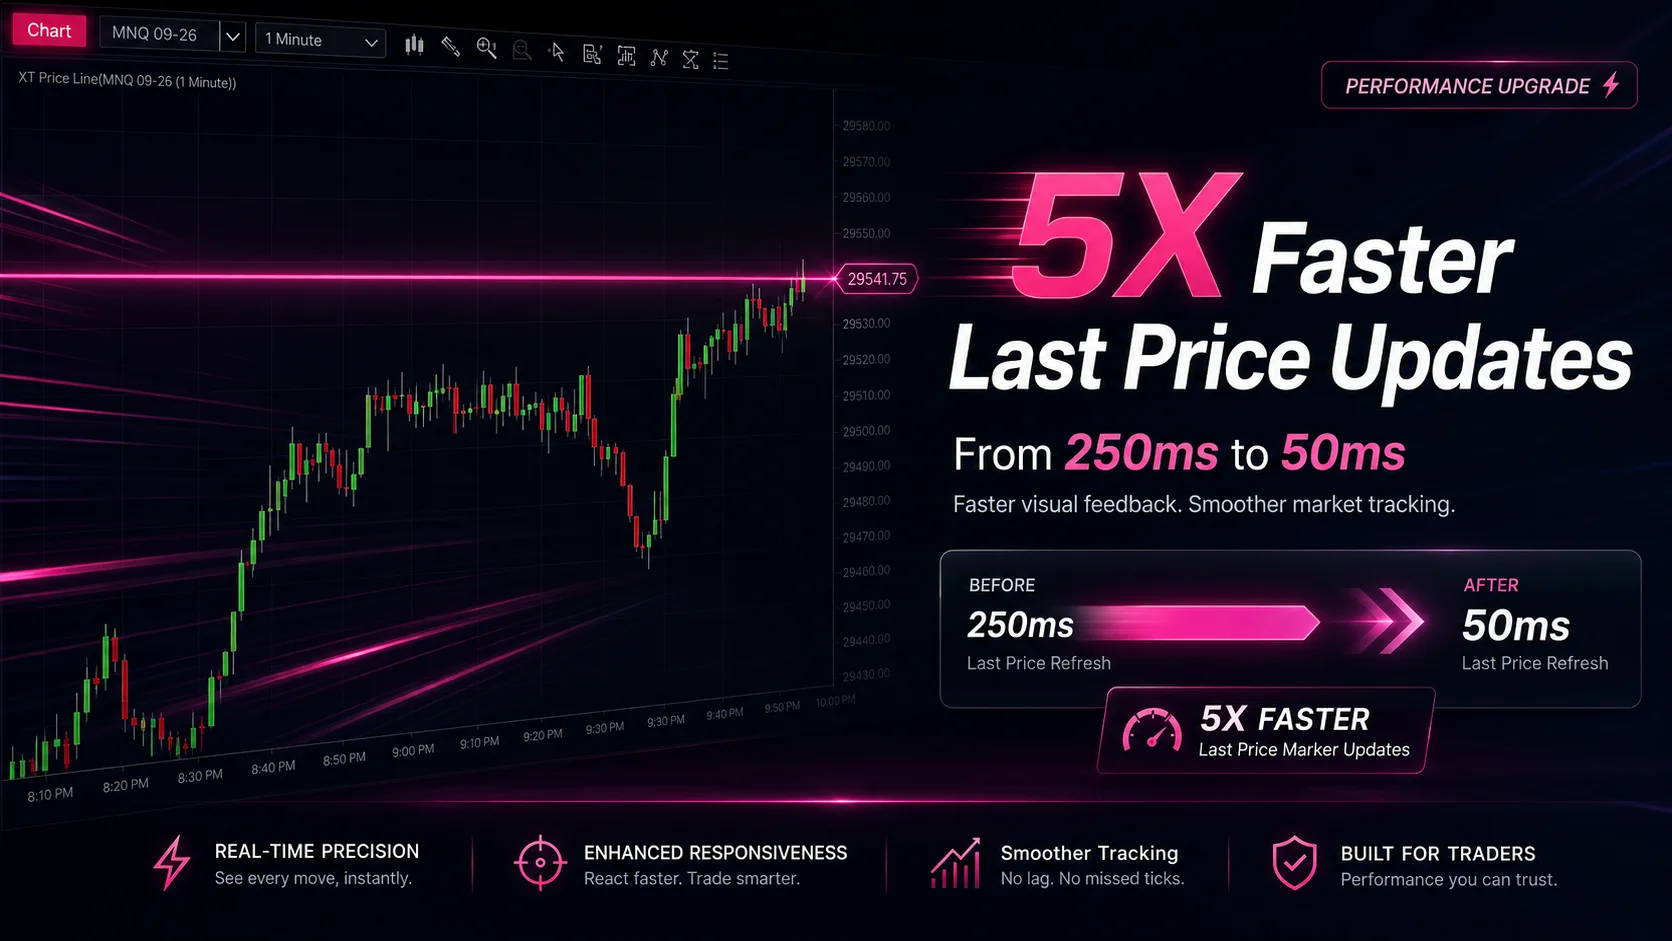
NinjaTrader Faster Last Price Updates on Charts Explained
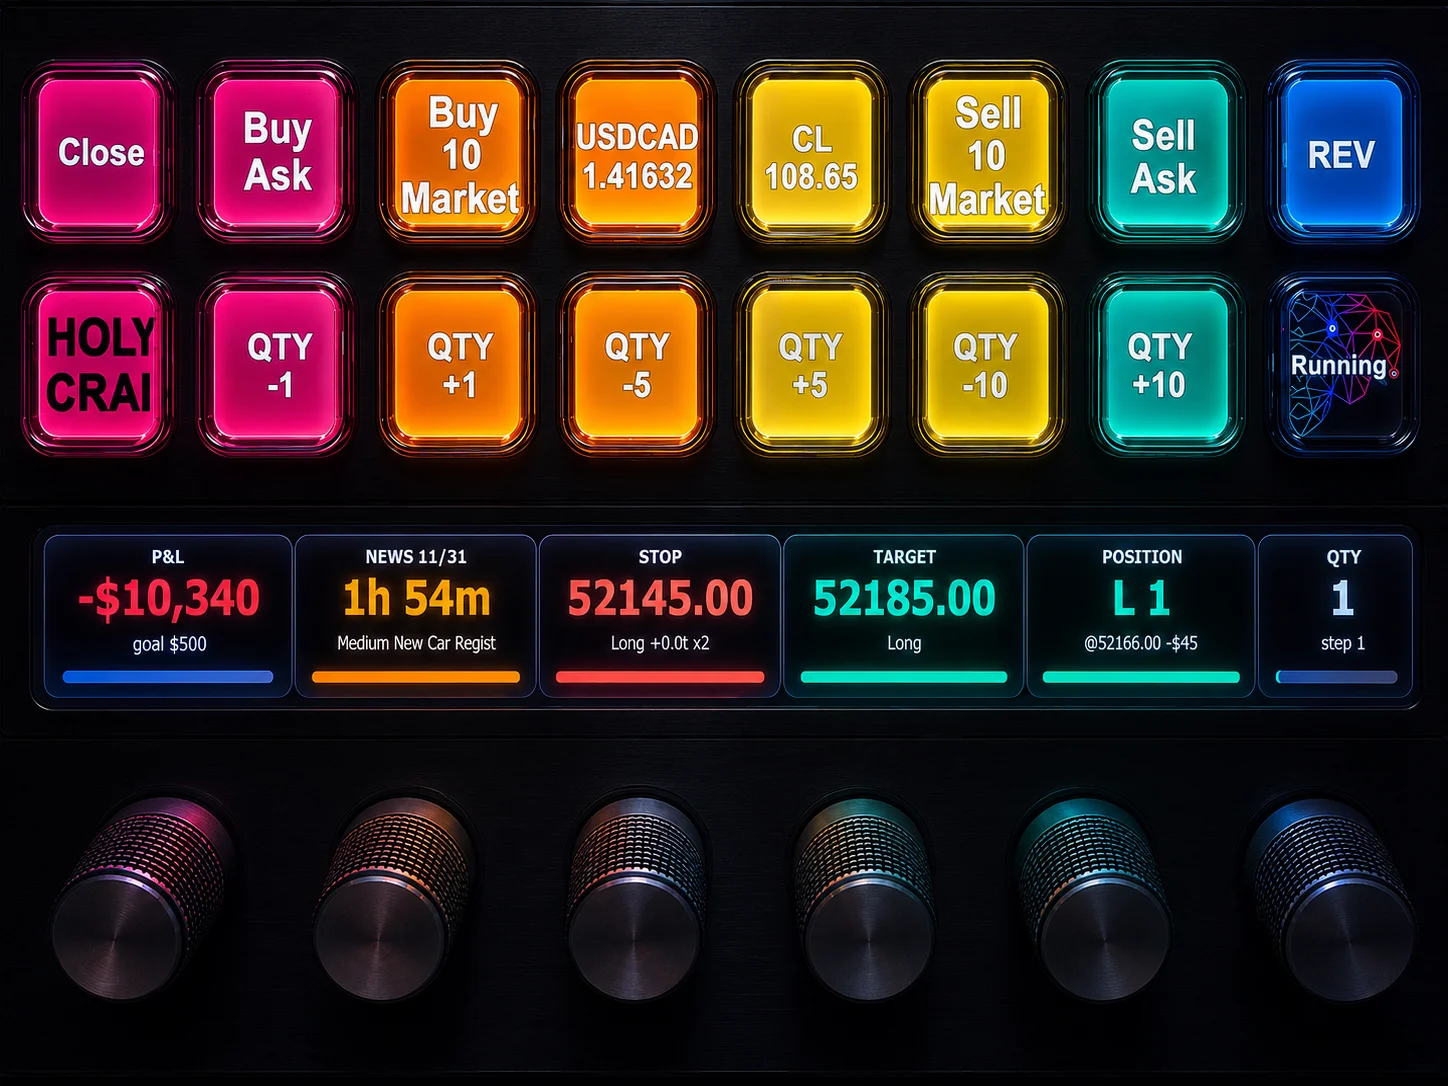
NinjaTrader 8 Hotkeys: Best Shortcuts for Faster Trading
NinjaTrader Position Sizing Tool: 64 Features Stock NT8 Does Not Include